INFECTIOUS DISEASE MODELLING - SCIENCEOPEN
←
→
Page content transcription
If your browser does not render page correctly, please read the page content below
Infectious Disease Modelling 6 (2021) 898e908

                                                   Contents lists available at ScienceDirect

                                             Infectious Disease Modelling
                                        journal homepage: www.keaipublishing.com/idm

Monitoring the impact of Movement Control Order (MCO) in
flattening the cummulative daily cases curve of Covid-19 in
Malaysia: A generalized logistic growth modeling approach
Nicholas Tze Ping Pang a, Assis Kamu b, *, Mohd Amiruddin Mohd Kassim a,
Chong Mun Ho b
a
 Faculty of Medicine and Health Sciences, Universiti Malaysia Sabah, Jalan UMS, 88400, Kota Kinabalu, Sabah, Malaysia
b
 Mathematics With Economics Programme, Faculty of Science and Natural Resources, Universiti Malaysia Sabah, Jalan UMS, 88400,
Kota Kinabalu, Sabah, Malaysia

a r t i c l e i n f o                              a b s t r a c t

Article history:                                   Introduction: COVID-19 has affected almost every country in the world, which causing
Received 6 February 2021
                                                   many negative implications in terms of education, economy and mental health. Worry-
Received in revised form 25 June 2021
                                                   ingly, the trend of second or third wave of the pandemic has been noted in multiple re-
Accepted 17 July 2021
Available online 21 July 2021                      gions despite early success of flattening the curve, such as in the case of Malaysia, post
Handling editorDr Lou Yijun                        Sabah state election in September 2020. Hence, it is imperative to predict ongoing trend of
                                                   COVID-19 to assist crucial policymaking in curbing the transmission.
Keywords:                                          Method: Generalized logistic growth modelling (GLM) approach was adopted to make
COVID-19                                           prediction of growth of cases according to each state in Malaysia. The data was obtained
Malaysia                                           from official Ministry of Health Malaysia daily report, starting from 26 September 2020
Generalized logistic growth modelling              until 1 January 2021.
Forecast
                                                   Result: Sabah, Johor, Selangor and Kuala Lumpur are predicted to exceed 10,000 cumula-
                                                   tive cases by 2 February 2021. Nationally, the growth factor has been shown to range
                                                   between 0.25 to a peak of 3.1 throughout the current Movement Control Order (MCO). The
                                                   growth factor range for Sabah ranged from 1.00 to 1.25, while Selangor, the state which has
                                                   the highest case, has a mean growth factor ranging from 1.22 to 1.52. The highest growth
                                                   rates reported were in WP Labuan for the time periods of 22 Nov - 5 Dec 2020 with growth
                                                   rates of 4.77. States with higher population densities were predicted to have higher cases
                                                   of COVID-19.
                                                   Conclusion: GLM is helpful to provide governments and policymakers with accurate and
                                                   helpful forecasts on magnitude of epidemic and peak time. This forecast could assist
                                                   government in devising short- and long-term plan to tackle the ongoing pandemic.
                                                   © 2021 The Authors. Publishing services by Elsevier B.V. on behalf of KeAi Communications
                                                   Co. Ltd. This is an open access article under the CC BY license (http://creativecommons.org/
                                                                                                                                 licenses/by/4.0/).

  * Corresponding author. Faculty of Science & Natural Resources, Universiti Malaysia Sabah, Malaysia.
    E-mail addresses: nicholas@ums.edu.my (N.T.P. Pang), assis@ums.edu.my (A. Kamu), amiruddink@ums.edu.my (M.A. Mohd Kassim), cmho@ums.edu.my
(C.M. Ho).
    Peer review under responsibility of KeAi Communications Co., Ltd.

https://doi.org/10.1016/j.idm.2021.07.004
2468-0427/© 2021 The Authors. Publishing services by Elsevier B.V. on behalf of KeAi Communications Co. Ltd. This is an open access article under the CC
BY license (http://creativecommons.org/licenses/by/4.0/).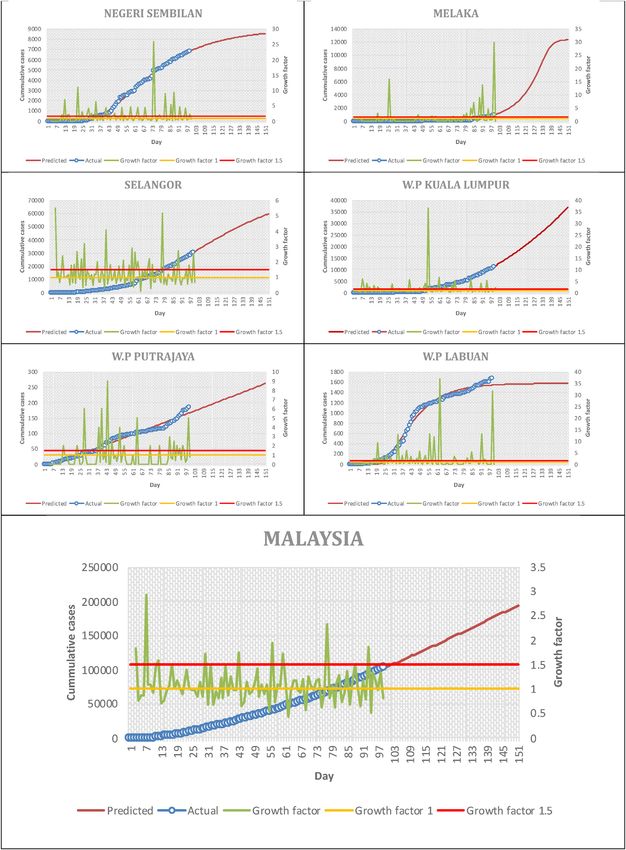
N.T.P. Pang, A. Kamu, M.A. Mohd Kassim et al.                                                  Infectious Disease Modelling 6 (2021) 898e908

1. Introduction

    Coronavirus disease 19 (COVID-19) has inundated the whole world ever since its emergence in Wuhan, China in late 2019
(Lau et al., 2020). Over the year 2020, it has afflicted almost every country round the world, resulting in unprecedented
multiple lockdowns and great consequent disruption to livelihood, education, employment, and mental health issues
(Coibion et al., 2020; Kassim et al., 2021; Kumar & Nayar, 2020; Mohd Kassim, Ayu, et al., 2020; Mohd Kassim, Pang, et al.,
2020; Mukhsam et al., 2020; Pang et al., 2020; Sahu, 2020). An especially worrying and puzzling trend is that it has re-
emerged in multiple regions of the world in second or even third successive waves, after previous lockdowns between
March to June 2020 succeeded in flattening the initial epidemiological curves (Ali, 2020; Bontempi, 2020; Looi, 2020;
Middleton et al., 2020; Zainudin et al., 2020).
    Hence, it is of paramount importance that epidemiologists and statisticians are able to predict trends in Covid-19 case
burdens at the initial tick or upswing of future waves. The generalized logistic model (GLM) was previously developed by
Richards in 1959 (Richards, 1959), and its empirical function demonstrates remarkable synchronicities with Ebola and SARS
data for the purpose of disease outbreak prediction (Glennon et al., 2019; Hirose, 2007). In the context of the current
pandemic, the GLM has been instrumental as an epidemiological model in predicting trends in the China mainland, Iran,
Philippines and Italy for Covid-19 caseloads (Ahmadi et al., 2020; Aviv-sharon & Aharoni, 2020; Martelloni & Martelloni,
2020; Pelinovsky et al., 2020; Wang et al., 2020; Wu et al., 2020a).
    Currently, Malaysia is gripped in the throes of a third more infectious and more deadly wave that originated at the tail end
of a state election in the state of Sabah on 26 Sept 2020 (Sukumaran, 2020; Zainudin et al., 2020). Sabah is situated on Borneo
island, together with Sarawak state and WP Labuan, and hence is only accessible by flight from all West Malaysian states.
However, at that time, despite the rising case figures in Sabah, there were no movement restrictions throughout the country,
and Covid-19 swabs were not required to travel from state to state. As a result, from a previous low of single digit Covid-19
cases throughout Malaysia, the number of cases gradually grew to hit the thousands, with the pandemic spread encom-
passing the entire nation due to the double jeopardy of uncontrollable outbreaks in detention centers and workers’ dor-
mitories (Anand, 2020; Liew, 2021). The latter especially resulted in an overspill due to overcrowding and free access to local
communities, with consequent widespread community infection. As a result, various iterations of a Conditional Movement
Control Order (CMCO) was reimplemented in Malaysia in the first month of October in various states, chiefly involving Sabah,
Selangor, and WP Kuala Lumpur. After a period where pandemic spread appeared to have been quelled, free movement was
reinstated throughout the country in December 2020, during the year-end holidays, causing high amount of movement
between states that had higher and lower infectivity (Rahman, 2021). At the current moment, Malaysia is struggling to
emerge from this current wave, with case numbers in the past few weeks equaling those of the entire preceding period.
Hence, it is more crucial than ever that we marry epidemiology and clinical medicine, putting current epidemiological data to
good use to make instant predictions about future trends that can help national governments plan and refine policies that
straddle the balance between economic insecurity and judicious lockdowns.

2. Methods

    Official data was obtained, stratified into the 15 states and federal territories of Malaysia, from the Ministry of Health official
daily statistics (Ministry of Health Malaysia, 2021), which was extracted from the official Ministry of Health website. The first day
of data collection was 26 September 2020, the day on which the state election happened that triggered the national third wave
of infections. Prior to the election, case loads in Malaysia had stabilized to single digits nationwide, and hence the election itself
was the trigger to which case loads expanded significantly; however, due to latency in testing, case loads only began to reflect
true burden of Covid-19 infection in the community two weeks after 26 September 2020. Data was obtained till 1 January 2021,
prior to the imposition of a stricter movement control order in response to the unremitting third wave of Covid-19 infection.
Hence, from 26 September 2020 to 1 January 2021, the nation was in the same phase of movement control, namely the Con-
ditional Movement Control Order, with slightly differing implementations between states depending on the National Security
Council instructions in each state-level administration center. The common themes of this CMCO were restriction of inter-
district movement in Sabah, Selangor and WP Kuala Lumpur from October to November 2020, shutting of non-essential
businesses in Sabah for the first two weeks of October, and restriction of all meetings and conventions.
    Previously, logistics models were developed by Verhulst in 1838, with the express function of performing growth
modelling on biological populations (Verhulst, 1838). This was extended in the 1950s by Richards et al. into Generalized lo-
gistic growth to account for more flexible S-shape curvatures, leading to increasing asymmetry in growth curves (Richards,
1959). There are four parameters to be estimated in the model, namely the upper asymptote or the maximum cumulative case
incidence ðKÞ, the intrinsic growth rate during the exponential phase ðrÞ, the point of inflection or the turning point which is
the time where maximum number of cases per day occur ðtm Þ, and the parameter that in part determines the point of in-
flection ðdÞ. The model has been recently used by many researchers to predict the cumulative number of daily cases of Covid-
19 (Aviv-sharon & Aharoni, 2020; Jain et al., 2020; Wu et al., 2020b). The cumulative cases, C at time t is estimated as follows:

                                    1=
        Ct ¼ K∞ 1 þ ðd  1Þerðttm Þ ð1dÞ

                                                                 899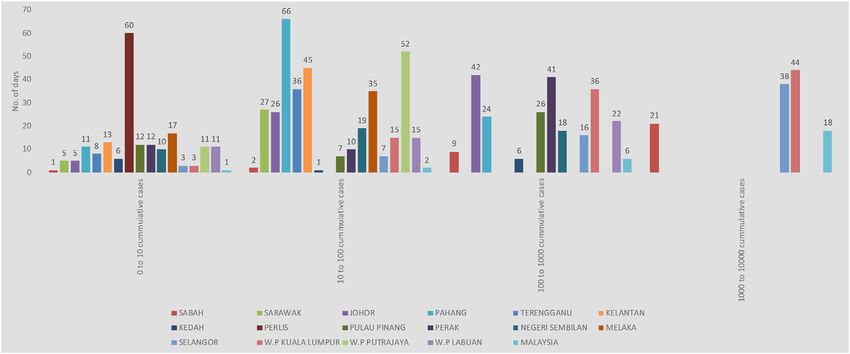
N.T.P. Pang, A. Kamu, M.A. Mohd Kassim et al.                                                                   Infectious Disease Modelling 6 (2021) 898e908

    Noise in the data contributes to uncertainty in parameter estimates within this system. In efforts to estimate uncertainty
inherent in the model estimates and construct the 95 % confidence intervals, a parametric bootstrap approach was employed
to randomly generate multiple samples from the best-fit curve of the empirical distribution of the parameters. For each of the
states’ data sets, 1000 bootstrap iterations were computed. With these four estimated model parameters, we then estimate
the cumulative cases on day 115 and 130 with 95 % prediction intervals. NCSS statistical software version 11 was used during
the analysis.
    Multiple assumptions were inherent. Firstly, as the number of daily cases is influenced by the daily volume of tests
conducted, it was implicitly assumed that a similar number of tests were performed daily. Secondly, due to strict international
travel regulations, there was little to no importation of foreign cases. Thirdly, as there were strict clampdowns on any form of
mass gatherings, Covid-19 was permitted to run its natural epidemiological course; hence human behaviour did not need to
be factored into the model. Fourthly, it was implied that there was continuous imposition of various national regulatory
measures, including heightened personal hygiene, isolation, vigorous contact tracing, restrictions on social contacts and
transportation migration, are maintained continuously.

3. Results

 i. Comparing the number of days taken to record 10th, 100th, 1000th, and 10000th case

   Fig. 1 demonstrates the number of days it has taken each individual state to reach the next power of ten in number of cases.
Higher bars at higher numbers of cases are hence the desired outcome, with the ideal outcome being a very high red bar
without any successive coloured bars appearing. Perlis clearly never exceeds 100 cumulative cases, as it went 60 days without
moving to the next power of 10. Most other states demonstrated corresponding increases in number of days to reach the next
power of 10, with the exception of Pahang, Kedah and Negeri Sembilan. In an illustrative example, Pahang took 65 days to get
from 10 to 100 cases, but subsequently only took 24 days to get from 100 to 1000 cases. Kedah also experienced an expo-
nential rise where it took 1 day to get from 10 to 100, and only 6 days to get from 100 to 1000. Fig. 2 demonstrates the same
data but collated by 10x cases, demonstrating that in the time period concerned only three states e Sabah, Selangor, and WP
Kuala Lumpur managed to exceed the threshold of 10000 cases.

ii. Predicting the cumulative cases using generalized logistic growth model

Table 1 demonstrates the predicted cumulative cases on Day 115 and Day 130 of the current MCO after the Sabah state
election. Sabah, Johor, Selangor and WP Kuala Lumpur are the main states that are predicted to exceed 10,000 cases, with
Negeri Sembilan and Melaka predicted to exceed 8000 cases by the 2 February 2021 timepoint.
   Table 2 shows the estimated four parameters of the model for each state. There are three states with the negative sign of
inflection point ðdÞ, which are Pahang, Terengganu, and Kedah. For a logistic model, the sign should be positive which rep-
resents a rising point of inflection. The negative sign means that the point is a falling point of inflection. In other words, the
trends of cumulative cases in the states particularly during the studied period are not following a logistic pattern. Therefore,
the suggested model which is generalized logistic growth model is not appropriate to be used in these three states.
   Growth factor is defined as follows:

                                    Fig. 1. Number of days taken to record 10th, 100th, 1000th, and 10000th case by state.

                                                                             900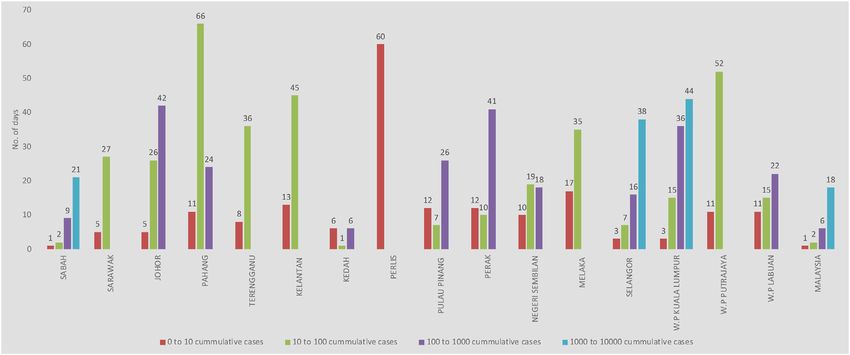
N.T.P. Pang, A. Kamu, M.A. Mohd Kassim et al.                                                                   Infectious Disease Modelling 6 (2021) 898e908

                                Fig. 2. Number of days taken to record 10th, 100th, 1000th, and 10000th case by case category.

Table 1
Predicted cumulative cases on Day 115 (18 January 2021) and Day 130 (2 February 2021) by state.

  State                    Day 115 (18 January 2021)                                          Day 130 (2 February 2021)

                           Predicted cumulative cases       Bootstrap confidence               Predicted cumulative cases         Bootstrap confidence
                                                            limits at 0.95 confidence                                             limits at 0.95 confidence
                                                            level                                                                level

                           Bootstrap mean                   Lower            Upper            Bootstrap mean                     Lower           Upper
  Sabah                    37430.07                         37082.83         37820.65         38691.37                           38174.54        39225.96
  Sarawak                  382.40                           374.46           389.45           382.41                             374.43          389.47
  Johor                    12911.00                         11315.10         16305.13         26781.94                           18282.91        40532.44
  Pahang                   1328.75                          828.96           1669.20          1697.94                            678.64          2194.10
  Terengganu               216.55                           205.14           227.59           240.24                             223.87          254.56
  Kelantan                 771.46                           599.15           1004.49          1021.21                            636.47          1430.42
  Kedah                    2580.62                          2483.01          2621.19          2631.20                            2506.43         2671.67
  Perlis                   12.87                            11.39            13.27            12.92                              10.32           13.29
  Pulau Pinang             3973.48                          3925.69          4001.10          4592.02                            4526.43         4624.04
  Perak                    3082.74                          3027.03          3174.54          3119.18                            3046.95         3227.55
  Negeri Sembilan          7693.87                          7504.79          7860.38          8177.70                            7856.62         8449.05
  Melaka                   2992.15                          2408.84          3572.37          8077.01                            5952.13         10270.33
  Selangor                 41534.78                         40022.47         43542.67         50194.96                           46279.61        54642.53
  WP Kuala Lumpur          18128.14                         17323.09         18785.93         25579.52                           23331.73        27247.11
  WP Putrajaya             196.92                           189.88           206.98           224.53                             215.06          239.02
  WP Labuan                1565.99                          1505.84          1631.77          1574.07                            1503.42         1644.16
  MALAYSIA                 130546.86                        129528.88        131515.02        157130.26                          155456.37       158462.46

Table 2
Parameters of the generalized logistic growth models by state.

  State                               K                          d                       r                     tm                        Pseudo R-squared
  Sabah                               41144.01                   0.50                    0.03                  30.01                     0.999
  Sarawak                             382.11                     2.33                    0.14                  38.04                     0.993
  Johor                               456494.42                  1.38                    0.03                  190.11                    0.996
  Pahang                              5925.21                    0.17                   0.00                  32.13                     0.964
  Terengganu                          1270.989                   0.104                  0.001                 73.005                   0.963
  Kelantan                            7247.323                   0.592                   0.005                 186.579                   0.970
  Kedah                               2756.87                    1.11                   0.02                  35.01                    0.967
  Perlis                              12.82                      8.51                    0.14                  64.91                     0.919
  Pulau Pinang                        92742.152                  0.106                   0.001                 201.042                   0.996
  Perak                               3138.37                    2.22                    0.09                  69.77                     0.998
  Negeri Sembilan                     8976.12                    0.74                    0.03                  57.01                     0.998
  Melaka                              12357.10                   6.09                    0.34                  131.20                    0.954
  Selangor                            78959.31                   1.16                    0.02                  98.94                     0.998
  WP Kuala Lumpur                     257385.12                  0.79                    0.01                  216.93                    0.997
  WP Putrajaya                        4116.351                   0.071                   0.001                 136.965                   0.976
  WP Labuan                           1576.30                    0.62                    0.06                  33.95                     0.991
  MALAYSIA                            2397160.2                  0.4                     0.0                   306.3                     0.999

Note: Day 1 is 25 Sep 2020 and the predicted cumulative cases were estimated using a generalized logistic growth model.

                                                                             901
N.T.P. Pang, A. Kamu, M.A. Mohd Kassim et al. Infectious Disease Modelling 6 (2021) 898e908
ftþ1 ft
Gtþ1 ¼
ft ft1
where ft is the total cases at time t, and Gtþ1 is the growth factor at time t.
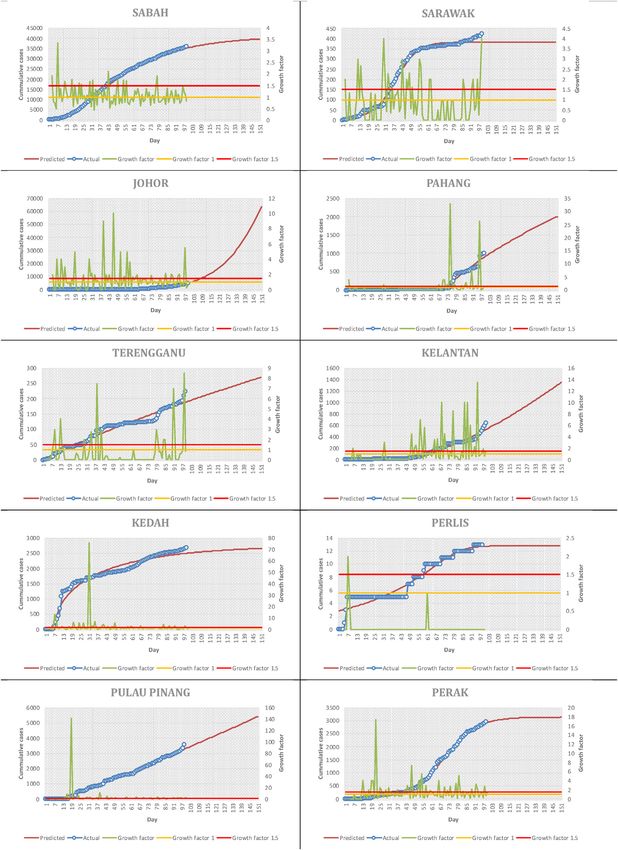
Fig. 3 demonstrates the number of cases using the generalized logistic growth model, both nationally and by state. Na-
tionally, the growth factor has been shown to range between 0.25 to a peak of 3.1 throughout the current MCO. The actual
number of cases is fairly similar in trend to that predicted by the generalized logistic growth model. For the states, the 4 states
with the highest number of cases e Sabah, Johor, Selangor and WP Kuala Lumpur have actual cumulative cases that mapped
exactly onto the predicted cumulative cases. Terengganu, Kelantan, Sarawak and Kedah had actual cumulative cases that
peaked higher than the predicted cumulative cases, with no states having less actual cumulative cases compared to predicted
cumulative cases.
Table 3 demonstrates the level of the growth factor divided by 14 days intervals, corresponding with the conventional
duration of each MCO extension. The growth factor range for Sabah, the state where the election-related outbreak of case
figures, ranged from 1.00 to 1.25, with a narrow standard deviation of 0.22e0.72. Selangor, the other state where case
numbers have remained highest throughout the MCOs, has a mean growth factor ranging from 1.22 to 1.52, with a standard
deviation ranging from 0.64 to 1.25. Otherwise, the highest growth rates reported were in WP Labuan for the time periods of
22 Nov - 5 Dec 2020 and 20 Dec - 1 Jan 2021, with growth rates of 4.77 and 4.65 respectively.
Table 4 shows the distribution and density of population across states in Malaysia. The most populous states are Selangor
(6.5 millions), Sabah (3.9 millions) and Johor (3.7 millions), whereas the least populous are Perlis (255 thousands), WP
Putrajaya (109 thousands) and WP Labuan (100 thousands). In perspective, states with higher population density include WP
Kuala Lumpur, WP Putrajaya, Pulau Pinang and Selangor. On the other hand, the states with lower population density include
Sarawak, Sabah, Pahang and Terengganu.
4. Discussion
Prediction of Covid-19 epidemiological patterns is crucial as many nations have experienced great economic privation and
breakdown of social support structures in the light of the prolonged and repeated Covid-19 waves of infection (Catal a et al.,
2020; Holmdahl & Buckee, 2020; Wang et al., 2020). Hence, it is crucial that GLM is used to produce instantaneous predictions
of future trends, so that policymakers can plan accordingly (Alharbi et al., 2020; Bonneche re et al., 2021; Harvey & Kattuman,
2021). Since the GLM is trained on the existing data and is designed to fit the development of epidemic curves, rather than EID
estimation only, it could provide a good fit to the limited available COVID-19 epidemiological data to characterize the
transmission dynamics process and the trajectory of COVID-19 pandemic along with the impact of interventions (Wang et al.,
2012). This prediction aims mainly to assess when the control measures that were implemented after the state election can
result in peaking of case numbers, in order to allow swifter loosening of movement controls and permit economic activity to
resume. Also, the predictions also feature abrupt variations of growth factors as well as different patterns in growth factors in
different regions, as per Table 2. This is owing to the emergence of spontaneous clusters due to unchecked transmissions
secondary to covert violations of the Covid-19 standard operating procedures. Hence, certain states with historically low
infection numbers, e.g. WP Labuan, have sudden surges in growth factors due to the emergence of clusters. However, it is
demonstrable that such growth factor surges stabilise within a few weeks, also due to the judicious use of Enhanced
Movement Control Orders in Malaysia in neighbourhoods with high infectivity rates, which reduce transmissibility to other
adjacent neighbourhoods and allow mass testings to be performed, weeding out pockets of asymptomatic infection.
These figures suggest that despite caseloads being high in the state of Sabah where the election took place, the growth
factors stabilized rapidly. This was due to Sabah implementing much stricter movement control measures compared to the
rest of Malaysia, with strict limitations of inter-district movement, shutdown of all economic sectors apart from essential
services for two weeks, and restriction of opening hours of all open essential economic sectors during working hours only
(Azil, 2020; Nik Anis, 2020). Inter-district travel restrictions were only loosened for a brief interregnum of one month in
December 2020 in Sabah state, and were unfortunately reimposed in mid-January 2021 after a rise in case numbers in the rest
of the country. In contrast, other states with higher caseloads, for instance Selangor and WP Kuala Lumpur, did not implement
a strict movement control order, as most economic sectors remained open throughout October and November (Lim, 2020).
The only superficial similarity in MCO in these states was the inter-district movement restriction.
Also, geographically, there was freer mixing of individuals in the 11 states and 2 federal territories of West Malaysia (all
except Sabah, Sarawak and WP Labuan), as there was no requirement to have a negative Covid-19 swab before travelling to
other states. This contrasted to strict entry and exit requirements imposed in Sabah, Sarawak and WP Labuan, where negative
tests were required upon entry and exit (Geraldine, 2020; Ling, 2020). In Sarawak, this was compounded by a compulsory 14-
day quarantine for all returning travellers, with entry and exit swabs (Chiam, 2021). This was reflected in the significantly
lower case numbers and relatively low growth factors for Sarawak compared to the rest of the West Malaysian states. Also, as
Sabah and Sarawak states are geographically far more isolated and larger, whereas most West Malaysian states had relatively
denser population ratios and higher proportions of high rise, high density living, even though cases were no doubt higher in
volume initially in Sabah state, it was more difficult for the virus to infect and disperse (Yaakub et al., 2020).
902N.T.P. Pang, A. Kamu, M.A. Mohd Kassim et al. Infectious Disease Modelling 6 (2021) 898e908
Fig. 3. Actual cumulative cases, predicted cumulative cases, and growth factor plot by state.
903N.T.P. Pang, A. Kamu, M.A. Mohd Kassim et al. Infectious Disease Modelling 6 (2021) 898e908
Fig. 3. (continued).
904N.T.P. Pang, A. Kamu, M.A. Mohd Kassim et al. Infectious Disease Modelling 6 (2021) 898e908
Table 3
Growth factor every 14 days interval by state.
State Growth factor every 14 days interval
27 Sep - 10 Oct 11 Oct - 24 Oct 25 Oct - 7 Nov 8 Nov - 21 Nov 22 Nov - 5 Dec 6 Dec - 19 Dec 20 Dec - 1 Jan
2020 2020 2020 2020 2020 2020 2021
SABAH Mean 1.25 1.15 1.07 1.03 1.03 1.00 1.04
Median 1.01 1.01 1.04 .81 1.06 .88 1.02
Standard .72 .39 .48 .41 .22 .36 .22
Deviation
SARAWAK Mean 1.23 .95 1.32 1.18 .93 .64 1.36
Median 1.00 .00 1.33 1.00 1.00 .56 1.50
Standard .99 1.38 .78 1.01 .84 .73 1.15
Deviation
JOHOR Mean 1.49 1.38 1.76 2.22 1.17 1.10 1.41
Median 1.00 .58 1.25 .84 1.26 .99 .97
Standard 1.40 1.61 2.29 2.80 .48 .48 1.38
Deviation
PAHANG Mean .75 .42 .00 . 1.41 3.74 3.24
Median .25 .00 .00 . .13 1.50 .92
Standard 1.36 .80 .00 . 1.83 8.86 7.15
Deviation
TERENGGANU Mean 1.06 .53 1.55 .12 .25 1.13 2.12
Median .67 .25 .40 .00 .00 .76 .67
Standard 1.34 .78 2.38 .16 .50 1.04 3.23
Deviation
KELANTAN Mean .64 1.00 .00 2.17 2.19 2.62 2.34
Median .50 .50 .00 1.00 1.24 .67 1.00
Standard .75 1.41 .00 2.25 2.65 3.97 3.67
Deviation
KEDAH Mean 2.70 7.03 1.90 1.47 1.32 1.24 1.11
Median 1.21 .51 1.33 1.03 1.14 .84 .75
Standard 3.79 19.97 1.94 1.48 .81 1.09 .96
Deviation
PERLIS Mean 1.00 . . .00 .33 .00 .00
Median 1.00 . . .00 .00 .00 .00
Standard 1.00 . . .00 .58 . .
Deviation
PULAU PINANG Mean 1.46 11.35 2.26 1.18 1.24 1.19 1.30
Median .38 .79 1.19 .89 1.02 1.13 1.21
Standard 2.56 37.35 3.08 .78 .83 .75 .64
Deviation
PERAK Mean 1.11 2.64 1.27 1.89 1.31 1.58 1.34
Median 1.00 1.29 1.00 .90 .91 1.22 1.15
Standard 1.27 4.44 .74 2.24 1.01 1.40 .99
Deviation
NEGERI Mean 1.29 2.32 1.61 1.56 1.29 3.55 2.01
SEMBILAN Median .50 1.42 1.11 1.05 .81 .93 .65
Standard 2.08 2.99 1.73 1.45 1.38 6.85 2.64
Deviation
MELAKA Mean .43 2.20 .20 1.08 .50 1.87 4.77
Median .00 1.00 .00 1.00 .00 1.00 .64
Standard .53 4.66 .38 .88 .76 2.15 8.62
Deviation
SELANGOR Mean 1.52 1.27 1.30 1.25 1.23 1.29 1.22
Median 1.12 1.14 1.04 .93 1.37 .97 .94
Standard 1.25 .85 .94 .82 .64 1.18 .73
Deviation
W.P KUALA Mean 1.69 1.32 1.35 3.82 1.88 1.29 1.53
LUMPUR Median .93 1.00 1.03 .98 1.14 .96 1.01
Standard 1.68 .91 1.30 9.48 1.97 1.30 1.49
Deviation
W.P PUTRAJAYA Mean .63 1.10 2.03 1.10 1.33 .77 1.43
Median .50 .50 .50 .80 .50 .25 1.00
Standard .69 1.84 3.01 1.19 1.97 1.13 1.31
Deviation
W.P LABUAN Mean .35 2.09 2.38 3.00 4.77 1.28 4.65
Median .00 1.11 1.00 .96 .35 .84 1.00
Standard .67 2.57 3.39 4.36 12.13 1.52 9.65
Deviation
MALAYSIA Mean 1.21 1.11 1.05 1.04 1.05 1.07 1.11
Median 1.00 1.00 .97 1.02 1.06 1.01 1.16
(continued on next page)
905N.T.P. Pang, A. Kamu, M.A. Mohd Kassim et al. Infectious Disease Modelling 6 (2021) 898e908
Table 3 (continued )
State Growth factor every 14 days interval
27 Sep - 10 Oct 11 Oct - 24 Oct 25 Oct - 7 Nov 8 Nov - 21 Nov 22 Nov - 5 Dec 6 Dec - 19 Dec 20 Dec - 1 Jan
2020 2020 2020 2020 2020 2020 2021
Standard .59 .26 .34 .34 .30 .44 .37
Deviation
Table 4
Distribution of population across states in Malaysia.
State Population (x 1000) Area (Km2) Density (Population/Area)
Selangor 6569.5 9773 672.2
Sabah 3907.5 73,631 53.1
Johor 3776.6 19,210 196.6
Sarawak 2828.7 124,450 22.7
Perak 2518.6 21,035 119.7
Kedah 2193.9 9500 230.9
Kelantan 1904.9 15,099 126.2
Pulau Pinang 1783.6 1048 1701.9
WP Kuala Lumpur 1773.9 243 7300
Pahang 1682.2 36,137 46.6
Terengganu 1259 13,035 96.6
Negeri Sembilan 1135.9 6686 169.9
Melaka 936.9 1664 563
Perlis 255 821 310.6
WP Putrajaya 108.9 49 2222.4
WP Labuan 99.6 91 1094.5
Most of the states with higher number of positive cases are predominantly states with high level of population density,
such as Selangor, WP Kuala Lumpur and Johor. This finding corroborates the result of similar studies in Algeria, India, Nigeria
and United States, which suggesting that the spread of COVID-19 increases in accordance with higher level of population
density (Amoo et al., 2020; Babbitt et al., 2020; Bhadra et al., 2020; Kadi & Khelfaoui, 2020; Rocklo €v & Sjo
€din, 2020; Sy et al.,
2020; Yaakub et al., 2020). Peculiarly, Sabah, being the initial epicentre of the current third wave of the pandemic, also has
high number of cases, despite having low level of population density. However, majority of the Sabahans reside along the
coastline of Sabah instead of the interior mountainous part, and primarily concentrated over three major cities, namely Kota
Kinabalu, Sandakan and Tawau (Pedersen et al., 2011). As such, these cities have far bigger and higher population density
compared to other towns in Sabah, and thus, majority of the COVID-19 cases in Sabah were unsurprisingly from these three
cities (Sabah State Government, 2021).
Therefore, the GLM has been key in generating short-term and long-term forecasts of the trajectory of the pandemic in
various states in Malaysia with differing epidemiological risks that cover a variety of COVID-19 incidence rates. The model
highlights that stricter movement control orders, such as the one that was implemented in Sabah at the early stage of the
pandemic, is more effective in quickly curbing growth factors, and bringing the cases to a natural plateau earlier in the life
cycle of Covid-19 transmissibility (Aziz et al., 2020; Ganasegeran et al., 2020; Tang, 2020). At the same time, there have been
multiple adaptation of health care systems to the current pandemic, which require time to implement and roll out, and the
strict control measures implemented in Sabah, and adoption of low-risk quarantine centers, has allowed significant slack to
be cut on tertiary hospitals so that they can rightfully focus on unwell Covid-19 patients. The model also demonstrates that if
MCOs are relaxed overly prematurely, what happens is that reproductive numbers and growth factors can climb prematurely
(Ferguson et al., 2020; Gupta et al., 2021; Leung & Wu, 2020).
5. Conclusion
In conclusion, it is critical that we continue using GLM to provide governments and policymakers with accurate and
helpful forecasts on magnitude of epidemic and peak time. This can assist in making long-term strategic decisions regarding
procurement of Personal Protective Equipment, reagents for Covid-19 testing, and relevant medical equipment in the near
and medium future, and also help governments and health ministry's plan for opening of more lower-risk facilities and
decanting of non-ill patients from district hospitals where indicated in order to accommodate projected surges in admissions.
Declaration of competing interest
The authors declare that they have no known competing financial interests or personal relationships that could have
appeared to influence the work reported in this paper.
906N.T.P. Pang, A. Kamu, M.A. Mohd Kassim et al. Infectious Disease Modelling 6 (2021) 898e908
References
Ahmadi, M., Sharifi, A., & Khalili, S. (2020). Presentation of a developed sub-epidemic model for estimation of the COVID-19 pandemic and assessment of
travel-related risks in Iran. Environmental science and pollution research. https://doi.org/10.1007/s11356-020-11644-9
Alharbi, Y., Alqahtani, A., Albalawi, O., & Bakouri, M. (2020). Epidemiological modeling of COVID-19 in Saudi Arabia: Spread projection, awareness, and impact of
treatment. Switzerland: Applied Sciences. https://doi.org/10.3390/app10175895
Ali, I. (2020). COVID-19: Are we ready for the second wave?. Disaster medicine and public health preparedness. https://doi.org/10.1017/dmp.2020.149
Amoo, E. O., Adekeye, O., Olawole-Isaac, A., Fasina, F., Adekola, P. O., Samuel, G. W., Akanbi, M. A., Oladosun, M., & Azuh, D. E. (2020). Nigeria and Italy
divergences in coronavirus experience: Impact of population density. Science World Journal. https://doi.org/10.1155/2020/8923036
Anand, R. (2020). Malaysia struggles to slow Covid-19 infections, with lockdowns proposed in targeted areas. The straits times. https://www.straitstimes.
com/asia/se-asia/malaysia-struggles-to-slow-covid-19-infections-with-lockdowns-proposed-in-targeted.
Aviv-sharon, E., & Aharoni, A. (2020). Generalized logistic growth modeling of the COVID-19 pandemic in Asia. Infectious Disease Modelling, 5, 502e509.
https://doi.org/10.1016/j.idm.2020.07.003
Azil, F. (2020). CMCO throughout Sabah following spike in COVID-19 cases. Astro awani. https://www.astroawani.com/berita-malaysia/cmco-throughout-
sabah-following-spike-in-covid19-cases-263213.
Aziz, N. A., Othman, J., Lugova, H., & Suleiman, A. (2020). Malaysia's approach in handling COVID-19 onslaught: Report on the Movement Control Order
(MCO) and targeted screening to reduce community infection rate and impact on public health and economy. Journal of infection and public health.
https://doi.org/10.1016/j.jiph.2020.08.007
Babbitt, D., Garland, P., & Johnson, O. (2020). Lived population density and the spread of COVID-19.
Bhadra, A., Mukherjee, A., & Sarkar, K. (2020). Impact of population density on Covid-19 infected and mortality rate in India. Modeling earth systems and
environment. https://doi.org/10.1007/s40808-020-00984-7
Bonneche re, B., Sankoh, O., Samadoulougou, S., Cyr Yombi, J., & Kirakoya-Samadoulougou, F. (2021). Surveillance of COVID-19 in Cameroon: Implications for
policymakers and the healthcare system. Journal of Public Health in Africa. https://doi.org/10.4081/jphia.2021.1415
Bontempi, E. (2020). The europe second wave of COVID-19 infection and the Italy “strange” situation. Environmental Research. https://doi.org/10.1016/j.envres.
2020.110476
Catal pez, D., Cardona, P. J., & Prats, C. (2020). Empiric model for short-time prediction of COVID-19 spreading. https://
a, M., Alonso, S., Alvarez-Lacalle, E., Lo
doi.org/10.1101/2020.05.13.20101329.
Chiam, A. (2021). ‘No exceptions’, stresses Uggah on mandatory 14-day quarantine at hotels, designated centres for anyone entering Sarawak. The Borneo Post.
https://www.theborneopost.com/2021/01/11/no-exceptions-stresses-uggah-on-mandatory-14-day-quarantine-at-hotels-designated-centres-for-
anyone-entering-sarawak/.
Coibion, O., Gorodnichenko, Y., & Weber, M. (2020). The cost of the COVID-19 crisis: Macroeconomic expectations, and consumer spending. National Bureau of
Economic Research.
Ferguson, N., Laydon, D., Nedjati-Gilani, G., Imai, N., Ainslie, K., Baguelin, M., Bhatia, S., Boonyasiri, A., Cucunub a, Z., Cuomo-Dannenburg, G., & Dighe, A.
(2020). Report 9 - impact of non-pharmaceutical interventions (NPIs) to reduce COVID-19 mortality and healthcare demand. Faculty of Medicine | Imperial
College London. Imperial College COVID Response Team.
Ganasegeran, K., Hock Ch’ng, A. S., & Looi, I. (2020). Covid-19 in Malaysia: Crucial measures in critical times. Journal of Global Health. https://doi.org/10.7189/
jogh.10.020333
Geraldine, A. (2020). Get tested for covid-19 before travelling to Sabah. New straits TImes. https://www.nst.com.my/news/nation/2020/06/597531/get-tested-
covid-19-travelling-sabah.
Glennon, E. E., Jephcott, F. L., Restif, O., & Wood, J. L. N. (2019). Estimating undetected ebola spillovers. PLoS neglected tropical diseases. https://doi.org/10.
1371/journal.pntd.0007428
Gupta, M., Mohanta, S. S., Rao, A., Parameswaran, G. G., Agarwal, M., Arora, M., Mazumder, A., Lohiya, A., Behera, P., Bansal, A., Kumar, R., Meena, V. P.,
Tiwari, P., Mohan, A., & Bhatnagar, S. (2021). Transmission dynamics of the COVID-19 epidemic in India and modeling optimal lockdown exit strategies.
International Journal of Infectious Diseases. https://doi.org/10.1016/j.ijid.2020.11.206
Harvey, A., & Kattuman, P. (2021). Time series models based on growth curves with applications to forecasting coronavirus. Harvard data science review.
https://hdsr.mitpress.mit.edu/pub/ozgjx0yn/release/2.
Hirose, H. (2007). The mixed trunsored model with applications to SARS. Mathematics and computers in simulation. https://doi.org/10.1016/j.matcom.2006.
06.031
Holmdahl, I., & Buckee, C. (2020). Wrong but useful d what covid-19 epidemiologic models can and cannot tell us. New England Journal of Medicine. https://
doi.org/10.1056/nejmp2016822
Jain, M., Bhati, P. K., Kataria, P., & Kumar, R. (2020). Modelling logistic growth model for COVID-19 pandemic in India. Proceedings of the fifth international
Conference on Communication and electronics systems (ICCES 2020). IEEE Conference Record No, 48766, 784e789.
Kadi, N., & Khelfaoui, M. (2020). Population density, a factor in the spread of COVID-19 in Algeria: Statistic study. Bulletin of the National Research Centre.
https://doi.org/10.1186/s42269-020-00393-x
Kassim, M. A. M., Pang, N. T. P., Mohamed, N. H., Kamu, A., Ho, C. M., Ayu, F., Rahim, S. S. S. A., Omar, A., & Jeffree, M. S. (2021). Relationship between fear of
COVID-19, psychopathology and sociodemographic variables in Malaysian population. International journal of mental health and addiction. https://doi.
org/10.1007/s11469-020-00444-4
Kumar, A., & Nayar, K. R. (2020). COVID 19 and its mental health consequences. Journal of mental health. https://doi.org/10.1080/09638237.2020.1757052
Lau, H., Khosrawipour, V., Kocbach, P., Mikolajczyk, A., Schubert, J., Bania, J., & Khosrawipour, T. (2020). The positive impact of lockdown in Wuhan on
containing the COVID-19 outbreak in China. Journal of Travel Medicine. https://doi.org/10.1093/jtm/taaa037
Leung, K., & Wu, J. T. (2020). The gradual release exit strategy after lockdown against COVID-19. The lancet regional health - western pacific. https://doi.org/10.
1016/j.lanwpc.2020.100008
Liew, C. T. (2021). January 26). How political mismanagement has fuelled Malaysia's coronavirus surge. In south China morning post. https://www.scmp.com/
week-asia/opinion/article/3119197/how-political-mismanagement-has-fuelled-malaysias-coronavirus.
Lim, I. (2020). Latest CMCO dine-in rules: Maximum of four people per table in selangor, KL, Putrajaya; takeaway and delivery only for Sabah. Malay mail. https://
www.malaymail.com/news/malaysia/2020/11/02/latest-cmco-dine-in-rules-maximum-of-four-person-per-table-in-selangor-kl-p/1918416.
Ling, S. (2020). Dcm: M’sians travelling to Sarawak must undergo covid-19 test from June 9. The star. https://www.thestar.com.my/news/nation/2020/06/03/
dcm-m039sians-travelling-to-sarawak-must-undergo-covid-19-test-from-june-9.
Looi, M. K. (2020). Covid-19: Is a second wave hitting Europe?. The BMJ. https://doi.org/10.1136/bmj.m4113
Martelloni, G., & Martelloni, G. (2020). Analysis of the evolution of the Sars-Cov-2 in Italy, the role of the asymptomatics and the success of Logistic model. Chaos,
Solitons and Fractals. https://doi.org/10.1016/j.chaos.2020.110150
Middleton, J., Lopes, H., Michelson, K., & Reid, J. (2020). Planning for a second wave pandemic of COVID-19 and planning for winter: A statement from the
association of schools of public health in the European region. International journal of public health. https://doi.org/10.1007/s00038-020-01455-7
Ministry of Health Malaysia. (2021). Current COVID-19 pandemic situation in Malaysia. http://covid-19.moh.gov.my/.
Mohd Kassim, M. A., Ayu, F., Kamu, A., Pang, N. T. P., Ho, C. M., Algristian, H., Sahri, M., Hambali, N. L., & Omar, A. (2020). Indonesian version of the fear of
COVID-19 scale: Validity and reliability. Borneo Epidemiology Journal, 1(2), 124e135. https://jurcon.ums.edu.my/ojums/index.php/bej/article/view/2755/
1805.
Mohd Kassim, M. A., Pang, N., & James, S. (2020). COVID-19 pandemic - a review and assessing higher education institution undergraduate student's mental
health. Borneo Epidemiology Journal, 1(2), 96e103. https://jurcon.ums.edu.my/ojums/index.php/bej/article/view/2746.
907N.T.P. Pang, A. Kamu, M.A. Mohd Kassim et al. Infectious Disease Modelling 6 (2021) 898e908
Mukhsam, M. H., Jeffree, M. S., Tze Ping Pang, N., Syed Abdul Rahim, S. S., Omar, A., Abdullah, M. S., Lukman, K. A., Giloi, N., Salvaraji, L., Abd Karim, M. R.,
Saupin, S., Tat, Y. B., Mohd Hayati, M. F., Ibrahim, M. Y., Muhamad, A., & Zainudin, S. P. (2020). A university-wide preparedness effort in the alert phase of
COVID-19 incorporating community mental health and task-shifting strategies: Experience from a bornean institute of higher learning. The American
Journal of Tropical Medicine and Hygiene. https://doi.org/10.4269/ajtmh.20-0458
Nik Anis, M. (2020). Ismail sabri: Inter-district travel not allowed in Sabah from oct 3. The star. https://www.thestar.com.my/news/nation/2020/10/01/ismail-
sabri-inter-district-travel-not-allowed-in-sabah-from-oct-3.
Pang, N., Kamu, A., Hambali, N. L., Ho, C. M., Mohd Kassim, M. A., Mohamad, N. H., Ayu, F., Syed Abdul Rahim, S. S., Omar, A., & Jeffree, M. S. (2020). Malay
version of the fear of COVID-19 Scale : Validity and reliability. International journal of mental health and addiction, Forthcomin.
Pedersen, C., Latif, Z. A., & Lai, C. (2011). Tsunami modelling and risk mapping for east coast OF sabah, Malaysia. Coastal Engineering Proceedings. https://doi.
org/10.9753/icce.v32.currents.55
Pelinovsky, E., Kurkin, A., Kurkina, O., Kokoulina, M., & Epifanova, A. (2020). Logistic equation and COVID-19. Chaos, Solitons and fractals. https://doi.org/10.
1016/j.chaos.2020.110241
Rahman, S. (2021). Malaysia's third covid-19 wave. https://www.iseas.edu.sg/media/commentaries/malaysias-third-covid-19-wave/.
Richards, F. J. (1959). A flexible growth function for empirical use. Journal of Experimental Botany, 10(29), 290e300.
Rocklo€ v, J., & Sjo
€ din, H. (2020). High population densities catalyse the spread of COVID-19. Journal of travel medicine. https://doi.org/10.1093/jtm/taaa038
Sabah State Government. (2021). COVID-19 in Sabah. https://covid19.sabah.digital/covid19/.
Sahu, P. (2020). Closure of universities due to coronavirus disease 2019 (COVID-19): Impact on education and mental health of students and academic staff.
In Cureus. https://doi.org/10.7759/cureus.7541
Sukumaran, T. (2020). Coronavirus Malaysia: PM blames Sabah election as among causes of huge infection surge. South China Morning Post. https://www.
scmp.com/week-asia/health-environment/article/3104421/coronavirus-malaysia-pm-blames-sabah-election-among.
Sy, K. T. L., White, L. F., & Nichols, B. (2020). Population density and basic reproductive number of COVID-19 across United States counties. https://doi.org/10.
1101/2020.06.12.20130021.
Tang, K. H. D. (2020). Movement control as an effective measure against covid-19 spread in Malaysia: An overview. Journal of Public Health. https://doi.org/
10.1007/s10389-020-01316-w
Verhulst, P. F. (1838). Notice sur la loi que la population suit dans son accroissement. Correspondance Math ematique et Physique.
Wang, X. S., Wu, J., & Yang, Y. (2012). Richards model revisited: Validation by and application to infection dynamics. Journal of Theoretical Biology. https://doi.
org/10.1016/j.jtbi.2012.07.024
Wang, P., Zheng, X., Li, J., & Zhu, B. (2020). Prediction of epidemic trends in COVID-19 with logistic model and machine learning technics. Chaos, Solitons and
Fractals. https://doi.org/10.1016/j.chaos.2020.110058
Wu, K., Darcet, D., Wang, Q., & Sornette, D. (2020a). Generalized logistic growth modeling of the COVID-19 outbreak: Comparing the dynamics in the 29
provinces in China and in the rest of the world. Nonlinear Dynamics. https://doi.org/10.1007/s11071-020-05862-6
Wu, K., Darcet, D., Wang, Q., & Sornette, D. (2020b). Generalized logistic growth modeling of the COVID-19 outbreak: Comparing the dynamics in the 29
provinces in China and in the rest of the world. Nonlinear Dynamics, 101(3), 1561e1581. https://doi.org/10.1007/s11071-020-05862-6
Yaakub, N. F., Epa, A. E., Chabo, D., & Masron, T. (2020). Coronavirus (COVID-19): Density risk mapping using population and housing census of Malaysia
2010. Geografia, 8(2), 21e47. https://doi.org/10.37134/geografi.vol8.2.2.2020
Zainudin, S. P., Mohd Kassim, M. A., & Mohamad Ridza, N. N. (2020). Mitigation measures during elections and it's impacts on COVID-19 pandemic: Sabah
state (Malaysia), New Zealand and the United States. Borneo Epidemiology Journal, 1(2), 145e156. https://jurcon.ums.edu.my/ojums/index.php/bej/
article/view/2748/1800.
908You can also read