The ANTI-Vea task: analyzing the executive and arousal vigilance decrements while measuring the three attentional networks - Sciendo
←
→
Page content transcription
If your browser does not render page correctly, please read the page content below
Psicológica (2021), XX, XXX-
doi: 10.2478/psicolj-2021-0001

 The ANTI-Vea task: analyzing the executive and arousal
 vigilance decrements while measuring the three
 attentional networks

 Fernando G. Luna*1,2, Pablo Barttfeld1, Elisa Martín-Arévalo2 & Juan
 Lupiáñez*2
 1
 Instituto de Investigaciones Psicológicas (IIPsi, CONICET-UNC),
 Facultad de Psicología, Universidad Nacional de Córdoba, Córdoba,
 Argentina
 2
 Department of Experimental Psychology, and Mind, Brain and Behavior
 Research Center (CIMCYC), University of Granada, Granada, Spain

 The vigilance decrement phenomenon has been traditionally studied by
 simple and monotonous behavioral tasks. Nowadays, however, there is
 considerable interest in measuring vigilance with more complex tasks,
 including independent measures of other attentional functions. In the present
 study, we provide evidence supporting the suitability of the Attentional
 Networks Test for Interactions and Vigilance – executive and arousal
 components (ANTI-Vea) as an appropriate method to simultaneously assess
 multiple attentional and vigilance components. Vigilance was examined as
 two dissociated components: executive vigilance –as the detection of
 infrequent signals– and arousal vigilance –as the sustenance of a fast
 reaction to stimuli without response selection–. Importantly, the executive
 vigilance decrement was analyzed with a novel methodological approach to
 particularly determine whether the sensitivity loss effect is influenced by a
 floor level on the false alarms. As expected, the ANTI-Vea proved to be a
 task suitable to assess: (a) the main effects and interactions of phasic
 alertness, orienting, and executive control; (b) the executive vigilance

*
 Corresponding author: Correspondence concerning this article should be addressed
either to Fernando G. Luna, Instituto de Investigaciones Psicológicas (IIPsi, CONICET-
UNC), Facultad de Psicología, Universidad Nacional de Córdoba, Boulevard de la Reforma
esquina Enfermera Gordillo, CP 5000, Córdoba, Argentina, e-mail: fluna@unc.edu.ar,
telephone: (54) (0351) 5353890 internal: 60201; or Juan Lupiáñez, Department of
Experimental Psychology, and Mind, Brain, and Behavior Research Center (CIMCYC),
University of Granada, Campus de Cartuja S/N, CP 18011, Granada, Spain, e-mail:
jlupiane@ugr.es, telephone: (34) (958) 243763.

 © 2021 (Luna, Barttfeld, Martín-Arévalo & Lupiáñez) This is an open access article licensed under
 the Creative Commons Attribution-NonCommercial-NoDerivs License
 (http://creativecommons.org/licenses/by-nc-nd/4.0/)
XXX F.G. Luna, P. Barttfeld, E. Martín-Arévalo, J. Lupiáñez

 decrement as a progressive change in the response bias; and (c) the arousal
 vigilance decrement as a progressive slowness and variability in reaction
 time. We discuss some critical theoretical and empirical implications of
 measuring vigilance components with the ANTI-Vea task. We expect the
 present study to provide a suitable method to analyze the vigilance
 decrement phenomenon when measuring multiple attentional and vigilance
 functions.

 One of the central mechanisms supported by the attentional networks
system –i.e., alerting, orienting, and executive control (Petersen & Posner,
2012; Posner & Petersen, 1990)– is the challenging ability to sustain
attention over extended periods; a mechanism scientifically known as
‘vigilance’ (Adams, 1987; Hancock, 2017; Scerbo, 1998; Warm,
Parasuraman, & Matthews, 2008). Traditionally, vigilance has been studied
by simple and monotonous behavioral tasks such as the Mackworth Clock
Test (MCT; Mackworth, 1948) or the Psychomotor Vigilance Test (PVT;
Lim & Dinges, 2008), in which a progressive decrement on performance is
commonly observed as a function of time on task (Langner & Eickhoff,
2013; Mackworth, 1948; Scerbo, 1998). Currently, nevertheless, there is
raising interest in assessing vigilance with more complex tasks, including
measures from other attentional components in contrast with the classic
approach of measuring vigilance with such simple and monotonous
behavioral tasks (Roca, García-Fernández, Castro, & Lupiáñez, 2018;
Tkachenko & Dinges, 2018; Wickens, Hutchins, Laux, & Sebok, 2015).
 Furthermore, it is important to note that behavioral tasks such as the
MCT and the PVT indeed seem to assess two dissociated components of
vigilance (Luna, Marino, Roca, & Lupiáñez, 2018). On the one hand, in the
PVT (Lim & Dinges, 2008) vigilance is exclusively measured as the
capacity to sustain a fast reaction to any stimuli from the environment,
without implementing any control on the selection of the executed response.
In particular, participants must stay alert over 10 minutes to stop, as fast as
possible, and by pressing any available key, a millisecond counter that
appears at random intervals from 2 to 10 seconds (Basner & Dinges, 2011).
Importantly, participants do not have to be continuously selecting among
different response’s options and stimuli, as the same simple response is to
be given to the only possible stimulus. Thus, the PVT seems to assess an
arousal component of vigilance, a mechanism that could be more related to
the physiological shifts in the excitability levels that oscillates during the
sleep-wake cycle (Drummond et al., 2005; Lim & Dinges, 2008; Tkachenko
& Dinges, 2018). Indeed, note that the PVT is very sensitive to the effects
of total or partial sleep deprivation (Basner & Dinges, 2011; Drummond et
The ANTI-Vea task XXX

al., 2005). In the PVT, the arousal vigilance (AV) decrement is observed as
a progressive increment across time on task in reaction time (RT) scores, as
mean, variability, and lapses (i.e., excessively slow RT; Lamond et al.,
2008; Lamond, Dawson, & Roach, 2005; Loh, Lamond, Dorrian, Roach, &
Dawson, 2004).
 On the other hand, in signal detection tasks such as the MCT
(Mackworth, 1948) or the Sustained Attention to Response Task
(Robertson, Manly, Andrade, Baddeley, & Yiend, 1997), vigilance is
examined as the ability to monitor and detect critical signals that occur quite
rarely over an extended period. For instance, in the MCT, participants must
remain alert to detect the occurrence of an unusual double jump of the clock
hand (Mackworth, 1948). This type of task seems to assess an executive
component of vigilance, which implements controlled mechanisms of
sustained attention to categorize stimuli from the environment and
selectively detect the appearance of critical signals, while avoiding
responding to the remaining noise stimuli. Importantly, at difference with
the PVT, in signal detection tasks the executive vigilance (EV) decrement is
observed as a progressive loss on hits to correctly detect the infrequent
signals (See, Howe, Warm, & Dember, 1995; Thomson, Besner, & Smilek,
2016).
 Note that, traditionally, by using Signal Detection Theory (SDT)
metrics it has been assumed that the decrement on hits corresponds to a
progressive loss in the sensitivity to discriminate the occurrence of critical
signals from the remaining noise events, e.g., the regular jump of the clock
hand on the MCT (See et al., 1995). However, a recent review and
empirical demonstration by Thomson et al. (2016) has pointed out several
flaws in simple signal detection tasks to properly determine the potential
shifts of SDT metrics across time on task. To start with, simple and
monotonous tasks are generally very easy to perform. Consequently, in the
first period of the task, a ceiling effect on the hits rate is commonly
observed along with a floor effect on the false alarms (FA) rate. This is a
critical issue because if FA are at floor levels at the beginning of the task,
there is no possibility for the decrement on hits to be accompanied by a
similar decrement on FA, which would mask the likely shift in the response
bias across time on task.
 To test this hypothesis, Thomson et al. (2016) developed a novel
vigilance paradigm in which the noise events included a low proportion of
lure trials. Critically, the lure trials should be specifically more difficult to
discriminate from the signal events than the remaining non-lure trials.
Participants had to perform a categorical decision task over serially
presented words, trying to respond only to those words representing four-
XXX F.G. Luna, P. Barttfeld, E. Martín-Arévalo, J. Lupiáñez

legged creatures (e.g., ‘squirrel’, 10 per block). In the remaining noise
events, most of them represented inanimate objects (e.g., ‘phone’, 80 per
block as non-lure trials). Furthermore, and importantly, a low proportion of
lure trials were words representing non four-legged creatures (e.g., ‘canary’,
10 per block). As predicted by Thomson et al., in the first period of the task
the FA rate increased importantly (i.e., ~33%) when it was computed
considering only the lure trials, in contrast to the FA rate when considering
all trials (i.e., ~5%). Importantly, FA computed from the lure trials showed
a prominent decrement across time on task, and consequently, the vigilance
decrement was observed as an increment in the response bias and not as a
loss in sensitivity (Thomson et al., 2016). Note that the results observed by
Thomson et al. were later replicated using the same vigilance task in a
recent study conducted by Claypoole, Neigel, Fraulini, Hancock, & Szalma
(2018).
 To obtain a direct measure of both vigilance components along with
an independent measure of other functions of the attentional networks
system, we have recently developed the Attentional Networks Test for
Interactions and Vigilance – executive and arousal components (ANTI-Vea;
Luna et al., 2018). In short, the task combines three different attentional and
vigilance tasks randomly embedded within a single session. In the largest
proportion of trials (i.e., 60%), participants have to complete the Attentional
Networks Test for Interactions (ANTI) developed by Callejas, Lupiáñez,
and Tudela (2004); a flanker paradigm with visual cues and warning signals
that is useful to assess the classic attentional networks functions, i.e., phasic
alertness, orienting, and executive control (Petersen & Posner, 2012; Posner
& Petersen, 1990). The EV task consists in detecting an infrequent vertical
displacement of the target (i.e., the central arrow of a five-arrow string is
vertically displaced in 20% of the trials). In the remaining 20% of trials,
participants perform an AV task, in which a millisecond counter has to be
stopped as fast as possible by pressing any key from the keyboard.
 Importantly, the ANTI-Vea has proven to be a task suitable to assess
multiple attentional and vigilance components at the same time (Luna et al.,
2018). In particular, the usual main effects and interactions of the classic
attentional functions were observed as with the ANTI task (Callejas,
Lupiáñez, Funes, & Tudela, 2005; Callejas et al., 2004). Furthermore, and
importantly, clear decrements were observed for both EV and AV. In
particular, the EV decrement was found as a progressive increment in the
response bias, rather than as a loss in sensitivity, in the same vein that the
empirical demonstration by Thomson et al. (2016). Moreover, the AV
decrement was observed as a linear increment in the mean and variability of
RT, as usually observed with the PVT (Basner & Dinges, 2011). It is
The ANTI-Vea task XXX

important to highlight that the ANTI-Vea has shown to be useful to
dissociate the two components of vigilance, as they seem to be differently
modulated by caffeine intake and exercise intensity (Sanchis, Blasco, Luna,
& Lupiáñez, 2020) and by transcranial direct current stimulation (Luna,
Román-Caballero, Barttfeld, Lupiáñez, & Martín-Arévalo, 2020).

 THE PRESENT STUDY
 The main goal of the present study was to investigate the appropriate
parameters of the ANTI-Vea for it to be a suitable task to assess both the
EV and AV decrement along with the independence and interactions of the
classic attentional networks functions, while avoiding a floor effect on FA
so that the EV decrement can be appropriately interpreted. To achieve this
goal, we applied the methodological approach developed by Thomson et al.
(2016) to two different versions of the ANTI-Vea: the ‘standard’ and the
‘lure’ version of the ANTI-Vea. Based on the standard version of the ANTI-
Vea, we designed a lure version, which included a low proportion of trials
wherein we expected to importantly increase the FA rate. Then, we adapted
the analytical method of Thomson et al. to compute a corrected FA rate in
both the standard and the lure ANTI-Vea, considering only those trials
wherein it was more likely to commit a FA. Therefore, once avoided a
possible floor level on the FA rate, we examined whether FA either increase
or decrease across time on task to critically test whether the EV decrement
is actually due to a decrease in sensitivity or to an increase in the response
criterion (or perhaps due to changes in both sensitivity and response
criterion). Following Thomson et al., we hypothesized that if FA decrease
across time on task –or at least do not increase–, the EV decrement will be
more likely observed as a change in the response bias rather than as a loss in
sensitivity.
 Importantly, note that we expected to observe independent behavioral
patterns for the vigilance and attentional functions measured with the
ANTI-Vea task (Luna et al., 2018). Therefore, while the EV decrement was
anticipated as a drop in the correct detection of critical signals, we
anticipated the AV decrement as a progressive slowness and variability in
RT, in the same vein as usually reported with the PVT (Basner & Dinges,
2011; Lim & Dinges, 2008). Regarding the classic attentional networks
functions, we expected to observe the typical effects reported with the
ANTI (Callejas et al., 2004). In particular, for the phasic alertness
functioning, we expected faster responses when the stimuli are anticipated
by a warning signal than when they are not anticipated. Regarding
attentional orienting, we expected valid visual cues to speed up target
XXX F.G. Luna, P. Barttfeld, E. Martín-Arévalo, J. Lupiáñez

selection, and invalid cued to slow it down, compared to when no visual
orienting cue is presented. Lastly, for the executive control network, we
anticipated that the presence of incongruent distractors would impair target
selection as compared to congruent distractors. The materials and data set of
this study are publicly available in the Open Science Framework, at
https://osf.io/awz3g/.

 METHOD
 Participants. In a recent study conducted with the ANTI-Vea task
(Luna et al., 2018), we observed that a sample size of 80 participants (n =
40 per group) was appropriate to observe a reliable main effect of the
change in the response bias (the smallest vigilance decrement of interest)
across the six experimental blocks ( 2 = .04, for which a minimum of 35
participants per group would be necessary, with an α = .05 and a power of 1
– β = .90). Therefore, we decided to gather data from a similar sample size
in the present experiment. A total of 86 healthy volunteers (61 women; age
M = 22.70, SD = 5.54; education years: M = 13.95; SD = 1.30), all of them
with normal or corrected to normal vision, participated in this study. All
participants were undergraduate students from the Universidad Nacional de
Córdoba, Argentina. They signed a written informed consent and completed
the session individually. The study was conducted according to the ethical
standards of the 1964 Declaration of Helsinki (last update Seoul, 2008) and
was part of a larger research project approved by the Universidad de
Granada Ethical Committee (175/CEIH/2017). Participants were randomly
assigned to one of two groups, depending on the task version performed.
Groups did not differ in age [t (84) = -0.32, p = .75] or education years [t
(84) = 1.16, p = .25].
 Stimuli and design. The experimental tasks were designed and run in
E-Prime v2.0 Professional (Psychology Software Tools, Pittsburgh, PA).
All stimuli and instructions were drawn in black against a grey background.
Responses were registered by pressing one key on a standard QWERTY
keyboard.
 Participants sat at ~50 cm from the screen, which had a resolution in
pixels (px) of 1024 wide and 768 height. Stimuli and timing were the same
as in the original ANTI-Vea (Luna et al., 2018): a black fixation cross (~7
px), a black asterisk (~13 px), a warning tone (2000 Hz, presented through
headphones), a red millisecond down counter (~110 px height each
number), and a row of five black arrows (50 px wide x 23 px high each
arrow) pointing either leftward or rightward. The horizontal distance
between adjacent arrows was set at ~63 px.
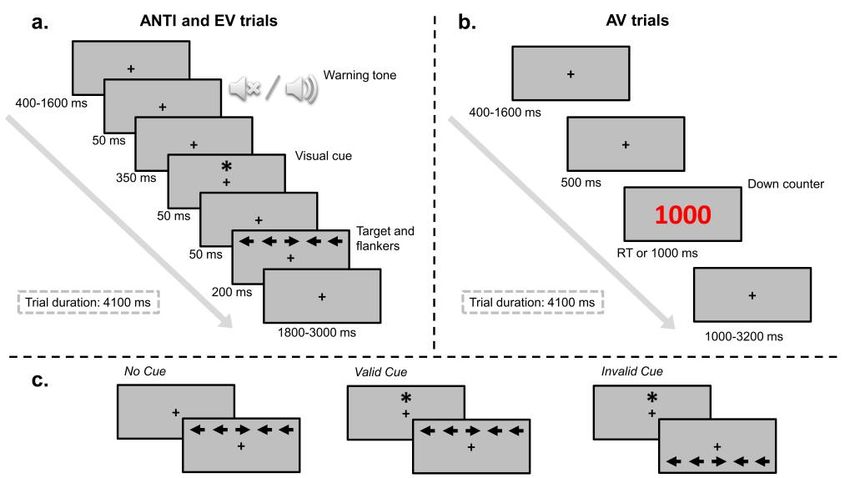
The ANTI-Vea task XXX

 Procedure and design. Self-report questionnaires and assessment of
fatigue. Before the experimental task, participants completed the following
questionnaires: (a) Insomnia Severity Index (Bastien, Vallières, & Morin,
2001), (b) Cognitive Failures Questionnaire (Broadbent, Cooper,
FitzGerald, & Parkes, 1982), (c) Attentional Control Scale (Derryberry &
Reed, 2002), and (d) Barratt Impulsiveness Scale-11 (Patton, Stanford, &
Barratt, 1995). In addition, participants self-reported their level of mental
and physical fatigue at three different times across the session: before
instructions and practice blocks, before starting the experimental task, and
at the end of the experimental blocks. The goal of collecting these data is to
assess the relationship between several self-reported abilities, habits, and
sensations, with the performance’ scores of the attentional and vigilance
components measured with the ANTI-Vea task. Note, however, that this
goal is part of a larger project, so that data of the present study will be
reported elsewhere when data from a much larger N is accumulated.
 Attentional Networks Test for Interactions and Vigilance – executive
and arousal components (ANTI-Vea). The ANTI-Vea task comprises three
different types of trials: ANTI (60%, to assess the classic attentional
networks functions and their interactions), EV (20%, a signal detection task
similar to the MCT), and AV (20%, a vigilance task similar to the PVT).
The stimuli sequence and procedure for all trials can be observed in Fig. 1.

Figure 1. ANTI-Vea design. Experimental procedure and stimuli sequence of (a) both
ANTI and Executive Vigilance (EV) trials and (b) Arousal Vigilance (AV) trials.
Responses were allowed until 2000 ms since the target or the down counter presentation.
(c) Examples of visual cue conditions.
XXX F.G. Luna, P. Barttfeld, E. Martín-Arévalo, J. Lupiáñez

 In the ANTI trials, a row of five arrows was presented either above
or below the fixation point. Participants had to respond to the direction of
the target (i.e., the central arrow) while ignoring the direction pointed by the
flanking arrows. To measure executive control, half of the times the target
direction was congruent with the flankers’ direction, whereas in the other
half it was incongruent (see examples of congruency conditions in Fig. 2).
Previously, to assess phasic alertness functioning, in 50% of these trials a
warning signal was presented 500 ms before the appearance of the arrows
(tone condition), whereas no warning signal was presented in the remaining
50% of the trials (no tone condition). Finally, for measuring the orienting
functioning, a spatially non-predictive visual cue was presented 100 ms
before the arrows in 2/3 of the trials, whereas no visual cue was presented in
the remaining 1/3 of the trials. When presented, the cue could be at the
same location as the target (valid location condition), or at the opposite
condition (invalid location condition). Examples of warning signal and
visual cue conditions can be observed in Fig. 1.
 EV trials had the same procedure as ANTI trials (see Fig.1), except
that the target was displaced from the central position (see Fig. 2). In the
EV trials, participants were encouraged to remain vigilant to detect as the
critical signal a large vertical displacement (i.e., 8 px) of the target from its
central position by pressing the space bar, ignoring in these cases the
direction pointed by the target. Lastly, in the AV trials (see Fig. 1), a down
counter was presented instead, and participants were instructed to stop it as
fast as possible by pressing any key from the keyboard.
 Note that the EV task of the ANTI-Vea presents a 2-alternative-
forced-choice task, in which participants have to discriminate the critical
signal (i.e., the 8 px vertical displacement of the target from its central
position in the EV trials) from the remaining noise events (i.e., all the ANTI
trials, wherein the target is not displaced 8 px from its central position; see
Fig. 2). Thus, following the two possible responses admitted in a 2-
alternative-forced-choice task: (a) hits are the correct responses to the EV
trials (i.e., pressing the ‘space bar’ to the 8 px displacement of the target);
(b) misses (i.e., the complement of hits) are the incorrect responses to the
EV trials, i.e., not pressing the space bar to the 8 px displacement of the
target; (c) FA are the incorrect detections of the infrequent signal in the
noise events (i.e., the ‘space bar’ responses in any of the ANTI trials); and
(d) correct rejections (i.e., the complement of FA) are not responding with
the space bar to the trials with a displacement smaller than 8 px, in other
words, responding instead with the responses expected to the noise events
(i.e., either the ‘c’ or ‘m’ responses in any ANTI trials).
The ANTI-Vea task XXX

 Each group of participants completed a different version of the
ANTI-Vea task: the standard –as in Luna et al. (2018)–, or the lure task
version. Importantly, the only difference between the standard and the lure
version was the possible positions for target and flankers stimuli on each
trial. In the standard task, a random variability of ±2 px was set for the
horizontal and vertical position of the arrows, both in the ANTI (for target
and flankers) and EV (only for flankers) trials. This variability on the
arrows’ position was introduced to make more difficult the detection of the
larger and fixed 8 px displacement of the target (either up or down) in the
EV trials (see examples in Fig. 2).
 On the other hand, in the lure version, the arrows’ position was set
differently (see Fig. 2) to design a vigilance task similar to the one proposed
by Thomson et al. (2016). The ±2 px noise was eliminated so that the
flanking arrows appeared in a fixed position, for both ANTI and EV trials.
However, in the ANTI trials of the lure version, there was 1/3 of trials
wherein the target had a fixed displacement (4 px, either up or down)
smaller nevertheless than the one of the EV trials (i.e., 8 px), while in the
remaining 2/3 of ANTI trials the target appeared fixed in the center of the
row of arrows without any displacement. Importantly, with these
manipulations over the position of the stimuli, we expected that participants
would commit more FA (i.e., to erroneous press the space bar) in those
ANTI trials wherein the target was displaced 4 px from its central position,
as the 4 px displacement could be incorrectly confused with the 8 px
displacement of the target in the EV trials.
 Given the possible positions of the target and the flankers in the
standard and the lure versions, in both task versions, there were some ANTI
trials (i.e., the non-signal or noise events of the signal detection task) in
which we expected to observe a higher FA rate, indicated in Fig. 2 as ANTI
trials with a high chance of FA. In the lure task version, these were ANTI
trials wherein the target was displaced 4 px from its central position, just
explained.
 In the standard version, however, those trials were not pre-specified.
Therefore, we categorized offline the ANTI trials as a function of the
maximum distance (in the vertical axis) between the target and the closest
adjacent flankers. This distance (see Fig. 2) could be in a range from 0 px
(e.g., the target and both adjacent flankers appeared in the same vertical
position) to 4 px (e.g., the target was 2 px displaced in one direction and
one of the closest adjacent flankers was displaced 2 px in the opposite
direction). Then, in those trials wherein this maximum distance was
between 0 and 2 px, we assumed that it was less likely that the target
displacement could be confused with the one of the EV trials (i.e., the 8 px
XXX F.G. Luna, P. Barttfeld, E. Martín-Arévalo, J. Lupiáñez

displacement) and therefore there was a small chance to commit FA (as the
non-displacement trials in the lure version). Instead, in those trials wherein
this distance was 3 or 4 px, it could be more probable to commit a FA, as in
the trials with the 4 px displacement of the lure task (see Fig. 2). This
categorization of the ANTI trials (i.e., the set of trials from which it was
computed the FA rate) was necessary for our goal of analyzing whether a
floor effect on the FA rate could be affecting the sensitivity and response
bias indices.

Figure 2. Target and distractors positions in the standard and lure ANTI-Vea versions, EV
trials, and for ANTI trials with a high and small chance of committing a FA. The dotted
gray line was not presented in the screen and it represents the central height for arrows in
the vertical axis for both above or below the fixation point. Subtractions on the right of
each example show the distance in pixels between the target (T) and the immediate left
(L1) or right (R1) distractor. The correct answer for each example is shown below the
arrows.

 Before the experimental task, participants received specific
instructions for each type of trial and performed several practice blocks with
visual feedback. Further details on the sequence of instructions and practice
are described in Luna et al. (2018). The experimental section of the task
included six blocks of 80 randomly presented trials (48 ANTI, 16 EV, and
16 AV) without any pause or feedback. Given that each trial had a total time
duration of 4100 ms (see Fig. 1), the average time for each experimental
block was 5:28 min and for the whole task (i.e., the total vigilance period)
of ~33 min.
 The 48 ANTI trials had the following factorial design: 2 (warning
signal: no tone/tone) × 3 (visual cue: invalid/no cue/valid) × 2 (congruency:
The ANTI-Vea task XXX

congruent/incongruent) × 2 (target direction: left/right) × 2 (arrows position
with respect to the fixation point: above/below). The two lasts factors were
introduced for stimuli presentation but not considered in posterior analyses.
In the lure version, the 16 ANTI trials wherein the target was displaced 4 px
from its central position were randomly selected per block. Lastly, in the
EV trials, one factor was added to the design: displacement direction
(up/down). The 16 EV trials per block were randomly selected from the 96
possible combinations.
 Data analyses. Analyses were performed in Statistica 8.0 (StatSoft
Inc.) and figures were made with Matplotlib 3.0.0 (Hunter, 2007). First,
following the criteria from Luna et al. (2018), seven participants were
excluded from further analyses either due to an extreme average RT in the
ANTI trials (2.5 SD above the group average) or to a performance unusually
low in the ANTI task (i.e., equal or higher than 25% of errors). Thus, in the
following analyses, 40 participants were included in the standard version
group and 39 in the lure one. Data analyses were conducted separately for
the ANTI, EV, and AV tasks. The significance level was established at .05.
In addition, statistics are reported with partial eta squared (η2p ) as a measure
of the effect size and 95% confidence intervals around them (Cumming,
2014; Kelley & Preacher, 2012).
 In the ANTI trials, RT analyses excluded trials with incorrect
responses (7.79%) and those with RT below 200 or above 1500 ms (0.61%).
Then, two mixed analysis of variance (ANOVA) were conducted, one for
RT and another for the percentage of errors as dependent variables, and
including warning signal (no tone/tone), visual cue (invalid/no cue/valid),
and congruency (congruent/incongruent) as within-participants factors, and
task version (standard/lure) as a between-participants factor.
To analyze the vigilance decrement across time on task, EV and AV
measures were obtained per block of trials. For EV trials, warning tone,
visual cue, and congruency were not considered for analyses, with data
being collapsed across these variables. Hits were computed as the
proportion of infrequent signals (i.e., the 8 px displaced targets) correctly
detected. Then, following the methodological approach by Thomson et al.
(2016), FA (i.e., the ‘space bar’ responses in any of the ANTI trials) were
computed in two different ways. The ‘total’ computation of FA included all
the noise events (i.e., the whole set of ANTI trials). Instead, the ‘corrected’
computation of FA included only those trials wherein we assumed it was
more probable to commit a FA, i.e., the ANTI trials with a 3 to 4 px
displacement of the target in the standard task and the ANTI trials with a 4
px displacement in the lure task.
XXX F.G. Luna, P. Barttfeld, E. Martín-Arévalo, J. Lupiáñez

 Next, non-parametric indexes of sensitivity (Aʹ) and response bias
(Bʺ) were obtained (J. B. Grier, 1971). Both indices were computed
considering either the ‘total’ or the ‘corrected’ FA. The advantages of using
non-parametric over classic parametric indices (dʹ for sensitivity and β for
response bias) can be reviewed in multiple studies (e.g., Stanislaw &
Todorov, 1999; Thomson, Besner, & Smilek, 2016). In short, non-
parametric indices are distribution free and therefore, at difference with
parametric indices, they can be computed when hits and/or FA are equal to
100% or 0% –which are performances frequently observed when scores are
computed per experimental block–. Then, seven mixed ANOVAs were
conducted separately including task block (6 levels) as a within-participant
factor and task version (standard/lure) as a between-participants factor, one
for each dependent variable: hits and the ‘total’ and ‘corrected’ computation
of FA, Aʹ and Bʺ. Importantly, for researchers interested in analyses
conducted with parametric indices of sensitivity and response bias, please
see the Supplementary Material.
 The AV decrement was analyzed considering the mean and SD of RT,
and the percentage of lapses (i.e., late responses to the down counter) per
block. Following Luna et al. (2018), the threshold for lapses was set as
responses slower than 600 ms. Then, three mixed ANOVAs were conducted
separately, including task block (6 levels) as a within-participant factor and
task version (standard/lure) as a between-participants factor, one for each
dependent variable: mean RT, SD of RT, and percentage of lapses.
Importantly, for both the EV and AV components, post-hoc comparisons of
the linear component across blocks were performed to determine statistical
differences of the vigilance decrement between task versions.

 RESULTS
 Phasic Alertness, Orienting, and Executive Control. Significant
main effects were found for warning signal {RT: [F (1, 77) = 85.21, p <
.001, 2 = .53, 95% CIs (.37, .63)]; errors: [F (1, 77) = 6.68, p = .01, 2 =
.08, (.00, .21)]}, visual cue {RT: [F (2, 154) = 94.08, p < .001, 2 = .55,
(.44, .62)]; errors: [F (2, 154) = 6.79, p = .001, 2 = .08, (.01, .17)]}, and
congruency {only for RT: [F (1, 77) = 143.81, p < .001, 2 = .65, (.52,
.73)]; but not for errors: F < 1}. Thus, as depicted in Fig. 3, for the warning
signal effect responses were faster and more precise in the tone than in the
no tone condition. The visual cue effect was observed as usual (invalid > no
cue > valid) for the RT, while for errors this effect was marginally
modulated by the task version [F (2, 154) = 3.16, p = .05, 2 = .04, (.00,
The ANTI-Vea task XXX
.11)] (see Fig. 3). In particular, in the standard version the percentage of
errors was smaller in the no cue than in the invalid and valid conditions. In
the lure version, instead, the percentage of errors was smaller in the invalid
than in the no cue and valid conditions. Finally, the congruency effect –
which was observed only for RT– showed that responses were faster in the
congruent than in the incongruent condition (Fig. 3).
The main effect of task version was not significant for the RT (F <
1), with a similar overall RT for the standard (M = 671 ms, 95% CIs [640,
702]) and the lure version (M = 653 ms, [621, 684]). However, this effect
was significant for the analysis of errors [F (1, 77) = 4.93, p = .03, 2 = .06,
(.00, .18)]: in particular, responses were more precise in the standard (M =
6.60%, [5.07, 8.12]) than in the lure version (M = 9.02%, [7.47, 10.56]).
Figure 3. Mean correct RT (superior graphs) and percentage of errors (inferior graphs) for the
warning signal (left), visual cue (center), and congruency (right) conditions, as a function of the task
version (standard/lure). Error bars represents 95% confidence intervals of the mean and were
computed following the method developed by Cousineau (2005).
Regarding the modulations between the attentional networks
functions, only the interaction between warning signal and visual cue was
significant {only for RT: [F (2, 154) = 12.44, p < .001, 2 = .14, (.05, .23)];
but not for errors: [F (2, 154) = 1.01, p = .37, 2 = .01, (.00, .06)]}, whereasXXX F.G. Luna, P. Barttfeld, E. Martín-Arévalo, J. Lupiáñez
the remaining interactions did not reach statistical significance: Warning
signal × Congruency {RT: [F (1, 77) = 3.13, p = .08, 2 = .04, (.00, .15)];
errors: F < 1}, and Visual cue × Congruency {RT: [F (2, 154) = 2.41, p =
.09, 2 = .03, (.00, .09)]; errors: F < 1}. The three way interaction between
the three within-participant factors was far from significance for both RT [F
(2, 154) = 1.15, p = .32, 2 = .01, (.00, .06)] and errors [F (2, 154) = 1.48, p
= .23, 2 = .02, (.00, .07)]. Finally, task version did not modulate any other
factor or their interactions, neither for RT (all Fs < 1.40, ps > .24) nor for
errors (all remaining Fs < 2.95, ps > .09). Table 1 shows the mean RT and
errors for each of the ANTI trials conditions.
Table 1. Mean correct RT (ms) and percentage of errors of warning signal, visual cue, and
congruency conditions as a function of the task version (standard/lure).
Standard Lure
Congruent Incongruent Congruent Incongruent
M 95% CI M 95% CI M 95% CI M 95% CI
Reaction Time
No tone Invalid 671 [638, 703] 722 [688, 755] 653 [620, 686] 700 [666, 734]
No cue 676 [643, 709] 711 [679, 743] 655 [621, 688] 685 [652, 718]
Valid 643 [607, 680] 685 [652, 718] 632 [595, 669] 666 [632, 699]
Tone Invalid 656 [624, 689] 713 [680, 746] 642 [609, 675] 688 [655, 721]
No cue 623 [594, 652] 677 [643, 711] 614 [584, 643] 660 [625, 694]
Valid 612 [581, 643] 663 [628, 698] 602 [570, 633] 636 [601, 671]
Errors
No tone Invalid 8.85 [6.14, 11.57] 7.08 [5.05, 9.12] 8.65 [5.91, 11.40] 8.44 [6.38, 10.50]
No cue 6.15 [3.94, 8.35] 6.56 [4.38, 8.75] 9.94 [7.70, 12.17] 8.76 [6.55, 10.97]
Valid 8.23 [5.79, 10.67] 8.44 [5.93, 10.94] 8.76 [6.29, 11.23] 10.47 [7.93, 13.01]
Tone Invalid 7.19 [4.92, 9.45] 4.58 [2.53, 6.64] 7.16 [4.86, 9.45] 8.12 [6.04, 10.20]
No cue 5.10 [3.12, 7.09] 3.96 [1.55, 6.36] 6.94 [4.94, 8.95] 9.83 [7.39, 12.27]
Valid 7.08 [4.36, 9.81] 5.94 [3.51, 8.36] 10.68 [7.93, 13.44] 10.47 [8.01, 12.93]
Note: M = mean; CI = confidence intervals.
Executive vigilance decrement. Hits. As depicted in Fig. 4, a significant
decrement across blocks was observed on hits [F (5, 385) = 4.16, p = .001,
2 = .05, (.01, .09)] together with a main effect of task version [F (1, 77) =
6.59, p = .01, 2 = .08, (.00, .21)]. The overall percentage of hits was higher
in the standard (M = 81.77%, [76.42, 87.17]) than in the lure version (M =
71.96%, [66.54, 77.37]).
The decrease on hits across blocks was not modulated by the task
version (F < 1). Post-hoc comparisons confirmed that the linear component
of blocks observed with each task version did not differ from each other (F
< 1). However, when task versions were analyzed separately, the linear
component was significant in the standard version [F (1, 77) = 7.02, p =The ANTI-Vea task XXX .009, 2 = .08, (.00, .21)], but not in the lure one [F (1, 77) = 3.18, p = .08, 2 = .04, (.00, .15)]. False alarms. FA computed from all trials did not change significantly across blocks [F (5, 385) = 1.42, p = .21, 2 = .02, (.00, .04)] and it was not modulated by the task version (F < 1; see Fig. 4). However, there was a significant main effect for task version [F (1, 77) = 8.60, p = .004, 2 = .10, (.01, .24)], with a smaller overall percentage of FA in the standard (M = 4.74%, [3.46, 6.02]) than in the lure version (M = 7.42%, [6.12, 8.71]). Importantly, as expected and observed in the same Fig. 4, the corrected computation showed an important increase in FA. The main effect of task version [F (1, 77) = 22.59, p < .001, 2 = .23, (.08, .37)] was larger than in the computation from all trials, with much more FA in the lure (corrected M = 19.50%, [16.16, 22.83]) than in the standard version (corrected M = 8.31%, [5.02, 11.60]). Nevertheless, despite the important increase in the corrected FA, no main effect of blocks was observed [F (5, 385) = 1.24, p = .29, 2 = .02, (.00, .04)] and neither was it modulated by task version (F < 1). Post-hoc comparisons confirmed that the linear component of blocks for each task version separately was not significant (both Fs < 1.20, ps > .28). Figure 4. Hits and false alarms (FA) across time on task. The FA rate computed considering all trials is shown in the central graph and the corrected computation of FA is depicted in the right graph. Error bars represent 95% confidence intervals as computed following the method developed by Cousineau (2005). Sensitivity. As can be observed in Fig. 5, Aʹ computed from all trials showed a significant decrement across blocks [F (5, 385) = 2.55, p = .03, 2
XXX F.G. Luna, P. Barttfeld, E. Martín-Arévalo, J. Lupiáñez

= .03, (.00, .06)], independently of the task version (F < 1). In addition, the
main effect of task version was significant [F (1, 77) = 15.08, p < .001, 2 =
.16, (.04, .31)], with a higher sensitivity in the standard (Aʹ = .94, [.93, .95])
than in the lure version (Aʹ = .90, [.89, .92]).
 The corrected computation of Aʹ (i.e., including only the corrected
FA) showed an even larger main effect of task version than in the
computation from all trials [F (1, 77) = 59.37, p < .001, 2 = .44, (.27, .56)],
with a higher sensitivity in the standard (corrected Aʹ = .93, [.91, .94]) than
in the lure version (corrected Aʹ = .86, [.84, .87]). Most important, as
depicted in the same Fig. 5, the corrected computation of Aʹ demonstrated
that sensitivity did not change across blocks (F < 1), again independently of
task version (F < 1). Post-hoc comparisons for corrected Aʹ confirmed that
the linear component of blocks was not significant, neither for the standard
[F (1, 77) = 1.48, p = .23, 2 = .02, (.00, .11)] nor for the lure version [F (1,
77) = 1.35, p = .25, 2 = .02, (.00, .11)].
 To test whether the collected evidence regarding Aʹ computed from
corrected trials supports that no change is observed in sensitivity across
time on task, we performed a Bayesian analysis. We followed the guidelines
suggested by Wagenmakers et al. (2018) to conduct a Bayesian mixed
ANOVA with JASP (2019). Compared to the matched model, the Bayesian
ANOVA led to a BF10 = 0.013 for the effect of blocks, thus providing strong
evidence in favor of the null hypothesis (i.e., the absence of change in
sensitivity across time on task being 1/0.013 = 76.92 times more likely than
the change in sensitivity).
 Response bias. As can be observed in Fig. 5, Bʺ computed from all
trials showed a significant increment across blocks [F (5, 385) = 2.66, p =
.02, 2 = .03, (.00, .06)]. No main effect of task version (F < 1), or Task
version × Blocks interaction [F (5, 385) = 1.79, p = .11, 2 = .02, (.00, .05)]
were observed. The overall Bʺ computed from total trials was similar for
both the standard (Bʺ = .32, [.16, .47]) and the lure version (Bʺ = .32, [.16,
.48]).
Importantly, as depicted in the same Fig. 5, the corrected computation of Bʺ
(i.e., including only the corrected FA) confirmed the increment in response
bias across blocks [F (5, 385) = 3.03, p = .01, 2 = .04, (.00, .07)]. Again,
this increment was not modulated by the task version [F (5, 385) = 1.52, p =
.18, 2 = .02, (.00, .04)]. The main effect of task version was not significant
(F < 1), with a similar overall performance for the standard (corrected Bʺ =
.22, [.05, .38]) and the lure version (corrected Bʺ = .12, [-.05, .29]).
Nevertheless, as shown in Fig. 5, when task versions were analyzed
separately the linear increment was significant for the standard [F (1, 77) =
The ANTI-Vea task XXX

 7.81, p = .006, 2 = .10, (.04, .14)], but not for the lure version [F (1, 77) =
 1.34, p = .25, 2 = .02, (.00, .04)], as in the case of hits.

Figure 5. Sensitivity and response bias across time on task. The left graph represents the non-corrected
and corrected computation of sensitivity. The non-corrected computation of response bias is shown in the
central graph and its corrected computation in the right graph. Error bars represent 95% confidence
intervals and were computed following the method developed by Cousineau (2005).

 Arousal vigilance decrement. Mean and RT Variability, and lapses
 percentage. Fig. 6 shows the significant increment across blocks for mean
 RT [F (5, 385) = 2.51, p = .03, 2 = .03, (.00, .06)], SD of RT [F (5, 385) =
 4.03, p = .001, 2 = .05, (.01, .09)], and lapses percentage [F (5, 385) =
 2.36, p = .03, 2 = .03, (.00, .06)]. None of these increments was modulated
 by the task version (all Fs < 1). Considering the two task versions together,
 post-hoc comparisons confirmed a significant linear increment across
 blocks for both SD of RT [F (1, 77) = 8.95, p = .003, 2 = .10, (.05, .15)]
 and lapses percentage [F (1, 77) = 4.60, p = .04, 2 = .06, (.01, .10)] and a
 marginal linear increment for mean RT [F (1, 77) = 3.94, p = .05, 2 = .05,
 (.01, .09)].
 In general, task versions did not differ significantly for any
 dependent AV variable (all Fs < 1.10, ps > .29): mean RT (standard = 475
 ms, [455, 495]; lure = 471 ms, [451, 491]), SD of RT (standard = 74, [62,
 85]; lure = 73, [61, 85]) and lapses (standard = 10.91%, [6.46, 15.36]; lure =
 7.59%, [3.08, 12.10]).
XXX F.G. Luna, P. Barttfeld, E. Martín-Arévalo, J. Lupiáñez

Figure 6. Arousal vigilance performance across time on task. Mean RT (left graph), SD of RT
(central graph), and lapses percentage (right graph). Error bars represent 95% confidence intervals as
computed following the method developed by Cousineau (2005).

 DISCUSSION
 The present study aimed at providing additional empirical evidence
 to demonstrate the suitability of the ANTI-Vea task to assess both the EV
 and AV decrement together with the classic attentional networks functions.
 To specifically examine the EV component, we extended the
 methodological approach of Thomson et al. (2016) to the ANTI-Vea aiming
 at avoiding a floor effect on the FA, so that the EV decrement across time
 on task can be appropriately interpreted as a progressive loss in sensitivity
 vs. a change in the response bias towards a more conservative criterion. To
 this end, we computed a corrected FA rate in two versions of the ANTI-
 Vea, i.e., the standard task developed in Luna et al. (2018) and a lure
 version adapted following the experimental design of Thomson et al. Thus,
 we expected to obtain an appropriate rate of FA (i.e., above the floor level)
 to avoid the masking of any potential change in the response bias across
 time on task.
 As predicted, we observed a higher FA rate when it was computed
 only from the corrected trials than from all the noise events, in the same
 vein as reported by Thomson et al. (2016). Importantly, note that even
 though in the lure version it was observed a considerable FA rate in the first
 period of the task (i.e., ~22% considering the corrected computation),
 neither in the standard nor in the lure version it was found a significant
 change on FA across blocks. Consequently, the linear drop on hits (which,
 importantly, started after the first block and was progressive across time-on-
 task) was not accompanied by an increase or decrease in the corrected
The ANTI-Vea task XXX

computation of FA across time, thus the EV decrement being observed
exclusively as a change in the response bias towards a more conservative
criterion. Indeed, and again similar to the outcomes reported by Thomson et
al., the sensitivity-loss effect was observed only when it was computed
considering FA from all the noise trials, but not when considering the
corrected FA.
 It is worth noting that, recently, the study of Thomson et al. (2016)
received several critics by Fraulini, Hancock, Neigel, Claypoole, & Szalma
(2017). These authors questioned the analytical methods carried out by
Thomson et al. to obtain SDT metrics. In short, note that in a typical signal
detection task based on a 2-alternative-forced-choice paradigm, there are
usually two categories of events, i.e., signal and noise (Stanislaw &
Todorov, 1999). However, the approach taken by Thomson et al. seems to
introduce an additional category of events, i.e., the ‘lure’ ones. Thus,
Fraulini et al. objected that in the vigilance task developed by Thomson et
al., participants would discriminate events between the three categories and
therefore, SDT metrics should be computed considering responses as a
function of: (a) signal vs. noise events (i.e., the ‘total’ computation of SDT
metrics), (b) signal vs. lure events (i.e., the ‘corrected’ computation), and
(c) non-lure vs. lure events, a stimuli discrimination not considered by
Thomson et al.
 However, it is important to note that this criticism does not apply to
our adaptation of Thomson et al. (2016)’ approach to the ANTI-Vea task
because there is no real distinction between lure and non-lure events in the
ANTI-Vea. This distinction is arbitrary in the ANTI-Vea and only made a
posteriori for the purpose of analysis. Therefore, despite the objection stated
by Fraulini et al. (2017), the computation of corrected SDT metrics seems
to be an adequate approach to analyze the EV decrement in signal detection
tasks, at least in tasks like the one embedded in the ANTI-Vea.
 Moreover, Fraulini et al. (2017) pointed out that in Thomson et al.
(2016) the vigilance task was performed online and outside the lab, without
controlling the experimental context. Notwithstanding, Thomson et al.
outcomes were replicated later in a study conducted under the typical lab
conditions (Claypoole et al., 2018). Indeed, we have recently analyzed the
reliability of the vigilance and attentional components of the ANTI-Vea in a
study with a large sample (N = 617), wherein participants either performed
the standard ANTI-Vea in the lab or the online version
(https://www.ugr.es/~neurocog/ANTI/) outside the lab in a suitable place of
their choosing (Luna, Roca, Martín-Arévalo, & Lupiáñez, 2020). In short,
we observed that in both task versions, the split-half reliability indices
(corrected by the Spearman-Brown prophecy) were higher than .75 for both
XXX F.G. Luna, P. Barttfeld, E. Martín-Arévalo, J. Lupiáñez

the EV and AV measures. Most importantly, the EV decrement was only
found as a linear increment in the response bias when FA are not at floor in
the first block of the task, independently on the task version (lab vs. online).
 Furthermore, the present study replicated the fact that the EV
decrement can be simultaneously assessed with the AV decrement and the
classic attentional functions (Luna et al., 2018), as independently measured
by specific tasks like the ANTI (Callejas et al., 2004), the PVT (Lim &
Dinges, 2008), and a signal detection task as the MCT (Mackworth, 1948).
In particular, we observed the typical main effects and interactions for
phasic alertness, orienting, and executive control functions, as usually
reported with the ANTI task (Callejas et al., 2005, 2004). Nevertheless, in
this version of the ANTI, the classic attentional functions are measured with
effects of a similar size (~40 ms each, see Fig. 3). Indeed, the ~40 ms effect
of executive control observed with the ANTI-Vea (for a specific analysis of
this issue, see Luna, Telga, Vadillo, & Lupiáñez, 2020) is similar to those of
phasic alertness and orienting, in contrast with other versions of the task
which produce a much larger effect of executive control (between ~60 and
~100 ms; Callejas et al., 2004; Fan, McCandliss, Sommer, Raz, & Posner,
2002; Roca, Castro, López-Ramón, & Lupiáñez, 2011).
 The AV decrement was found as usually observed with the PVT: a
significant increment across time on task in mean and RT variability, and
the percentage of lapses (Basner & Dinges, 2011; Lim & Dinges, 2008).
Importantly, whereas no differences were observed between the standard
and lure versions regarding AV and the classic attentional functions, it
seems that the standard task was more suitable for measuring the EV
decrement than the lure one. For instance, in the standard version, we
observed a higher percentage of hits, a linear decrement on hits, and a more
pronounced increment in the response bias, in comparison with the lure
task. Furthermore, the standard version does not suffer from Fraulini et al.
(2017)’ criticism about the three categories of events, as discussed above.
Therefore, although the lure task was tested here as an alternative version of
the ANTI-Vea, the standard ANTI-Vea was revealed as the most adequate
version of the task.
 Future studies might examine whether the ANTI-Vea is a suitable
method to overcome some theoretical and empirical limitations observed in
the study of the vigilance decrement phenomenon by cognitively simple and
repetitive behavioral tasks (Fortenbaugh, DeGutis, & Esterman, 2017;
Thomson, Besner, & Smilek, 2015; Thomson et al., 2016). Note that,
traditionally, the EV decrement has been examined by simple signal
detection tasks wherein it is commonly observed a progressive loss in
sensitivity: a behavioral pattern explained by the resources overload model
The ANTI-Vea task XXX

as the consequence of a progressive depletion in the available attentional
resources (R. A. Grier et al., 2003; Jun, Remington, Koutstaal, & Jiang,
2019; See et al., 1995; Warm et al., 2008). However, as demonstrated by
recent research, the loss in sensitivity might be an artifact of simple
vigilance tasks wherein it is usually observed a floor rate on FA (Claypoole
et al., 2018; Thomson et al., 2016).
 An alternative account has been proposed by the resources-control
model, which predicts that the vigilance decrement might be a consequence
of a progressive loss on cognitive control functioning, which is necessary to
sustain attentional resources on the task performed at hand. As a
consequence, resources are diverted to internal irrelevant thoughts leading
to a progressive decrement in vigilance performance (Thomson et al.,
2015). Nevertheless, further empirical evidence is necessary to test the
predictions stated by the resources-control model, for which a multiple
behavioral task as the ANTI-Vea with independent measures of vigilance
and cognitive control processes seem to be a more adequate approach than
traditional simple signal detection tasks, or tasks measuring executive
control but no vigilance decrements, like the one recently used to
investigate the decrement in executive control across time on task by
Zholdassova, Kustubayeva, & Matthews (2019).
 To conclude, the ANTI-Vea has been revealed to be a suitable task
to assess simultaneously: (a) the independence and interactions of the
classic attentional functions, (b) the EV decrement as a progressive change
in the response bias towards a more conservative criterion, and (c) the AV
decrement as a progressive slowness and variability in RT, and lapses
percentage. Regarding the EV component, we extended the methodological
approach developed by Thomson et al. (2016) to the ANTI-Vea to obtain a
corrected FA rate, which proved to be useful to avoid a floor level on FA
that could mask a potential change in the response bias. Therefore, this
approach should be used in the analysis of the EV decrement with the
ANTI-Vea task. The present study provides further empirical evidence
demonstrating that the EV and AV decrement can be successfully assessed
along with multiple attentional functions in a complex task as the ANTI-
Vea (Roca et al., 2018; Tkachenko & Dinges, 2018; Wickens et al., 2015).
The task has proven to be useful to measure the functioning of the three
attentional networks and vigilance (EV and AV) as a function of different
variables like age and sport practice (Huertas et al., 2019), or musical
practice (Román-Caballero, Martín-Arévalo, & Lupiáñez, 2020). At Open
Science Framework (https://osf.io/awz3g/) can be found useful tools for the
research with the ANTI-Vea task, both with the standard version, as the one
used in the present research, and the web-based version
XXX F.G. Luna, P. Barttfeld, E. Martín-Arévalo, J. Lupiáñez

(www.ugr.es/~neurocog/ANTI/), that is freely available in different
languages.

 RESUMEN
 Tradicionalmente, el decremento de la vigilancia se ha estudiado con
tareas comportamentales simples y repetitivas. Sin embargo, actualmente
existe un considerable interés en evaluar la vigilancia con tareas más
complejas que incluyan medidas independientes de otros procesos
atencionales. En el presente estudio, nuestro objetivo fue proporcionar
nueva evidencia empírica sobre la adecuación del Test de Redes
Atencionales para Interacciones y Vigilancia – componentes ejecutivo y de
activación (ANTI-Vea) para medir simultáneamente múltiples componentes
atencionales y de vigilancia. Examinamos la vigilancia como dos
componentes disociados: vigilancia ejecutiva –como la detección de señales
infrecuentes– y vigilancia de activación –como el mantenimiento de una
reacción rápida a los estímulos sin control sobre la respuesta–. Es
importante destacar que la vigilancia ejecutiva se analizó con un novedoso
método para determinar si un efecto suelo en las falsas alarmas podría
influenciar una disminución en la sensibilidad. Como se esperaba, se
observó que la tarea ANTI-Vea es adecuada para medir: (a) los efectos
principales e interacciones de las funciones de alerta fásica, orientación, y
control ejecutivo; (b) el decremento en la vigilancia ejecutiva como un
cambio en la tendencia de la respuesta; y (c) el decremento en la vigilancia
de activación como un enlentecimiento y variabilidad de la respuesta.
Discutimos algunas implicaciones teóricas y empíricas sobre la medición de
los componentes de la vigilancia con la tarea ANTI-Vea. Esperamos que el
presente estudio provea un método adecuado para analizar el decremento de
la vigilancia cuando se evalúan múltiples funciones atencionales y de
vigilancia.

 Acknowledgments

 This work was supported by the Spanish Ministry of Economy,
Industry, and Competitiveness, research project to JL [grant number
PSI2017-84926-P]; and by the Secretaría de Ciencia y Tecnología from the
Universidad Nacional de Córdoba, Argentina (Proyecto Estimular to FGL);
FGL received PhD scholarship support from the Consejo Nacional de
Investigaciones Científicas y Técnicas (CONICET), Argentina; FGL
received a scholarship mobility by the Asociación Universitaria
Iberoamericana de Posgrado (AUIP) in cooperation with the Consejería de
The ANTI-Vea task XXX

Economía y Conocimiento de la Junta de Andalucía, España; EMA was
supported by a Juan de la Cierva postdoctoral fellowship from the Spanish
Ministry of Economy, Industry, and Competitiveness [IJCI-2015-23204].
Preliminary results of this work has been presented in the Spanish XI
Scientific Meeting of Attention (RECA), developed from 28th to 30th of
September 2017 in Baeza, Spain. This paper is part of the doctoral thesis by
the first author, under the supervision of the last two authors.

 REFERENCES
Adams, J. A. (1987). Criticisms of Vigilance Research: A Discussion. Human Factors,
 29(6), 737–740. https://doi.org/10.1177/001872088702900612
Basner, M., & Dinges, D. F. (2011). Maximizing sensitivity of the psychomotor vigilance
 test (PVT) to sleep loss. Sleep, 34(5), 581–591.
 https://doi.org/10.1093/sleep/34.5.581
Bastien, C. H., Vallières, A., & Morin, C. M. (2001). Validation of the Insomnia Severity
 Index as an outcome measure for insomnia research. Sleep Medicine, 2(4), 297–307.
 https://doi.org/10.1016/S1389-9457(00)00065-4
Broadbent, D. E., Cooper, P. F., FitzGerald, P., & Parkes, K. R. (1982). The Cognitive
 Failures Questionnaire (CFQ) and its correlates. British Journal of Clinical
 Psychology, 21(1), 1–16. https://doi.org/10.1111/j.2044-8260.1982.tb01421.x
Callejas, A., Lupiáñez, J., Funes, M. J., & Tudela, P. (2005). Modulations among the
 alerting, orienting and executive control networks. Experimental Brain Research,
 167(1), 27–37. https://doi.org/10.1007/s00221-005-2365-z
Callejas, A., Lupiáñez, J., & Tudela, P. (2004). The three attentional networks: on their
 independence and interactions. Brain and Cognition, 54(3), 225–227.
 https://doi.org/10.1016/j.bandc.2004.02.012
Claypoole, V. L., Neigel, A. R., Fraulini, N. W., Hancock, G. M., & Szalma, J. L. (2018).
 Can vigilance tasks be administered online? A replication and discussion. Journal of
 Experimental Psychology: Human Perception and Performance, 44(9), 1348–1355.
 https://doi.org/10.1037/xhp0000538
Cousineau, D. (2005). Confidence intervals in within-subject designs: A simpler solution to
 Loftus and Masson’s method. Tutorials in Quantitative Methods for Psychology,
 1(1), 42–45. https://doi.org/10.20982/tqmp.01.1.p042
Cumming, G. (2014). The New Statistics: Why and How. Psychological Science, 25(1), 7–
 29. https://doi.org/10.1177/0956797613504966
Derryberry, D., & Reed, M. A. (2002). Anxiety-related attentional biases and their
 regulation by attentional control. Journal of Abnormal Psychology, 111(2), 225–
 236. https://doi.org/10.1037/0021-843X.111.2.225
Drummond, S. P. a, Bischoff-Grethe, A., Dinges, D. F., Ayalon, L., Mednick, S. C., &
 Meloy, M. J. (2005). The neural basis of the psychomotor vigilance task. Sleep,
 28(9), 1059–1068. https://doi.org/10.1093/sleep/28.9.1059
Fan, J., McCandliss, B. D., Sommer, T., Raz, A., & Posner, M. I. (2002). Testing the
 efficiency and independence of attentional networks. Journal of Cognitive
 Neuroscience, 14(3), 340–347. https://doi.org/10.1162/089892902317361886
You can also read