Impacts of Late-Spring North Eurasian Soil Moisture Variation on Summer Rainfall Anomalies in Northern East Asia
←
→
Page content transcription
If your browser does not render page correctly, please read the page content below
Impacts of Late-Spring North Eurasian Soil Moisture
Variation on Summer Rainfall Anomalies in
Northern East Asia
Yinghan Sang ( 1128sang@sina.cn )
Nanjing University of Information Science and Technology
Hong-Li Ren
State Key Laboratory of Severe Weather https://orcid.org/0000-0001-7194-0567
Yi Deng
Georgia Institute of Technology
Xiaofeng Xu
China Meteorological Administration
Xueli Shi
China Meteorological Administration
Shuo Zhao
State Key Laboratory of Severe Weather
Research Article
Keywords: soil moisture, summer rainfall, North Eurasia, northern East Asia
DOI: https://doi.org/10.21203/rs.3.rs-419930/v1
License: This work is licensed under a Creative Commons Attribution 4.0 International License.
Read Full License
Page 1/25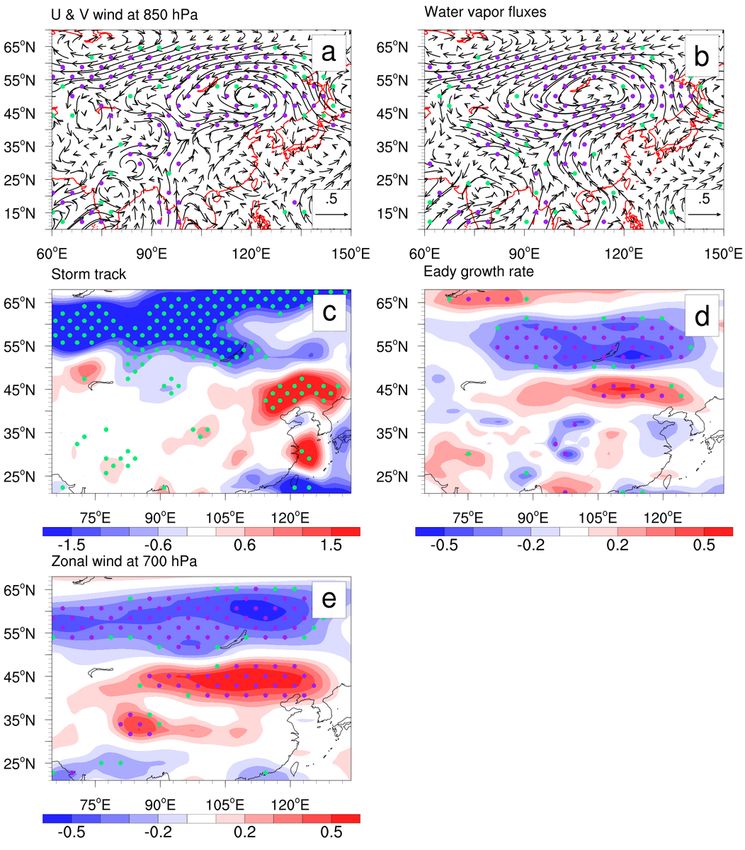
Abstract
This paper reports ndings from a diagnostic and modeling analysis that investigates the impact of the
late-spring soil moisture anomaly over North Eurasia on the boreal summer rainfall over northern East
Asia (NEA). Soil moisture in May in the region from the Kara-Laptev Sea coasts to Central Siberian
Plateau is found to be negatively correlated with the summer rainfall from Mongolia to Northeast China.
The atmospheric circulation anomalies associated with the anomalously dry soil are characterized by a
pressure dipole with the high-pressure center located over North Eurasia and the low-pressure center over
NEA, where an anomalous lower-level moisture convergence occurs, favoring rainfall formation.
Diagnoses and Modeling experiments demonstrate that the effect of the spring low soil moisture over
North Eurasia may persist into the following summer through modulating local surface latent and
sensible heat uxes, increasing low-level air temperature at higher latitudes, and effectively reducing the
meridional temperature gradient. The weakened temperature gradient could induce the decreased zonal
wind and the generation of a low-pressure center over NEA, associated with a favorable condition of local
synoptic activity. The above relationships and mechanisms are vice versa for the prior wetter soil and
decreased NEA rainfall. These ndings suggest that soil moisture anomalies over North Eurasia may act
as a new precursor providing an additional predictability source for better predicting the summer rainfall
in NEA.

1 Introduction
As an important part of the surface hydrological cycle, soil moisture plays a vital role in global land–
atmosphere interactions (Seneviratne et al. 2010). By in uencing numerous physical processes in land–
atmosphere interactions, soil moisture has considerable impacts on climate elements, such as
precipitation and temperature. Similar to ocean, soil moisture has the character of “memory” (Koster et al.
2001; Shinoda 2001; Ruosteenoja et al. 2018). Previous studies have indicated that soil moisture signals
in middle and high latitudes of the Northern Hemisphere could last 1–3 months and have a lagged effect
on atmospheric circulation anomalies, which will further in uence climate elements (Shukla and Mintz
1982; Dirmeyer et al. 2009). As a result of its memory effect, soil moisture as a precursor is instructive for
short-term climate prediction.

The climatic effects of soil moisture have been extensively studied during the past few decades (e.g., Yeh
et al. 1984; Chahine 1992; Dai et al. 1999; Koster et al. 2001, 2003; Seneviratne et al. 2006; Sato and
Nakamura 2019). Based on highly controlled numerical experiments by different climate models, Koster
et al. (2004) proposed that there are speci c “hot spots” with strong land–atmosphere couplings, where
soil moisture anomalies have substantial impacts on precipitation through in uencing evaporation and
other surface energy uxes. In recent years, studies have shown that better precipitation simulations and
predictions may be expected with the improved accuracy of initial soil moisture, which could exert distinct
in uences on precipitation change (Shi et al. 2021). Wu and Zhang (2013), based on Weather Research
and Forecasting (WRF) model simulations, explored the role of soil moisture playing in the formation of
the ood and drought over East China in the summers of 1998 and 1999, and showed that soil moisture
                                                   Page 2/25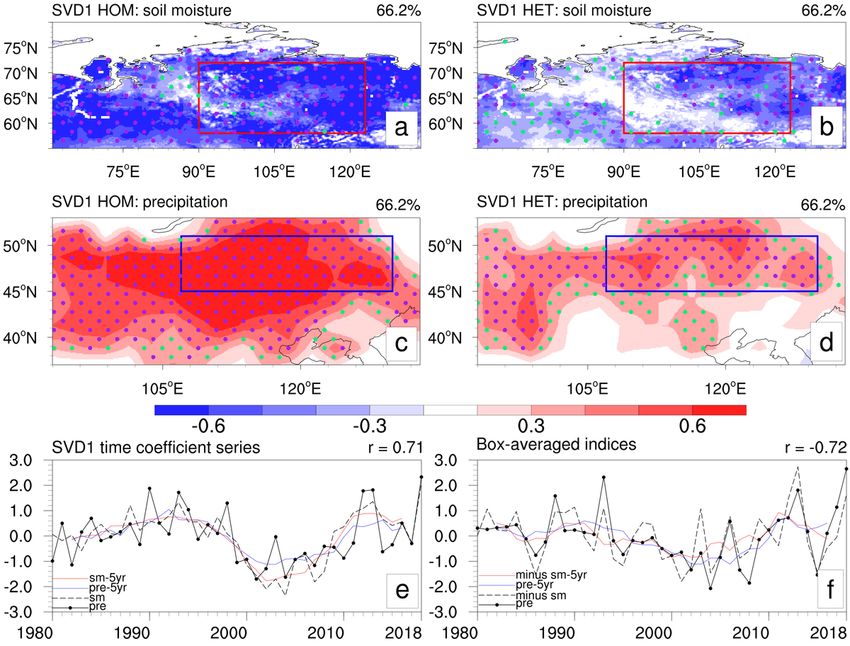
substantially contributes to both droughts and oods over northern East China through its memory.
These results could help improve the skill of seasonal precipitation prediction.

However, owing to the de ciencies of reliable large-spatial and long-term measurement of soil moisture,
many studies have had to rely on model simulations to investigate the relationship between soil moisture
and climate variability (Wu and Dickinson 2004; Kim and Hong 2007). Therefore, further diagnoses based
on the increasing amounts of new observations as well as the latest reanalysis products are still needed.
Moreover, previous studies have mainly focused on the local climate effects of soil moisture anomalies
and rarely on the potential remote impacts. Xue et al. (2018) demonstrated that the upstream land
surface, by in uencing heat uxes, may affect the subsequent downstream droughts/ oods in East Asia.
This study further demonstrated that such effects are not only constrained within local areas but also
extended downstream.

The East Asian summer rainfall directly in uences the economy and human wellbeing across the region.
However, increasing the accuracy of seasonal prediction of summer rainfall in East Asia has always
posed considerable challenges, particularly in its northern region (Ding and Chan 2005; Wang 2006; Zhou
and Zou 2010). Some studies have shown that summer precipitation in East China is in uenced by a
number of factors, including soil moisture, which is particularly important (Zuo et al. 2007; Dai et al. 2010;
Zhang et al. 2016a). However, the relationship between soil moisture and precipitation illustrated in these
studies has generally been constrained to include only the local effects within East China.

North Eurasia covering a vast area is located in the upper reaches of northern East Asia (NEA) and the
soil moisture there has the seasonal scale of memory (Dirmeyer et al. 2009). Given the relatively low
accuracy of summer rainfall prediction over NEA, the soil moisture variability over North Eurasia and its
possible impacts on the climate downstream are worthy of examination for a potential future application
in the seasonal prediction of summer rainfall. In this study, we aimed to investigate the linkage between
summer (June–August, JJA) precipitation anomalies in NEA and the precedent late-spring (May) soil
moisture anomalies upstream in North Eurasia through both observational data diagnoses and numerical
model experiments. The results may provide new insights on how to improve the prediction of summer
precipitation in NEA.

The remainder of the paper will be organized as follows. Section 2 describes data, methods and climate
model used here, while Section 3 discusses the relation of the late-spring soil moisture anomalies with
the summer rainfall anomalies in NEA. Section 4 presents an analysis of the physical mechanism
through which the soil moisture affects the atmospheric circulation connected with rainfall. The results of
numerical model experiments are given in Section 5. Finally, the summary and discussions are provided
in Section 6.

2 Data, Methods And Numerical Model
2.1 Data

                                                  Page 3/25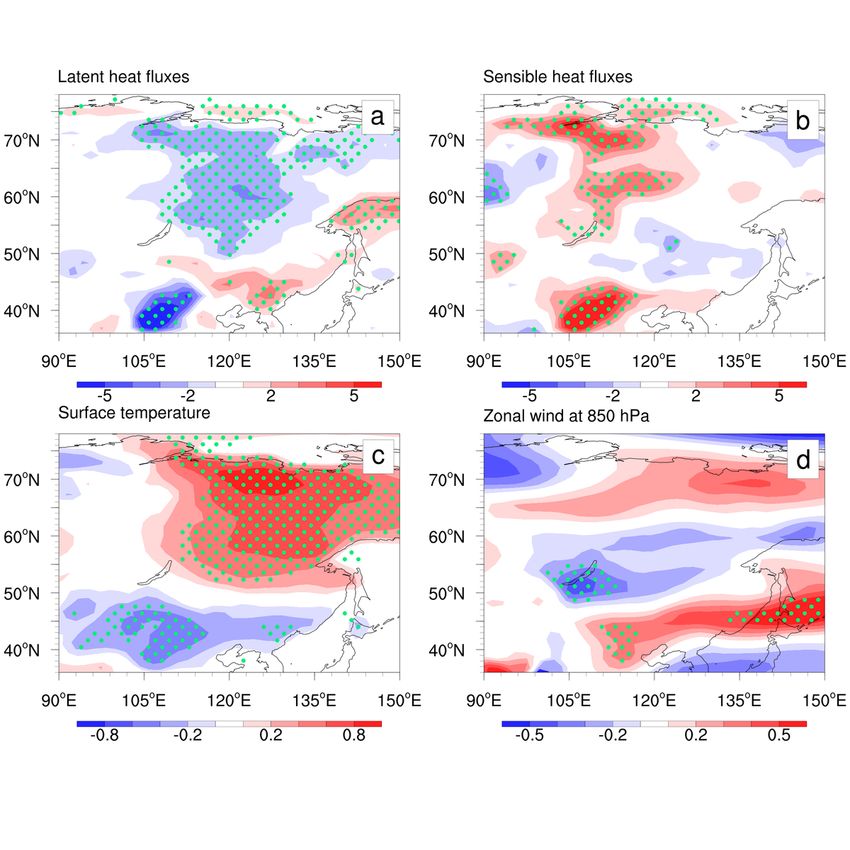
Due to the lack of reliable SM gauge measurement datasets covering large-domain and long-term scales
in situ observations, assimilation and reanalysis products are generally two kinds of alternative SM
datasets available for researches. Assimilated soil moisture data products such as the Global Land Data
Assimilation System (GLDAS) use advanced land surface modeling and data assimilation techniques to
provide combined satellite- and ground-based observational products for soil moisture research (Rodell et
al. 2004). In the current study, the two versions of GLDAS (v2.0 and v2.1) data were combined to form the
monthly mean near-surface (0–10 cm) soil moisture dataset on a 0.25° latitude × 0.25° longitude grid
covering the period of 1980–2018, from the Goddard Earth Sciences Data and Information Services
Center. In addition, soil moisture on the rst level (7 cm) from the European Centre for Medium-Range
Weather Forecasts (ECMWF) reanalysis (ERA) Interim/Land data (Balsamo et al. 2015), which includes
the land reanalysis product using the latest ECMWF land surface model with numbers of
parameterization improvements in the land surface scheme, was used as a reference to make our
conclusions more robust. Correspondingly, the surface heat uxes data were also chosen from the
GLDAS and ERA-Interim/Land. Unless stated otherwise, the related gures and indices displayed in this
paper were calculated using the GLDAS. Monthly mean precipitation data used here are from the CPC
(Climate Prediction Center) Merged Analysis of Precipitation (CMAP, Xie and Arkin 1997). The daily and
monthly atmospheric circulation eld data (e.g., sea level pressure (SLP), geopotential heights, zonal and
meridional wind) were obtained from the National Center for Environmental Prediction and Department of
Energy Reanalysis 2 (NCEP-DOE R2, Kanamitsu et al. 2002) covering the period 1980–2018.

2.2 Methods

To demonstrate the dominant coupled modes between the summer rainfall in NEA and the preceding soil
moisture upstream in North Eurasia, we used the singular value decomposition (SVD) analysis (also
known as maximum covariance analysis) (Wallace et al. 1992; Von Storch and Zwiers 1999). Other
commonly used statistical analysis techniques and metrics such as Pearson correlation and linear
regression were also adopted in this study. All the data were linearly detrended and the annual cycle was
removed to focus on climate anomalies. Furthermore, the Eady growth rate (Eady 1949) is calculated
using daily data to represent the baroclinic instability.

2.3 Numerical model

The Community Earth System Model version 1.2.2 (CESM 1.2.2), a state-of-the-art coupled climate model,
with interactive components of the atmosphere, land, ocean and sea ice, was used to detect the effects of
the preceding soil moisture anomalies in this study. The Version 4.0 of Community Land Model (CLM 4.0)
is the land component of CESM 1.2.2, which mainly includes the processes of surface energy
transportation, hydrology and biogeochemical cycles (Lawrence et al. 2011). The Community
Atmospheric Model version 4.0 (CAM 4.0, Eaton 2010) possessing a horizontal resolution of 1.9° latitude
× 2.5° longitude and 26 vertical levels is the atmospheric component of CESM 1.2.2. Details of the
experimental design are provided in Section 5.

                                                    Page 4/25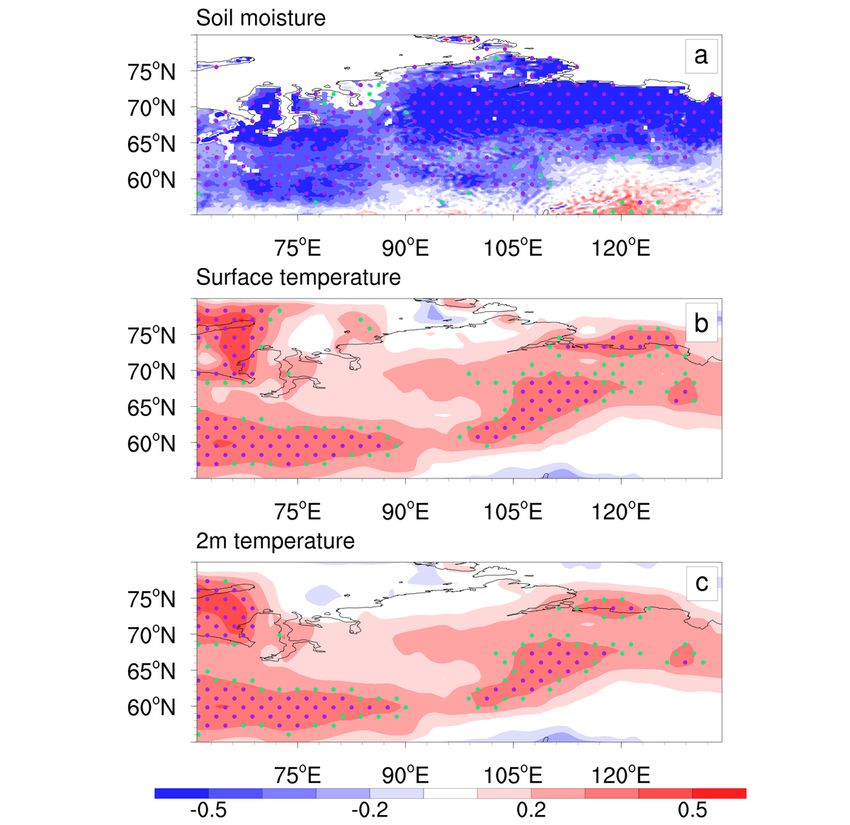
3 Relationship Between Nea Summer Rainfall And The Preceding Soil
Moisture In North Eurasia
3.1 The statistical relationship

Severe ood and drought events occurred over Northeast China in the summers of 2013 and 2015,
respectively, and caused substantial economic losses (Yang and He 2013; Wang et al. 2016). We found
that the summer rainfall anomalies are well associated with the precedent late-spring soil moisture
anomalies in North Eurasia. As shown in Figure 1, the negative soil moisture anomalies occur along with
the positive anomalies relating to the summer rainfall downstream, and vice versa. To con rm whether or
not these negative correlations are only rare cases, we applied SVD at a longer time scale ranging from
1980 to 2018. Figure 2 presents the results of the SVD analysis of soil moisture anomalies in May over
North Eurasia and precipitation anomalies in summer over NEA. The rst SVD (SVD1) modes of the
precipitation anomalies in summer and soil moisture anomalies in May account for 66.2% of their
covariance. Both of the two variables depict the same sign of homogeneous correlations in their
respective areas (Figures 2a and 2c), demonstrating that the late-spring soil moisture and summer
precipitation are characterized by consistent variations. Figures 2b and 2d show that the patterns of
SVD1 heterogeneous correlations are similar to those of homogeneous correlations, indicating a close
connection between these two elds. Speci cally, for the North Eurasian soil moisture anomalies in May,
the SVD1 spatial pattern shows signi cantly negative correlations covering Central Siberian Plateau and
the coastal areas of Kara-Laptev Sea. The spatial pattern of summer precipitation anomalies features
pronounced positive correlations from Mongolia to Northeast China, the sign of which is opposite to that
of soil moisture. The SVD1 modes calculated by ERA-Interim/Land ( gure not shown) resemble those of
GLDAS; however, the explained variance is lower (35.6%). Figure 2e presents the two extension coe cient
time series corresponding to the SVD1 modes with an apparent interannual variability. The coherent
decadal variations are signi cantly negatively correlated (r = 0.71, signi cant at the 95% con dence level
of Student’s t-test).

Note that actual anomalies of precipitation and soil moisture in each year are directly proportional to the
SVD pattern values multiplied by their corresponding time series for the year. When both the time series of
precipitation and soil moisture are positive, the soil moisture in North Eurasia will be negatively
anomalous and the precipitation over NEA will positively anomalous. This indicates that the precedent
dry soil moisture in North Eurasia is signi cantly related to the summer increased precipitation in NEA,
and vice versa. To more precisely describe the variations of the late-spring soil moisture and downstream
summer rainfall, we selected key regions of soil moisture (58°N–72°N, 90°E–123°E) and precipitation
(45°N–51°N, 107°E–130°E), and de ned the time series of averaged soil moisture anomalies in May and
averaged precipitation anomalies in JJA over their respective boxes as the soil moisture and precipitation
indices, respectively. The correlation coe cients between the two new indices and the corresponding
SVD1 time series are −0.81 and 0.70 for the soil moisture and precipitation, respectively, suggesting the
indices de ned by box-average can realistically represent the primary coupled and individual variations of
the two variables. More importantly, the correlation coe cient between the two indices is −0.72
                                                 Page 5/25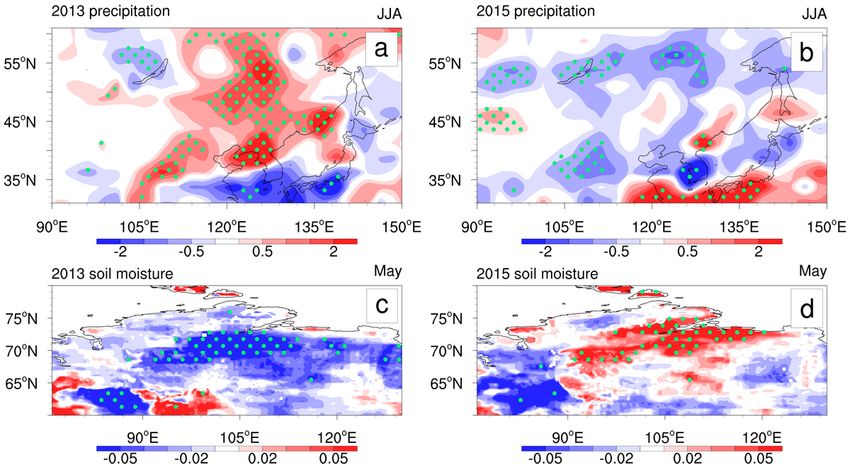
(signi cant at the 0.05 level, Figure 2f), which is almost the same as the negative correlation coe cient
between the two SVD1 time series. This further indicates that the summer rainfall anomalies in NEA are
signi cantly negatively correlated with the precedent upstream soil moisture anomalies in late spring over
North Eurasia. Furthermore, these two indices remain highly correlated after removal of the 5-year running
mean to eliminate the in uence of the decadal background (r = −0.78, signi cant at the 0.05 level), which
demonstrates that these two variables are highly correlated not only at the decadal scale, but also at the
interannual scale.

3.2 The atmospheric circulation anomaly related to the preceding soil moisture anomalies

We further explored whether the late-spring soil moisture anomalies are linked to atmospheric circulation
and further impact the downstream rainfall variation over NEA in the following summer. Figure 3 presents
patterns of SLP and geopotential height anomalies in JJA regressed against −1 × soil moisture index
(henceforth the minus soil moisture index). In summer, the statistically signi cant below-normal SLP,
which is conducive to the formation of positive rainfall anomalies, can be detected around NEA,
extending from Mongolia to Northeast China (Figure 3a). At the same time, the area from the coasts of
Kara-Laptev Sea to Central Siberian Plateau, including the key region of soil moisture, is covered by
signi cantly high SLP. Similarly, the geopotential height anomalies at 850-hPa level (Figure 3b) also show
a dipole pattern over Eurasia that highly resembles the pattern presented in SLP. That is, the key regions
of precipitation and soil moisture clearly show subnormal and above-normal pressures, respectively. The
similar pattern emerges to the heights of 500 and 200 hPa (Figures 3c and 3d) with signi cant negative
anomalies over the key region correlated with precipitation (although the range of negative values shows
some shrinkage). Therefore, the summer atmospheric circulation anomalies over NEA are clearly related
to the earlier upstream soil moisture in late spring over North Eurasia and further likely affect the summer
precipitation. Speci cally, the negative North Eurasian soil moisture anomalies intimately correspond to
the dipole pattern of “positive in the north and negative in the south” in atmospheric circulation
anomalies. Correspondingly, the key region in NEA where the summer precipitation is highly correlated
with the North Eurasian soil moisture is occupied by subnormal pressure from the lower to upper levels.
This quasi-barotropic anomaly structure favors the formation of positively anomalous summer rainfall in
this area. Similarly, the positive soil moisture anomalies upstream are supposed to be related with the
positive pressure anomalies and the decreased rainfall over NEA.

Figures 4a and 4b show the anomalies of 850-hPa wind and vertically integrated water vapor uxes in
summer regressed against the minus SM index, respectively. Both of the two variables show there is a
signi cantly anomalous cyclonic circulation pattern covering the area from Mongolia to Northeast China,
which is conducive to the atmospheric convergence and upward motion favoring the increase of rainfall.
There are two signi cant transport channels to NEA: one is from Bay of Bengal and South China Sea
merging into Southwest China, and the other is from the ocean east of Japan, providing the ush water
vapor condition for increasing the rainfall in NEA.

                                                  Page 6/25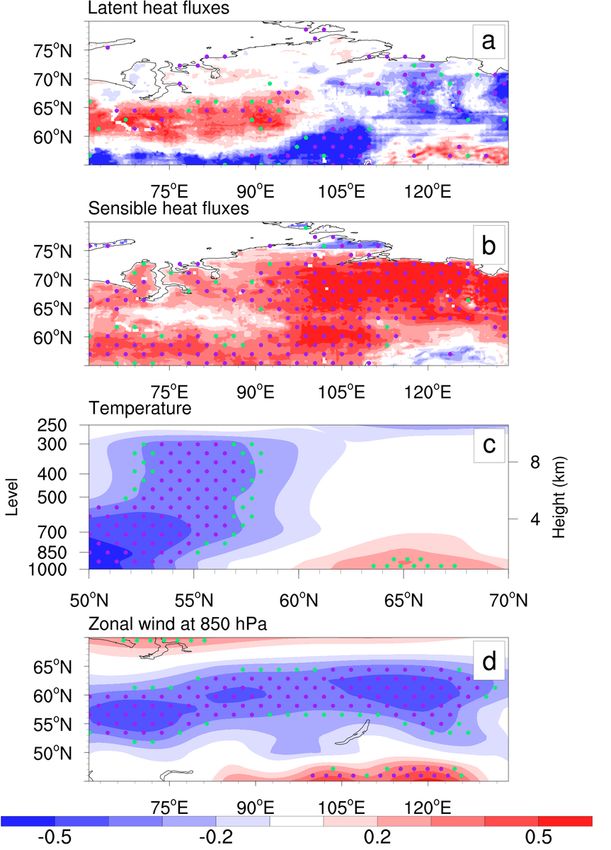
Storm track activity is also shown here to examine the effect of soil moisture on the NEA circulation.
Figure 4c gives the differences of JJA synoptic-scale meridional wind variance at 850 hPa between low-
soil moisture (indices less than one standard deviation) years and high-soil moisture (indices larger than
one standard deviation) years as representing the storm track through using a 2-8-d band-passed lter. It
can be seen that NEA is featured with positive values while the north is featured with negative ones. By
further regressing the summer Eady growth rate against the minus soil moisture index (Figure 4c), we
could nd that the pattern is reasonably consist with that of storm track. It suggests that the background
circulation anomalies (i.e., zonal wind, high/low pressure) related with the negative soil moisture
anomalies will lead to the strengthened baroclinic instability over NEA and the weakened one in the north.
Therefore, the synoptic eddies will be more active over NEA due to the strengthened baroclinic instability
(Hoskins and Valdes 1990). Previous studies have showed that the synoptic eddies, such as the
Northeast-China Cold Vortex at mid-high latitudes of East Asia in summertime, are closely responsible for
heavy rain over the northeastern and northern China (He et al. 2006; Zhou et al. 2020). The zonal wind
anomalies at 700-hPa (indicating the steering ow, Figure 4d) show that the westerlies over NEA are
increased. This enhanced steering ow is favorable to the local genesis and downstream propagation of
synoptic eddies to increase the rainfall in NEA. Therefore, the statistically signi cant relationship between
the anomalies of the summer precipitation in NEA and the late-spring soil moisture over North Eurasia is
linked with the dipole patterns of anomalous pressure, cyclonic/anticyclonic circulation and related water
vapor transport. In the following section, we will discuss the possible mechanisms by which the
preceding soil moisture anomalies can affect the summer circulation and rainfall in NEA.

4 Physical Mechanisms
Soil moisture could affect precipitation through both its local and nonlocal effects (Seneviratne et al.
2010; Li and Xue 2014; Li et al. 2016). In the case of local effects, the increase of soil moisture can lead
to increased evapotranspiration, including vegetation transpiration and surface evaporation, and thus an
increased supply of water vapor into atmosphere, which is conducive to the increase of precipitation at
local scale (Koster et al. 2003). For the nonlocal effects, the change of surface temperature in the
continental monsoon region caused by soil moisture variation would affect the thermal contrast between
land and ocean, and further modulate the large-scale monsoonal circulation associated precipitation
anomalies at larger scale (Zhang et al. 2016b). At these two different scales, the soil moisture anomalies
strongly affect atmosphere through changing surface heat uxes. Speci cally, wet soil leads to a higher
surface latent heat ux through evapotranspiration at the expense of the surface sensible heat ux, which
further affects the atmosphere above (Dirmeyer et al. 1999; Koster et al. 2003; Xue et al. 2004, 2006).
Thus, it is necessary to further investigate whether the summer atmospheric anomalies discussed above
are resulted from the changes in the thermal conditions caused by the effects of soil moisture on surface
heat uxes.

Figure 5a presents the North Eurasian soil moisture anomalies in JJA regressed against the minus soil
moisture index. The area from the West Siberian Plain to Central Siberian Plateau, including the key soil
moisture region, is featured with signi cantly negative soil moisture anomalies, which validates the
                                                  Page 7/25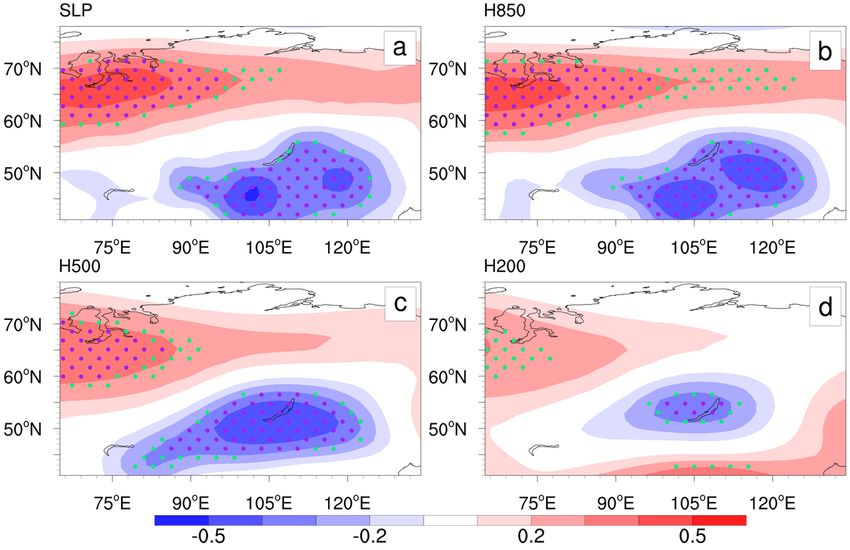
nding that the late-spring soil moisture signals could persist into the following summer. In addition, the
soil moisture indices of May and JJA are highly autocorrelated (r = 0.89, signi cant at the 0.05 level),
indicating that the memory is of seasonal scale.

Figures 5b and 5c show the North Eurasian JJA air temperature anomalies at the surface and at 2 m
height regressed against the minus soil moisture index, respectively. The whole of North Eurasia is
distinguished by a positively anomalous temperature in summer, especially the key soil moisture region,
illustrating that the negative soil moisture anomalies in May over North Eurasia are accompanied by the
increased lower-level air temperature at the high latitudes, and vice versa. The distributions of surface
heat uxes anomalies regressed against the minus soil moisture index are shown in Figure 6. Most of
North Eurasia is characterized by signi cantly negative latent heat ux anomalies in summer (Figure 6a).
This suggests that the persistent abnormally dry soil moisture signal from May to JJA could result in the
negative anomalies of latent heat uxes over the same key soil moisture region in summer, and vice
versa. The patterns of sensible heat ux anomalies also show clear features. Figure 6b shows
signi cantly positive sensible heat ux anomalies appear over nearly all of North Eurasia. The sign of
sensible heat ux anomalies is opposite to that of latent heat ux anomalies, which is consistent with the
 ndings of previous studies (Koster et al. 2006; Seneviratne et al. 2010). The positive sensible heat ux
anomalies will directly increase the air temperature at lower atmosphere layers above the key soil
moisture region, as shown by the air temperature in latitude-height section along 105°E in Figure 6c. The
increased air temperature in North Eurasia will lead to the decrease of meridional temperature gradient
between middle and high latitudes. Simultaneously, the cooling above the key precipitation region further
intensi es the decreased temperature gradient. As a result, according to the principle of thermal wind, the
zonal wind at lower levels north of NEA is weakened and present the character of an anomalous easterly
(Figure 6d). Such conditions can be favorable for the formation of a cyclonic circulation south of the
easterly where NEA is located (Figure 4a), leading to the dipole pattern of geopotential height over
Eurasia, which further increases the NEA summer rainfall. Previous studies have suggested that the
weakened zonal wind at middle and high latitudes favors the development and persistence of the
meridional component of atmospheric circulation in summer, such as blocking highs, which play a vital
role in enhancing rainfall in East Asia (Murray and Simmonds 1995; Tang et al. 2013; Yao et al. 2017;
Zhang et al. 2018). Therefore, by affecting the surface heat uxes, the soil moisture anomalies over North
Eurasia will in uence the lower-layer air temperature, followed by the meridional temperature gradient,
and nally the atmospheric circulation related to the Eurasian summer precipitation.

5 Model Experiments
In this section, we present an assessment of the in uences of the precedent soil moisture anomalies in
North Eurasia to the atmospheric circulation related to the NEA summer precipitation downstream and
investigate the associated physical processes establishing such connections using model experiments
conducted with the CESM 1.2.2. Three sets of experiments forced by prescribed climatological monthly-
mean SST and sea-ice concentration were performed. The control run (exp_CTL) was integrated for 50
model years and the rst 10 years were discarded for spin up. The high-soil moisture experiment
                                                  Page 8/25
(exp_HSM) and low-soil moisture experiment (exp_LSM) are two sets of sensitivity experiments used for
detecting the in uences of soil moisture anomalies in North Eurasia. The surface soil moisture anomalies
in each grid over the soil moisture key region (58°–72°N, 90°–123°E) were obtained by the maximum
minus the minimum of 40-year control run. The anomalies were added and subtracted onto the outputs
of exp_CTL, which are regarded as the initial conditions of exp_HSM and exp_LSM, respectively. For the
initial conditions of exp_HSM, if the values of soil moisture are larger than the maximum of the 40 model
years of exp_CTL, then they were assigned as the maximum. Similarly, in exp_LSM, zero was assigned to
all values less than zero. Each sensitivity experiment consisting of 40 ensemble members was integrated
from 1 May to 31 August. The responses of the model to the soil moisture anomalies are de ned as the
ensemble mean differences between exp_LSM and exp_HSM.
Figure 7 displays the ensemble mean differences in summer precipitation and atmospheric circulation
between exp_LSM and exp_HSM. Figure 7a shows that NEA is featured with positive anomalous rainfall.
Signi cantly negative SLP anomalies covering the area ranging from Mongolia to Northeast China are
favorable for positive rainfall anomalies (Figure 7b). At the same time, North Eurasia, which includes the
eastern part of the key soil moisture region, is characterized by heavy SLP. This the dipole pattern of
“positive in the north and negative in the south” is similar to the result in Section 3.2. At the height eld of
850 hPa (Figure 7c), although the range and intensity of simulated positive geopotential height over
North Eurasia tend to reduce, relative to the SLP pattern, NEA is still featured with signi cantly negative
anomalies contributing to the positive precipitation anomalies. The 850-hPa wind matches well with the
height eld (Figure 7d). A clear anticyclone anomaly appears above the key soil moisture region. In the
downstream region of the anomaly, there is a signi cant cyclonic shear circulation above NEA that will
enhance the convergence and upward motion at lower level and further promote the formation of positive
rainfall anomalies. The ensemble-mean difference of the vertically integrated water vapor uxes (Figure
7e) shows that NEA is a zone of signi cant convergence. The pattern of the divergence of vertically
integrated water vapor uxes clearly shows that the regions south of the Lake Baikal ranging from
Mongolia to Northeast China are characterized by signi cantly negative divergence anomalies (Figure 7f),
favoring the positive rainfall anomalies.
Figure 8a shows that the latent heat uxes over North Eurasia in summer simulated by exp_LSM are
signi cantly lower than that of exp_HSM. Contrary to the latent heat uxes, the responses of sensible
heat uxes indicate that the positive anomalies cover North Eurasia (Figure 8b) resulting in the increased
air temperature at lower atmosphere levels and the decreased meridional temperature gradient between
middle and high latitudes over Eurasia (Figure 8c) and leading to the weakened zonal wind in the middle
latitudes (Figure 8d). This anomalous easterly will generate the cyclonic shearing circulation above NEA
and then the dipole pattern spanning East Asia. Clearly, the results of the sensitivity experiments by the
CESM 1.2.2 are reasonably consistent with the main features of the observational diagnoses, which
validates to some degree our new ndings that the summer circulation anomalies related to the rainfall
anomalies in NEA can be in uenced by the late-spring soil moisture anomalies over North Eurasia.
Page 9/256 Summary And Discussions
In this study, we investigated the relation between the late-spring soil moisture over North Eurasia and
summer rainfall over NEA based on the observations and numerical model experiments. The SVD1
modes of NEA precipitation in summer and North Eurasian soil moisture in May with 66.2% of their
explained variance show that both of the elds depict the same sign of heterogeneous correlations in
their respective areas, which is very similar to the patterns of homogeneous correlations. In particular, the
soil moisture anomalies over the upstream regions in May show a signi cantly negative correlation with
the following summer rainfall anomalies over the regions from Mongolia to Northeast China.
Furthermore, the two extension coe cient time series corresponding to SVD1, which reveal nearly
consistent interannual and decadal variations with each other, are highly correlated with the coe cient of
0.71. The late-spring soil moisture index and summer precipitation index calculated by the method of
box-average, are also negatively correlated (r = −0.72). We further found that the late-spring negative soil
moisture anomalies over North Eurasia are associated with the dipole mode of geopotential height
pattern over the whole of East Asia in summer: the key region of soil moisture is occupied by above-
normal pressure, and the key region of precipitation is covered by lower pressure anomalies that favor the
formation of the positive rainfall anomalies. Concurrently, 850-hPa wind displays signi cant cyclone
anomalies that could enhance the convergence movement to boost the rainfall over NEA. The water
vapor uxes show two signi cant water vapor transport channels to the key region related to
precipitation. At the same time, the background circulation anomalies related to the abnormal soil
moisture will also in uence the baroclinic instability and the synoptic activity, then affecting the rainfall
anomaly distribution. Hence, the related conditions of circulation lead by abnormal upstream dryer
(wetter) soil will enhance (decrease) the precipitation over NEA.
Upon further analysis, we identi ed the mechanism by which soil moisture anomalies can generate the
appropriate atmospheric circulation that affects the downstream precipitation. We found that the
abnormal soil moisture signal in May will persist into the following summer and consistently in uence
the surface heat uxes. In particular, the dryer soil in North Eurasia will lead to the negative latent heat
ux anomalies and positive sensible heat ux anomalies. Correspondingly, the increased air temperature
in the lower atmosphere layers will narrow the meridional temperature gradient between middle and high
latitudes, then promote the anomalous easterly and generate the cyclonic circulation over NEA and nally
generate the dipole pattern favorable for the positive precipitation anomalies in NEA. The cooling effect
of the increased rainfall further decreases the meridional temperature gradient and promotes this cyclic
process. The in uences of the wetter soil are vice versa. Thus, changes to the thermal conditions by
affecting the heat uxes are a vital pathway by which soil moisture in uences the atmospheric
circulation. The physical processes discussed above are summarized in Figure 9.
The results of the ensemble mean differences between the exp_LSM and exp_HSM are reasonably
consistent with those of observational diagnoses, except that the high-pressure systems are not
signi cant at higher levels and the positions of circulation center lean toward the south. By analyzing the
climatology, we found that the relatively lower pressure and the more southerly located wind systems in
Page 10/25the model simulation ( gure not shown) may lead to the situations above. In general, the simulated
atmospheric circulation responding to the precedent low-soil moisture anomalies in late spring shows
that NEA is occupied by abnormally low pressure and convergence motions promoting the positive
rainfall anomalies in summer. The abnormally dry soil in May is accompanied by negative latent heat
and positive sensible heat ux anomalies. Subsequently, the increased air temperature in North Eurasia
will decrease the meridional temperature gradient between middle and high latitudes and further generate
the anomalous easterly north of NEA in uencing the meridional atmospheric motion in Eurasia. In
conclusion, both of the observational diagnoses and the model sensitivity experiments show that the
preceding soil moisture anomalies over North Eurasia play a vital role in affecting the large-area
atmospheric circulation and further in uence the summer precipitation downstream.
However, it is still not clear how the synoptic eddy activity could contribute to the seasonal-scale
precipitation in NEA and related atmospheric circulation though we have observed some results that the
background steering ow and baroclinity changes induce variations of synoptic storm/eddy activity. This
question is de nitely important to deeply understand formation dynamics of the NEA cyclonic anomaly
circulation as excited by prior external factors such as soil moisture, and worthy of further studies on the
next step in terms of the scale interaction paradigm between synoptic eddy and seasonal-mean ow (e.g.,
Ren et al. 2011, 2014).
The prediction of summer rainfall over East Asia has been a major issue in short-range climate prediction.
Moreover, the forecasting accuracy of summer precipitation in NEA, especially in Northeast China, is
relatively poor and has even been contrary to the actual situation in recent years (Sun et al. 2017; Zhao et
al. 2020). In this study, from the perspective of land factors, we found observational evidence of a linkage
between summer precipitation anomalies over NEA and late-spring soil moisture anomalies over the
upstream region and con rmed these by performing numerical model experiments. The results provide a
base for improving short range climate forecasts of summer rainfall over East Asia. However, the mid-
high-latitude precipitation is usually affected by multiple local and remote factors. Exploration and
research are needed to further quantify the amount of rainfall that can be explained by land factors such
as soil moisture and surface temperature.
Declarations
Acknowledgements.
This work was supported by the National Key Research and Development Program of China (Grant
no.2018YFC1506000).
References
1. Balsamo G, Albergel C, Beljaars A, Boussetta S, Brun E, Cloke H, Dee D, Dutra E, Muñoz-Sabater J,
Pappenberger F, de Rosnay P, Stockdale T, Vitart F (2015) ERA-Interim/Land: a global land surface
Page 11/25reanalysis data set. Hydrol Earth Syst Sci 19:389–407. https://doi.org/10.5194/hess-19-389-2015
2. Chahine MT (1992) The hydrological cycle and its in uence on climate. Nature 359:373–380.
https://doi.org/10.1038/359373a0
3. Dai A, Trenberth KE, Karl TR (1999) Effects of clouds, soil moisture, precipitation, and water vapor on
diurnal temperature range. J Clim 12:2451–2473. https://doi.org/10.1175/1520-
0442(1999)0122.0.CO;2
4. Dai CY, Zuo ZY (2010) Relationship between previous winter and spring soil moisture and summer
climate in eastern China. Meteorol Sci Technol 38:300–305. https://doi.org/10.19517/j.1671-
6345.2010.03.005 (in Chinese)
5. Dash SK, Singh GP, Shekhar MS (2005) Response of the Indian summer monsoon circulation and
rainfall to seasonal snow depth anomaly over Eurasia. Clim Dyn 24:1–10.
https://doi.org/10.1007/s00382-004-0448-3
. Ding Y, Chan JCL (2005) The East Asian summer monsoon: an overview. Meteorol Atmos Phys
89:117–114. https://doi.org/10.1007/s00703-005-0125-z
7. Dirmeyer PA, Brubaker KL (1999) Contrasting evaporative moisture sources during the drought of
1988 and the ood of 1993. J Geophys Res 104:19383–19397.
https://doi.org/10.1029/1999JD900222
. Dirmeyer PA, Schlosser CA, Brubaker KL (2009) Precipitation, recycling, and land memory: an
integrated analysis. J Hydrometeor 10:278–288. https://doi.org/10.1175/2008JHM1016.1
9. Eady ET (1949) Long waves and cyclone waves. Tellus 1(3):33–52.
https://doi.org/10.3402/tellusa.v1i3.8507
10. Eaton BE (2010) User’s Guide to the Community Atmosphere Model AM4.0, Technical report, National
Center for Atmospheric Research, Boulder, Colorado.
http://www.ccsm.ucar.edu/models/ccsm4.0/cam/docs/users_guide/book1.html
11. Hoskins BJ, Valdes PJ (1990). On the existence of storm-tracks, Journal of Atmospheric Sciences,
47(15), 1854–1864. https://doi.org/10.1175/1520-0469(1990)0472.0.CO;2
12. Kanamitsu M, Ebisuzaki W, Woollen J, Yang S, Hnilo JJ, Fiorino M, Potter GL (2002) NCEP–DOE
AMIP-II Reanalysis (R-2). Bull Amer Meteor Soc 83:1631–1644. https://doi.org/10.1175/BAMS-83-
11-1631
13. Kim JE, Hong SY (2007) Impact of soil moisture anomalies on summer rainfall over East Asia: a
regional climate model study. J Clim 20:5732–5743. https://doi.org/10.1175/2006JCLI1358.1
14. Koster RD, Suarez MJ (2001) Soil moisture memory in climate models. J Hydrometeor 2:558–570.
https://doi.org/10.1175/1525-7541(2001)0022.0.CO;2
15. Koster RD, Suarez MJ, Higgins W, Van den Dool HM (2003) Observational evidence that soil moisture
variations affect precipitation. Geophys Res Lett. https://doi.org/10.1029/2002GL016571
1 . Koster RD et al (2004) Regions of strong coupling between soil moisture and precipitation. Science
305:1138–1140. https://doi.org/10.1126/science.1100217
Page 12/2517. Koster RD et al (2006) GLACE: The Global Land–Atmosphere Coupling Experiment. Part I: Overview.
J Hydrol 7:590–610
1 . Lawrence DM et al (2011) Parameterization improvements and functional and structural advances in
version 4 of the Community Land Model. J Adv Model Earth Sys.
https://doi.org/10.1029/2011MS000045
19. Li Q, Xue Y (2014) The observed and simulated major summer climate features in northwest China
and their sensitivity to land surface processes. J Meteorol Res 28:836–848.
https://doi.org/10.1007/s13351-014-4010-x
20. Li W, Guo W, Xue Y, Fu C, Qiu B (2016) Sensitivity of a regional climate model to land surface
parameterization schemes for East Asian summer monsoon simulation. Clim Dyn 47:2293–2308.
https://doi.org/10.1007/s00382-015-2964-8
21. Murray RJ, Simmonds I (1995) Responses of climate and cyclones to reductions in Arctic sea ice. J
Geophys Res 100:4791–4806. https://doi.org/10.1029/94JC02206
22. North GR, Bell TL, Cahalan RF, Moeng FJ (1982) Sampling errors in the estimation of empirical
orthogonal functions. Mon Wea Rev 110:699–706. https://doi.org/10.1175/1520-
0493(1982)1102.0.CO;2
23. Ren HL, Jin FF, Kug JS (2014) Eddy-induced growth rate of low-frequency variability and its mid- to
late winter suppression in the Northern Hemisphere. J Atmos Sci 71(7):2281–2298.
https://doi.org/10.1175/JAS-D-13-0221.1
24. Ren HL, Jin FF, Kug JS, Gao L (2011) Transformed eddy-PV ux and positive synoptic eddy feedback
onto low-frequency ow. Clim Dyn 36:2357–2370. https://doi.org/10.1007/s00382-010-0913-0
25. Rodell M et al (2004) The Global Land Data Assimilation System. Bull Amer Meteor Soc 85:381–394.
https://doi.org/10.1175/BAMS-85-3-381
2 . Ruosteenoja K, Markkanen T, Venäläinen A, Räisänen P, Peltola H (2018) Seasonal soil moisture and
drought occurrence in Europe in CMIP5 projections for the 21st century. Clim Dyn 50:1177–1192.
https://doi.org/10.1007/s00382-017-3671-4
27. Sato T, Nakamura T (2019) Intensi cation of hot Eurasian summers by climate change and land–
atmosphere interactions. Sci Rep 9:10866. https://doi.org/10.1038/s41598-019-47291-5
2 . Seneviratne SI, Lüthi D, Litschi M, Schär C (2006) Land–atmosphere coupling and climate change in
Europe. Nature 443:205–209. https://doi.org/10.1038/nature05095
29. Seneviratne SI, Corti T, Davin EL, Hirschi M, Jaeger EB, Lehner I, Orlowsky B, Teuling AJ (2010)
Investigating soil moisture–climate interactions in a changing climate: a review. Earth Sci Rev
99:125–161. https://doi.org/10.1016/j.earscirev.2010.02.004
30. Shi P et al (2021) Signi cant land contributions to interannual predictability of East Asian summer
monsoon rainfall. Earth’s Future. https://doi.org/10.1029/2020ef001762
31. Shinoda M (2001) Climate memory of snow mass as soil moisture over central Eurasia. J Geophys
Res Atmos 106:393–403. https://doi.org/10.1029/2001JD000525
Page 13/2532. Shukla J, Mintz Y (1982) The in uence of land-surface evaporation precipitation on earth’s climate.
Science 215:1498–1501
33. Sospedra-Alfonso R, Merry eld WJ (2018) Initialization and potential predictability of soil moisture in
the Canadian seasonal to interannual prediction system. J Clim 31:5205–5224.
https://doi.org/10.1175/JCLI-D-17-0707.1
34. Sun L, Shen BZ, Sui B, Huang B (2017) The in uences of East Asian monsoon on summer
precipitation in Northeast China. Clim Dyn 48:1647–1659. https://doi.org/10.1007/s00382-016-
3165-9
35. Takaya K, Nakamura H (2001) A formulation of a phase-independent wave-activity ux for stationary
and migratory quasigeostrophic eddies on a zonally varying basic ow. J Atmos Sci 58:608–627.
https://doi.org/10.1175/1520-0469(2001)0582.0.CO;2
3 . Tang QH, Zhang XJ, Yang XH, Francis JA (2013) Cold winter extremes in northern continents linked
to Arctic sea ice loss. Environ Res Lett 8:014036. https://doi.org/10.1088/1748-9326/8/1/014036
37. Wallace JM, Smith C, Bretherton CS (1992) Singular value decomposition of wintertime sea surface
temperature and 500-mb height anomalies. J Clim 5:561–576. https://doi.org/10.1175/1520-
0442(1992)0052.0.CO;2
3 . Wu LY, Zhang JY (2013) Role of land–atmosphere coupling in summer droughts and oods over
eastern China for the 1998 and 1999 cases. Chin Sci Bull 58:3978–3985.
https://doi.org/10.1007/s11434-013-5855-6
39. Von Storch H, Zwiers FZ (1999) Statistical analysis in climate research. Cambridge University Press,
New York
40. Wang B (2006) The Asian monsoon. Springer/Praxis Publishing Co.
https://www.springer.com/gp/book/9783540406105
41. Wang S, Wang S, Feng J (2016) Drought events and their in uence in 2015 in China. J Arid Meteorol
34:382–389 (in Chinese)
42. Wu W, Dickinson RE (2004) Time scales of layered soil moisture memory in the context of land–
atmosphere interaction. J Clim 17:2752–2764. https://doi.org/10.1175/1520-
0442(2004)0172.0.CO;2
43. Xie P, Arkin PA (1997) Global precipitation: a 17-year monthly analysis based on gauge observations,
satellite estimates and numerical model outputs. Bull Amer Meteor Soc 78:539–2,558.
https://doi.org/10.1175/1520-0477(1997)0782.0.CO;2
44. Xue Y, Juang HMH, Li WP, Prince S, DeFries R, Jiao Y, Vasic R (2004) Role of land surface processes
in monsoon development: East Asia and West Africa. J Geophys Res 109:D03105.
https://doi.org/10.1029/2003JD003556
45. Xue Y, de Sales F, Li WP, Mechoso CR, Nobre CA, Juang HM (2006) Role of land surface processes in
South American Monsoon development. J Clim 19:741–762. https://doi.org/10.1175/JCLI3667.1
4 . Xue Y et al (2018) Spring land surface and subsurface temperature anomalies and subsequent
downstream late spring-summer droughts/ oods in North America and East Asia. J Geophys Res
Page 14/25Atmos 123:5001–5019. https://doi.org/10.1029/2017JD028246
47. Yang S, He L (2013) Analysis of atmosphere circulation and weather in August 2013. Meteorological
Monthly 39:1521–1528. (in Chinese)
4 . Yao Y, Luo D, Dai A, Simmonds I (2017) Increased quasi stationarity and persistence of winter Ural
blocking and Eurasian extreme cold events in response to Arctic warming. Part I: insights from
observational analyses. J Clim 30:3549–3568. https://doi.org/10.1175/JCLI-D-16-0261.1
49. Yeh T, Wetherald RT, Manabe S (1984) The effect of soil moisture on the short-term climate and
hydrology change—A numerical experiment. Mon Wea Rev 112:474–490.
https://doi.org/10.1175/1520-0493(1984)1122.0.CO;2
50. Zhang RH, Zuo ZY (2011) Impact of spring soil moisture on surface energy balance and summer
monsoon circulation over East Asia and precipitation in East China. J Clim 24:3309–3322.
https://doi.org/10.1175/2011JCLI4084.1
51. Zhang RH, Liu L, Zuo ZY (2016a) Variations of soil moisture over China and their in uences on
Chinese climate. Chinese Journal of Nature 38:313–319. (In Chinese)
52. Zhang R, Sun C, Zhang R, Jia L, Li WJ (2018) The impact of Arctic sea ice on the interannual
variations of summer Ural blocking. Int J Climatol 38:4632–4650. https://doi.org/10.1002/joc.5731
53. Zhang SW, Liu Y, Cao BJ, Li SY (2016b) Soil moisture–precipitation coupling and trends in China,
based on GLDAS and CMIP5 products. Clim Environ Res 21:188–196. (In Chinese)
54. Zhao JH, Xiong KG, Chen LJ (2020) The causes of low predictive skills of precipitation in ood
season in Northeast China. Chin J Atmos Sci 44:913–934. (in Chinese)
55. Zhou F, Ren HL, Hu ZZ, Liu MH, Wu J, Liu CZ (2020) Seasonal predictability of primary East-Asian
summer circulation patterns by three operational climate prediction models. Quarterly J R Meteorol
Soc 145:1089–1101. https://doi.org/10.1002/qj.3697
5 . Zhou T, Zou L (2010) Understanding the predictability of East Asian Summer Monsoon from the
reproduction of land–sea thermal contrast change in AMIP-Type simulation. J Clim 23:6009–6026.
https://doi.org/10.1175/2010JCLI3546.1
57. Zuo ZY, Zhang RH (2007) The spring soil moisture and the summer rainfall in eastern China. Chin Sci
Bull 52:3310–3312. https://doi.org/10.1007/s11434-007-0442-3
Figures
Page 15/25Figure 1
JJA-mean precipitation anomalies (unit: mm/day) over NEA and soil moisture anomalies (unit: m3/m3)
in May over North Eurasia in (a, c) 2013 and (b, d) 2015, respectively. Values that are statistically
signi cant at the 90% con dence level are indicated by green dots. Note: The designations employed and
the presentation of the material on this map do not imply the expression of any opinion whatsoever on
the part of Research Square concerning the legal status of any country, territory, city or area or of its
authorities, or concerning the delimitation of its frontiers or boundaries. This map has been provided by
the authors.
Page 16/25Figure 2
The spatial distributions of SVD1 (a, c) homogeneous correlations and (b, d) heterogeneous correlations
of soil moisture in May over North Eurasia and JJA-mean precipitation over NEA, respectively; (e)
Normalized time series of the two variables in SVD1 and (f) time series of the precipitation and minus soil
moisture indices with the blue and red lines denoting their 5-year running means. Red and blue boxes in
the maps denote the key regions of soil moisture (58°N–72°N, 90°E–123°E) and precipitation (45°N–
51°N, 107°E–130°E), respectively. Values that are statistically signi cant at the 90% and 95% con dence
levels are indicated by green and purple dots, respectively. Note: The designations employed and the
presentation of the material on this map do not imply the expression of any opinion whatsoever on the
part of Research Square concerning the legal status of any country, territory, city or area or of its
authorities, or concerning the delimitation of its frontiers or boundaries. This map has been provided by
the authors.
Page 17/25Figure 3
JJA-mean atmospheric circulation anomalies in (a) SLP (unit: Pa); (b, c, d) geopotential heights at 850,
500 and 200 hPa (units: gpm), respectively, derived from regressions against the minus soil moisture
index. Values that are statistically signi cant at the 90% and 95% con dence levels are indicated by green
and purple dots, respectively. Note: The designations employed and the presentation of the material on
this map do not imply the expression of any opinion whatsoever on the part of Research Square
concerning the legal status of any country, territory, city or area or of its authorities, or concerning the
delimitation of its frontiers or boundaries. This map has been provided by the authors.
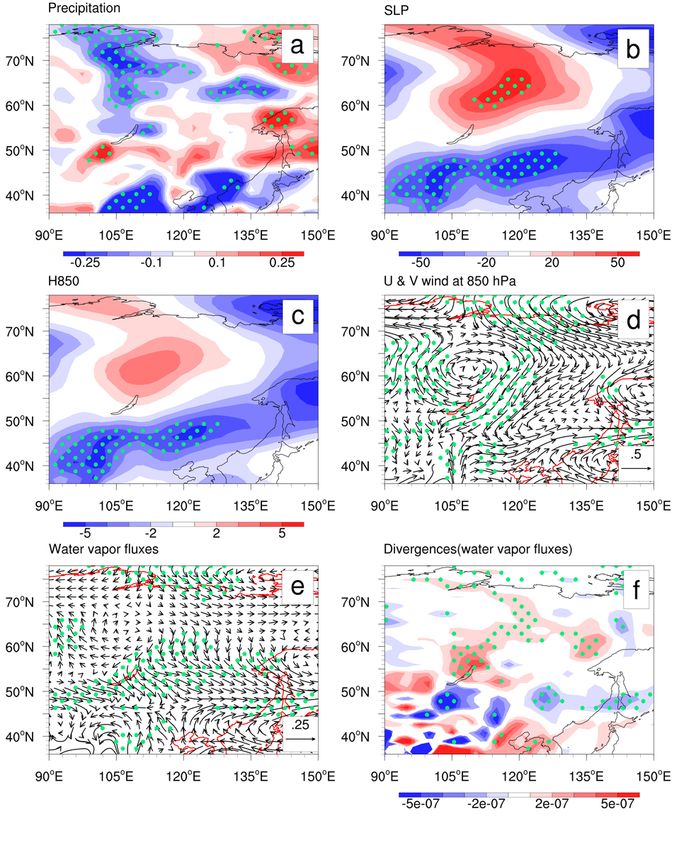
Page 18/25Figure 4
(a) JJA-mean anomalies of U & V wind at 850 hPa (unit: m/s); (b) JJA-mean anomalies of vertically
integrated water vapor uxes (unit: kg/m/s), derived from regressions against the minus soil moisture
index. (c) Differences of the summer synoptic-scale meridional wind variance at 850 hPa between low-
soil moisture years and high-soil moisture years. (d) Eady growth rate (unit: 10-6 s-1) at 850-hPa in
summer; and (e) JJA-mean anomalies of zonal wind at 700 hPa (unit: m/s), derived from regressions
Page 19/25against the minus soil moisture index. Values that are statistically signi cant at the 90% and 95%
con dence levels are indicated by green and purple dots, respectively. Note: The designations employed
and the presentation of the material on this map do not imply the expression of any opinion whatsoever
on the part of Research Square concerning the legal status of any country, territory, city or area or of its
authorities, or concerning the delimitation of its frontiers or boundaries. This map has been provided by
the authors.
Figure 5
Page 20/25JJA-mean anomalies of (a) soil moisture (unit: m3/m3); (b, c) air temperatures at the surface and at 2 m
height (units: °C), respectively, derived from regressions against the minus soil moisture index. Values
that are statistically signi cant at the 90% and 95% con dence levels are indicated by green and purple
dots, respectively. Note: The designations employed and the presentation of the material on this map do
not imply the expression of any opinion whatsoever on the part of Research Square concerning the legal
status of any country, territory, city or area or of its authorities, or concerning the delimitation of its
frontiers or boundaries. This map has been provided by the authors.
Page 21/25Figure 6
JJA-mean anomalies of (a, b) surface latent and sensible heat uxes (units: W/m2), respectively; (c) air
temperature in the latitude–height section along 105°E (unit: °C); and (d) zonal wind at 850-hPa (unit:
m/s), derived from regressions against the minus soil moisture index. Values that are statistically
signi cant at the 90% and 95% con dence levels are indicated by green and purple dots, respectively.
Note: The designations employed and the presentation of the material on this map do not imply the
expression of any opinion whatsoever on the part of Research Square concerning the legal status of any
country, territory, city or area or of its authorities, or concerning the delimitation of its frontiers or
boundaries. This map has been provided by the authors.
Page 22/25Figure 7
The simulated ensemble-mean difference patterns in summer between the exp_LSM and exp_HSM in (a)
precipitation (unit: mm/day) (b) SLP (unit: Pa); (c) 850-hPa height (unit: gpm); (d) U & V wind at 850-hPa
(unit: m/s); (e) vertically integrated water vapor uxes (unit: kg/m/s) and (f) divergences of the vertically
integrated water vapor uxes (unit: kg/s). Values that are statistically signi cant at the 90% con dence
level are indicated by green dots. Note: The designations employed and the presentation of the material
Page 23/25on this map do not imply the expression of any opinion whatsoever on the part of Research Square
concerning the legal status of any country, territory, city or area or of its authorities, or concerning the
delimitation of its frontiers or boundaries. This map has been provided by the authors.
Figure 8
The simulated ensemble-mean difference patterns in summer between the exp_LSM and exp_HSM in (a,
b) surface latent and sensible heat uxes (units: W/m2), respectively; (c) air temperature at 850 hPa (unit:
°C); and (d) zonal wind at 850 hPa (unit: m/s). Values that are statistically signi cant at the 90%
Page 24/25con dence level are indicated by green dots. Note: The designations employed and the presentation of
the material on this map do not imply the expression of any opinion whatsoever on the part of Research
Square concerning the legal status of any country, territory, city or area or of its authorities, or concerning
the delimitation of its frontiers or boundaries. This map has been provided by the authors.
Figure 9
Schematic diagram depicting the physical processes responsible for the in uence of the late-spring soil
moisture over North Eurasia on the subsequent summer precipitation over NEA.
Page 25/25You can also read