Fine mapping of the major QTLs for biochemical variation of sulforaphane in broccoli florets using a DH population
←
→
Page content transcription
If your browser does not render page correctly, please read the page content below
www.nature.com/scientificreports
OPEN Fine mapping of the major
QTLs for biochemical variation
of sulforaphane in broccoli florets
using a DH population
Zhansheng Li *, Yumei Liu, Suxia Yuan, Fengqing Han, Zhiyuan Fang, Limei Yang,
Mu Zhuang, Yangyong Zhang, Honghao Lv, Yong Wang & Jialei Ji
Glucoraphanin is a major secondary metabolite found in Brassicaceae vegetables, especially
broccoli, and its degradation product sulforaphane plays an essential role in anticancer. The fine
mapping of sulforaphane metabolism quantitative trait loci (QTLs) in broccoli florets is necessary for
future marker-assisted selection strategies. In this study, we utilized a doubled haploid population
consisting of 176 lines derived from two inbred lines (86,101 and 90,196) with significant differences in
sulforaphane content, coupled with extensive genotypic and phenotypic data from two independent
environments. A linkage map consisting of 438 simple sequence repeats markers was constructed,
covering a length of 1168.26 cM. A total of 18 QTLs for sulforaphane metabolism in broccoli florets
were detected, 10 were detected in 2017, and the other 8 were detected in 2018. The LOD values
of all QTLs ranged from 3.06 to 14.47, explaining 1.74–7.03% of the biochemical variation between
two years. Finally, 6 QTLs (qSF-C3-1, qSF-C3-2, qSF-C3-3, qSF-C3-5, qSF-C3-6 and qSF-C7) were
stably detected in more than one environment, each accounting for 4.54–7.03% of the phenotypic
variation explained (PVE) and a total of 30.88–34.86% of PVE. Our study provides new insights
into sulforaphane metabolism in broccoli florets and marker-assisted selection breeding in Brassica
oleracea crops.
Abbreviations
DH Doubled haploid
QTLs Quantitative trait loci
BIP Biparental populations
ICIM Inclusive composite interval mapping
SSR Simple sequence repeats
ESTs Expressed sequence tags
cM Centimorgan
LOD Logarithm of odds
PVE Phenotypic variation explained
B. oleracea Brassica oleracea
SF Sulforaphane
GRA Glucoraphanin
GLS Glucosinolate
PRO Progoitrin
NAP Gluconapin
GER Glucoerucin
GBS Glucobrassicin
OHGBS 4-Hydroxyglucobrassicin
NeoGBS Neoglucobrassicin
GBN Glucobrassicanapin
SIN Sinigrin
GIV Glucoiberverin
Key Laboratory of Biology and Genetic Improvement of Horticultural Crops, Ministry of Agriculture, Institute of
Vegetables and Flowers, Chinese Academy of Agricultural Sciences, Beijing, China. *email: lizhansheng@caas.cn
Scientific Reports | (2021) 11:9004 | https://doi.org/10.1038/s41598-021-88652-3 1
Vol.:(0123456789)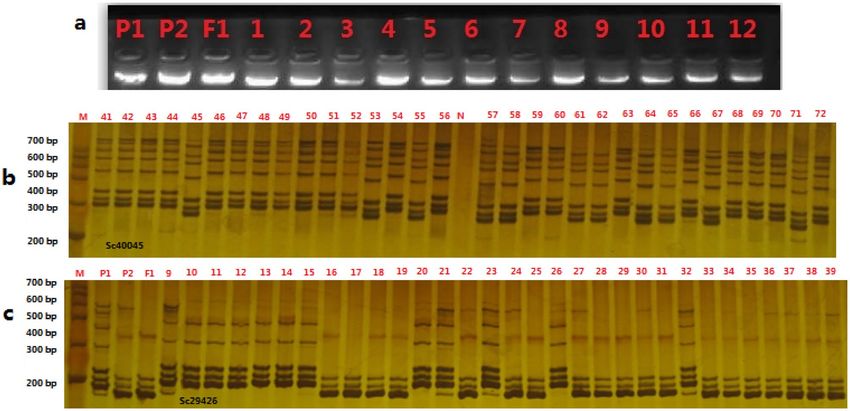
www.nature.com/scientificreports/
GIB Glucoiberin
ALY Glucoalyssin (ALY)
GST Gluconasturtiin
Ali-GLS Aliphatic glucosinolates
indolic GLS Indolic glucosinolates
Aro-GLS Aromatic glucosinolate
MY Myrosinase
ESP Epithiospecifier protein
CTAB Hexadecyl trimethyl ammonium bromide
CV Coefficients of variation
Add Additive effect
Broccoli (Brassica oleracea var. italica), a member of Brassicaceae, is a popular vegetable that is rich in many
nutrients, such as fiber, vitamin C, and proteins. Broccoli can reduce the risk of cancer and heart disease by
decreasing cell damage, reducing inflammation, and protecting against chronic disease. Sulforaphane (SF) plays
a key role in anticancer activities by inducing the Nrf-2 pathway and triggering the release of antioxidants and
detoxifiers known as phase II e nzymes1. SF is the second product of glucoraphanin (GRA), which is found in
Brassica oleracea (B. oleracea) vegetables such as broccoli, kale (Brassica oleracea var. acephala f. tricolor), cabbage
(Brassica oleracea var. capitata), Chinese kale (Brassica oleracea var. alboglabra), and kohlrabi (Brassica oleracea
var. caulorapa), and is particularly abundant in b roccoli2,3.
SF is the hydrolysis product of GRA and belongs to the aliphatic glucosinolates (GLS). When broccoli sprouts
are consumed, GRA contained in vacuoles within the cytoplasm of plant cells is released and converted into SF via
myrosinase (MY) located in the c ytosol4. MYs are thioglucosidases (thioglucoside glucohydrolases, EC 3.2.1.147)
that catalyze the initial step of the bioactivation of G LS5. MYs are usually composed of two identical 55–65 kDa
polypeptides that are heavily glycosylated, resulting in a native molecular weight of the dimeric proteins of
120–150 kDa. MY have been characterized in Arabidopsis thaliana (AtTGG1-AtTGG6), Brassica napus (MA,
MB and MC) and B. oleracea (broccoli and cabbage) and are classified into MY I (MA, MB, MC, AtTGG1-3)
or MY II enzymes (AtTGG4 and 5 and others)5–9. Distinct patterns of expression suggest that the different
MY enzymes may play different roles, such as showing differences in substrate specificity, since glucosinolate
expression in the roots and above-ground tissue is different but overlapping in many s pecies10–12. Most factors
modifying glucosinolate hydrolysis affect either MY activity and specificity or the activity of the epithiospecifier
protein (ESP), which is a very labile protein, in marked contrast to MY. Low concentrations of ascorbic acid
and zinc ions can increase MY activity in broccoli and cabbage, while high concentrations of copper ions and
magnesium ions decrease the yields of SF, but ferrous ions and ferric ions inhibit the formation of S F9,13,14. The
amino acid sequence of broccoli MY has been elucidated (Acc. Nr.; MF461331), showing that the subunits have
a molecular mass of 50–55 kDa, while the native molecular mass of MY is 157 k Da15,16. Therefore, the activity of
broccoli MY in different organs can directly affect the recovery rate and yields of S F17,18.
GLS have been a topic of agricultural research for more than a century, which was initially often focused
on adverse effects in animals fed concentrated crucifer-based feeds. However, there has recently been renewed
interest in these compounds responsible for cancer prevention through the consumption of cruciferous vegeta-
bles. There are nearly 120 identified GLS from 16 families of angiosperms, including Brassicaceae, Capparaceae,
Tovariaceae, and C aricaceae19,20. Interestingly, glucosinolate profiles vary widely between species and between
varieties. The distribution of GLS frequently differs both qualitatively and quantitatively among plant parts (roots,
leaves, sprouts, seeds, seedlings, etc.)21–23. GLS show great differences among different organs20,22,24. Therefore,
the glucosinolate content depends not only on the genotype but also on the growing e nvironment2,25. In previous
reports, it has been indicated that glucosinolate content is mainly determined by genotype and the interaction
between genotype and environment. Most of the known structural genes involved in glucosinolate metabolism
have been identified and functionally characterized in Arabidopsis thaliana26–28. There are three stages in the bio-
synthesis of GLS: the side-chain elongation of amino acids, the development of the core structure, and secondary
side-chain modifications. GLS are usually categorized into three classes based on the structure of their different
amino acid precursors: aliphatic GLS, indole GLS, and aromatic GLS. The core pathway has been described on the
basis of studies conducted mainly in Arabidopsis, and side-chain elongation and modification strongly influence
the bioactivities of glucosinolate breakdown products26. The evolution and ecological relevance of glucosinolate
variation were also reviewed in 200529.
Broccoli is popularly reported to be high in SF, but different organs and tissues of broccoli show different
levels of SF, which indicates the diversity of SF metabolism in different organs and developmental stages. To
date, few reports have provided insight into the functional genes or loci related to explaining the differences in
SF content in broccoli florets. One study revealed QTLs related to glucosinolate synthesis in B. oleracea plants
based on a double haploid (DH) population derived from a cross between a DH rapid cycling line of Chinese
kale and the DH ‘Early Big’ broccoli line30. There have been no reports of QTL mapping for SF metabolism in
broccoli florets to date. Therefore, the mapping of QTLs responsible for the differences in SF metabolism in dif-
ferent environments will be helpful to better understand the relationships among the environment, MY activity
and SF content in broccoli.
Results
Biochemical variation. Different SF contents were detected in the parental lines 86,101 ( P1) and 90,196
(P2), and this difference was significant (1.37 mg/kg DW versus 37.49 mg/kg FW, respectively) (p < 0.05)
(Fig. 1A). More importantly, there was a significant difference in the SF contents of the florets, and this popula-
Scientific Reports | (2021) 11:9004 | https://doi.org/10.1038/s41598-021-88652-3 2
Vol:.(1234567890)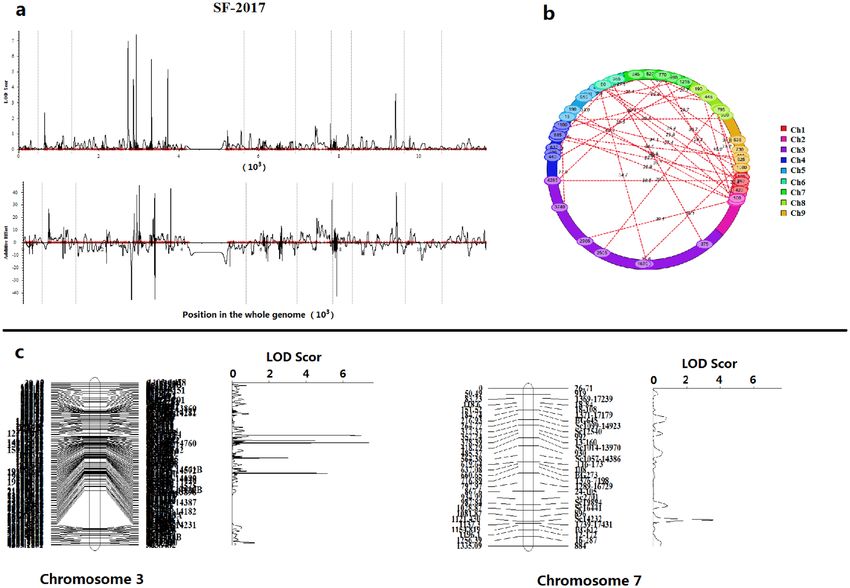
www.nature.com/scientificreports/
Figure 1. Biochemical variationof SF contents in the 86,101 and 90,196 lines and their hybrid ( F1) (A). The
lowercase letters indicate the significant differences in SF contents between the two parents and their hybrid F
1
at p < 0.05. Frequency histogram of SF contents distributed in the DH population between 2017 (B) and 2018
(C).
1st order genetic parameter 2nd order genetic parameter
Year m da db dc iab iac ibc iabc σp2 σmg2 σpg2 σe2 hmg2 (%) hpg2 (%)
2017 57.91 24.37 − 7.16 7.18 − 13.52 0.81 − 30.38 − 23.98 2276.53 2037.49 58.79 184.99 88.69 3.27
2018 59.54 23.88 − 7.02 7.58 − 14.01 0.76 − 29.19 − 23.35 2268.32 2039.65 58.12 185.31 89.01 2.86
Table 1. Estimates of genetic parameters for SF contents in both years based on G-1 model. m,
Mean; da, db and dc, Additive effects of the first, second and third major genes; iab, iac, ibc, and iabc, The epistatic
effect of additive × additive between two and three major genes; σp2, Phenotypic variance; σpg2, Polygenic
variance; σmg2, Major gene variance; σe2, Environmental variance; hmg2(%), Major gene heritability; hpg2(%),
Polygenic heritability.
tion was suitable for constructing a permanent F 1 DH population including 176 lines for the mapping of QTLs
for SF metabolism in broccoli (Fig. 1).The DH family showed differences in the distribution in florets depending
on genotype, and the coefficients of variation ranged from 0 to 0.20 and 0 to 0.14 in 2017 and 2018, respectively
(Fig. 1B,C).
In our previous studies, analysis of variance (ANOVA) revealed significant differences (p < 0.01) in SF con-
tents among DH plants in both 2017 (2.03 to 183.27 mg/kg FW) and 2018 (2.17 to 187.97 mg/kg FW), which
indicated the existence of heritable variation. And meanwile, there existed segregation distortion and over-parent
heterosis in the DH family, thus, the suitability of the DH population for genetic analysis. Significant variance
of SF in the DH population was observed at p < 0.01 level. This result demonstrated that biochemical variation
of SF contents was mainly under control of genetic factors and that climate might also play a role. Additionally,
the Pearson correlation test was applied to the DH family, with a correlation coefficient ranging from 0.93 to
0.98 (p < 0.01). The data showed that there was a significant correlation between 2017 and 2018. The ranges and
coefficients of variation (CV/%) among the DH population were greater than those in the P 1 (1.20–1.66%), P
2
(1.57–3.51%), and F1 (0.78–2.22%) populations, suggesting the existence of real variations in heredity and more
genetic polymorphisms in the DH populations, which laid a good foundation for the subsequent genetic analysis.
The frequency distribution of SF contents in the DH population showed a continuous distribution and was
difficult to group, suggesting that the SF content trait in broccoli is quantitative.
Mixed major gene plus polygene inheritance analysis. A total of 38 specific models were obtained
by IECM estimation in both two years, and three candidate models were selected by following the smaller AIC
criterion (Table S1). According to fitness tests of χ2 uniformity test, Smirnov’s test, and Kolmogorov’s test, the
G-1 model was seleted as optimal genetic model for SF contents in 2017 and 2018. In G-1 model, biochemical
variation of sulforaphane was controlled by three major genes plus polygenes with addictive effect and epistatic
effect. The genetic parameters of the optimal model were calculated using the least squares method (Table 1). In
2017 and 2018, the mean values of SF content were 57.91 mg/kg FW and 59.32 mg/kg FW, respectively. The addi-
tive effects of two pairs of major genes were 23.88 to 24.37 (da), -7.16 to -7.02(db), and 7.18 to 7.58 (dc) in both
years. Correspondingly, the interaction effects of two major genes were -14.01 to -13.52 (iab), 0.76 to 0.81(iac), and
-30.38 to -29.19(ibc), and the interaction effects of three major genes were -23.98 to -23.35 (iabc). The heritabilities
of the major genes were 88.69% and 89.01% in 2017 and 2018, and the heritabilities of the major genes were and
20.45%, respectively. The mean value of the Hsi was 0.85. The additive effects of two pairs of major genes were
3.27% and 2.86%, respectively.
Scientific Reports | (2021) 11:9004 | https://doi.org/10.1038/s41598-021-88652-3 3
Vol.:(0123456789)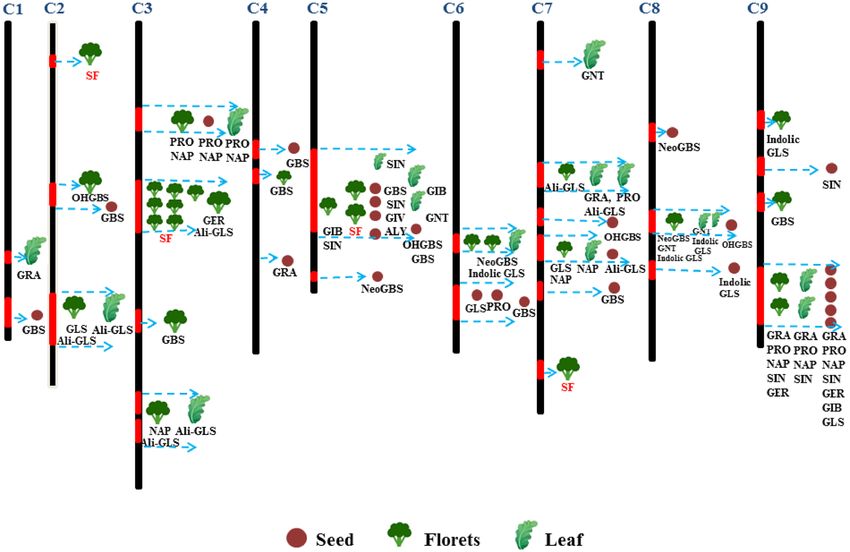
www.nature.com/scientificreports/
Chromosome Length (cM) Number of markers Min (cM) Max (cM) Average (cM)
1 48.35 29 0 48.35 1.67
2 84.45 35 0 84.45 2.41
3 430.52 169 0 430.52 2.55
4 127.44 74 0 127.44 1.73
5 90.4 23 0 90.4 3.93
6 49.76 30 0 49.76 1.66
7 133.51 30 0 133.51 4.45
8 93.31 23 0 93.31 4.06
9 110.52 25 0 110.52 4.42
Table 2. The profile of the linkage groups based on the broccoli DH population.
Figure 2. The electrophoretic profile of genome DNA (a) by agrose and SSR markers (Sc40045 and Sc29426) in
experimental plants by polyacrylamide gelelectrophoresis (PAGE) (b,c).
Linkage map construction. The linkage map in this study consisted of 438 SSR markers on 9 chromo-
somes: it covered 1168.26 cM of the whole genome; and the average distance between each marker was 2.99 cM
(Table 2). Table 2 showed that chromosome 3 exhibited the greatest number of SSR markers (169) and the long-
est length of the genetic map (430.52 cM). Chromosome 5 presented the lowest number of SSR markers (23),
with a genetic map length of 221.3 cM. Chromosome 1 showed the lower number of SSR markers (29) and the
shortest length of the genetic map (48.35 cM). The average physical distance between the mapped markers was
calculated to be 0.85–2.30 Mb based on 603 M b31,32. The electrophoretic profile of genome DNA (a) by agrose
and SSR markers in experimental plants by polyacrylamide gelelectrophoresis (PAGE) was shown in Fig. 2.
Fine mapping of 6 major regions for SF metabolism. Using the biparental populations (BIP) module
of inclusive composite interval mapping (ICIM) in QTL IciMapping 4.2 software for QTL analysis, a total of
18 QTLs for SF metabolism in broccoli florets were found during the two study years, which were mapped on
chromosomes C2, C3, C5 and C7 (Table 3; Fig. 3a,b). The LOD values of all QTLs ranged from 3.06 to 14.47,
explaining the biochemical variation of 1.74%-7.03% observed between the two years (Table 3). Among the 18
QTLs, 10 were detected in 2017 (qSF-C2, qSF-C3-1, qSF-C3-2, qSF-C3-3, qSF-C3-4, qSF-C3-5, qSF-C3-6, qSF-C5-
1, qSF-C5-2 and qSF-C7), and the other 8 were detected in 2018 (qSF-C3-0, qSF-C3-1, qSF-C3-2, qSF-C3-3, qSF-
C3-4, qSF-C3-5, qSF-C3-6 and qSF-C7) (Table 3). Furthermore, the results showed that 6 highly similar QTLs
were stably detected in more than one environment, accounting for 4.54%-7.03% of the biochemical variation
explained (PVE) with positive or negative additive effects (Add)33,34 (Table 3).
According to comparisons between two environments, 6 QTLs for SF metabolism in broccoli florets were
considered to be significant QTLs, which were located on chromosomes 3 and 7 (Fig. 3c). Among these QTLs,
5 (qSF-C3-1, qSF-C3-2, qSF-C3-3, qSF-C3-5, and qSF-C3-6) were distributed on chromosome 3, and 1 (qSF-C7)
Scientific Reports | (2021) 11:9004 | https://doi.org/10.1038/s41598-021-88652-3 4
Vol:.(1234567890)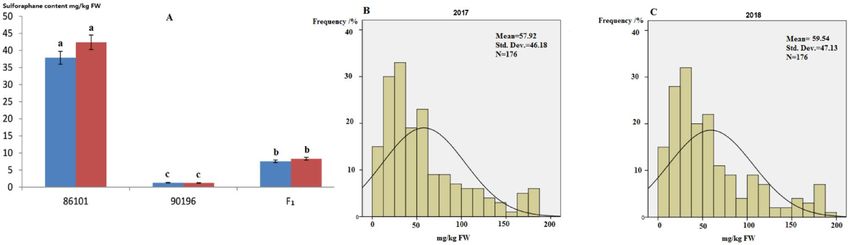
www.nature.com/scientificreports/

                                  Year    QTLs            Chromosome    Position   Left marker     Right marker    LOD     PVE (%)   Add
                                          qSF-C2( +)      2              16.6      13,450          8C0147           4.64   3.11       2.61
                                          qSF-C3-1( +)*   3             153.4      Sc1089-14,760   Sc3215           9.86   5.23       3.97
                                          qSF-C3-2( +)*   3             160.2      8C0226          Sc21910         14.47   5.76       4.41
                                          qSF-C3-3(-)*    3             198.6      sf50643         8C0445          11.85   6.68      − 4.62
                                          qSF-C3-4(-)     3             199.9      Sc1045-14,575   Sc8597           4.51   6.15      − 4.18
                                  2017
                                          qSF-C3-5( +)*   3             239.4      Sc2207          Sc4534          10.36   6.82       4.53
                                          qSF-C3-6( +)*   3             239.7      Sc4534          8C0828          12.25   7.03       4.59
                                          qSF-C5-1( +)    5              50.1      sc4037          sc25806          3.06   1.74       1.96
                                          qSF-C5-2( +)    5              87.9      sc7907          8C0211           3.34   4.61       3.42
                                          qSF-C7( +)*     7             111.6      896             Sc14232         10.93   6.56       4.79
                                          qSF-C3-0(-)     3             140.2      1165–1544       Sc38233          6.92   7.01      − 4.65
                                          qSF-C3-1( +)*   3             153.5      Sc1089-14,760   Sc3215           4.47   4.69       3.85
                                          qSF-C3-2( +)*   3             160.1      8C0226          Sc21910          7.38   6.18       4.64
                                          qSF-C3-3(-)*    3             198.7      sf50643         8C0445           5.73   6.51      − 4.62
                                  2018
                                          qSF-C3-4( +)    3             199.4      8C0227          Sc1045-14,575    4.06   5.52       3.96
                                          qSF-C3-5( +)*   3             239.2      Sc2207          Sc4534           4.57   6.35       4.34
                                          qSF-C3-6( +)*   3             239.5      Sc4534          8C0828           5.15   6.59       4.40
                                          qSF-C7( +)*     7             111.1      896             Sc14232          3.58   4.54       3.87

                                  Table 3.  Common QTLs in two independent genetic backgrounds. ( +) Represents a positive additive effect,
                                  indicating that the alleles at the locus increased the content of SF; (-) represents a negative additive effect,
                                  indicating that the alleles at the locus decreased the content of SF; PVE represents the phenotypic variance
                                  explained; Add represents the additive effect; *(in red) indicates an overlapping chromosomal region detected
                                  in the two years and considered to be the same locus.

                                  Figure 3.  The profile of QTLs for SF content in broccoli florets based on 9 linkage maps (a), LOD values and additive
                                  effects of QTLs detected in 2017. The epistatic effects and QTL interaction effects with the environment (QE) at
                                  LOD = 3.0 (b). The major QTLs for biochemical variation of SF content were located on chromosomes 3 and 7 (c).

Scientific Reports |   (2021) 11:9004 |                   https://doi.org/10.1038/s41598-021-88652-3                                                   5

                                                                                                                                                 Vol.:(0123456789)
www.nature.com/scientificreports/
was distributed on chromosome 7. Moreover, these significant QTLs showed a higher PVE and additive effects
(Table 3). The qSF-C3-1, qSF-C3-2, qSF-C3-3, qSF-C3-5, and qSF-C3-6 QTLs explained 4.69%-5.23%, 4.69%-
5.76%, 6.51%-6.68%, 6.35%-6.82%, and 6.56%-7.03% of the observed biochemical variation, respectively, includ-
ing one QTL with a negative additive effect (qSF-C3-3). The qSF-C7 QTL, found on chromosome 7, explained
6.56%-6.59% of the observed biochemical variation, with a positive additive effect (3.87–4.79). In addition, 6
important QTLs, qSF-C3-1, qSF-C3-2, qSF-C3-3, qSF-C3-5, qSF-C3-6, and qSF-C7, were stably detected with
the same flanking markers corresponding to the left markers and right markers of Sc1089-14,760 and Sc3215,
8C0226 and Sc21910, sf50643 and 8C0445, Sc2207 and Sc4534, Sc4534 and 8C0828, and 896 and Sc14232,
respectively (Table 3).
Discussion
A variety of genetic and environmental factors ultimately affect the metabolite levels of glucosinolate in Brassica
crops, such as Brassica napus35,36, Brassica rapa37, and Brassica juncea38,39. It has been reported that this conclu-
sion is also applicable the GRA and SF in broccoli. Moreover, different organs of broccoli, including the seeds,
seedlings, sprouts, leaves, and stalks, present quite different SF contents, which are mostly determined by the
genotype and its interactions with the e nvironment22,40–44. Similarly, in the florets and leaves that we analyzed,
it was shown that there were significant variations in SF accumulation in different genotypes and organs at
different developmental stages (florets at mature, buds to flowers at bolting)3,22. In addition, it has been proved
that glucoraphanin content can be regulated and affected by several genes, such as BCAT4 (branched-chain
aminotransferase 4), MAM1 (methylthioalkylmalate synthase 1), CYP79F1 (dihomomethionine N-hydroxylase),
AOP2 (2-oxoglutarate-dependent dioxygenases)45–48. In our study, genetic analysis of SF contents in broccoli
florets was firstly estimated by a DH population in both years, and the result revealed that there might be at least
three major genes controlling the biochemical variation of SF contents, at the same time, the environment was
also an influence factor. So our result provided a direct evidence in SF or GRA metabolism in crucifer plants,
which was consistent with most previous reports. Therefore, according to previous reports, broccoli shows con-
siderable differences in SF contents in different organs and developmental stages, suggesting that SF metabolism
is regulated by different genes than glucosinolate biosynthesis. To date, most QTL mapping studies of glucosi-
nolate have focused on Arabidopsis, Brassica napus and Brassica rapa crops, and few reports have provided QTL
information on SF in broccoli florets based on a permanent DH population derived from broccoli varieties to
study the underlying regulatory mechanism. Therefore, the mapping of QTLs responsible for the differences in
SF metabolism in different environments is helpful to better understand the relationships among the environ-
ment, MY activity and SF content in broccoli18.
SF plays an important role in anticancer effects and the prevention of cerebrovascular disease. Most people
obtain nutrition from broccoli by consuming the florets or their extracts, so this study focused on the investiga-
tion of QTLs for SF metabolism in broccoli florets by using a permanent DH population including 176 individu-
als. In our study, significant QTLs for SF metabolism in broccoli florets were mapped to chromosomes 3 and 7.
In previous studies, QTLs for total GLS, aliphatic GLS, GRA, progoitrin (PRO), gluconapin (NAP), glucoerucin
(GER), glucobrassicin (GBS), and 4-hydroxyglucobrassicin (OHGBS) were found on chromosomes 3 and 7
(Fig. 4)30,49,50. GRA is the precursor of SF, whose production is catalyzed by MY, and it belongs to the aliphatic
GLS; therefore, we emphasized the mapping of GRA, aliphatic GLS and MY. In previous reports, we found that
some QTLs for aliphatic GLS and GRA were located on chromosomes 1, 2, 3, 4, 7 and 9; QTLs for both aliphatic
GSL and GRA were located on chromosome 7; and QTLs for GRA alone were located on chromosomes 1, 7 and
9 (Fig. 4). In our study, 18 QTLs for SF were detected on chromosomes 2, 3, 5 and 7, and 6 significant QTLs were
mapped to chromosomes 3 and 7, which indicated that some QTLs identified in this study were consistent with
those identified in previous reports, but our results showed more QTLs on chromosome 3, suggesting shorter
genetic distance and that more detailed information will need to be obtained in future research. Therefore, to a
large extent, the important QTLs for SF metabolism in broccoli florets might be located on chromosome 7. In
fact, SF metabolism is determined by polygenic regulation, and major genes and microgenes both play important
roles in different organs, developmental stages and e nvironments13,17,20,26,29,30,41,43.
In the two years, 6 common QTLs (qSF-C3-1, qSF-C3-2, qSF-C3-3, qSF-C3-5, qSF-C3-6 and qSF-C7) were
stably detected with the same flanking markers. Considering to the similar contorl of two envirnmonts, except
for the slight changes in temperature, the results might provide a reliable experiment basis for studying molecular
mechanism of SF regulation. At present, the research on QTL mapping for SF metabolism in broccoli is limited
and is not sufficiently deep. On the basis of this study and several previous reports, we can infer that the qSF-
C3-1, qSF-C3-2, qSF-C3-5, qSF-C3-6 and qSF-C7 QTLs play an important role in SF accumulation as upstream
regulated genes with positive effects. The qSF-C3-3 QTL might be a negatively regulated gene in the SF synthesis
pathway and could be an ESP-related gene or a secondary product-regulated gene for substrates competing with
GRA. In addition to 6 common QTLs, 5 other QTLs (qSF-C2, qSF-C3-0, qSF-C3-4, qSF-C5-1 and qSF-C5-2) were
detected on chromosomes 2, 3 and 5. In previous reports, QTLs for aliphatic and total GLS have been found on
chromosomes 2 and 3. In the present study, we also found QTLs (qSF-C5-1 and qSF-C5-2) on chromosome 5
that have not been reported previously.
It has been reported that the AOP family plays an important role in the side chain modification of GLS. The
function of the AOP2 gene is absent in broccoli, and AOP3 is associated with the apparent regulatory control of
aliphatic GLS accumulation by catalyzing the production of hydroxyalkyl glucosinolate from methylsulfinylalkyl
glucosinolate with C3 side chains, but the specific roles of AOP1 and AOP3 in controlling aliphatic GLS accu-
mulation are less well k nown26,51–54. In our study, several QTLs (qSF-C3-0, qSF-C3-4, qSF-C5-1 and qSF-C5-2)
detected as special regions in broccoli might be related to the AOP family, which requires further research.
Scientific Reports | (2021) 11:9004 | https://doi.org/10.1038/s41598-021-88652-3 6
Vol:.(1234567890)www.nature.com/scientificreports/
Figure 4. Framework map of broccoli populations showing the metabolic QTLs for SF, total GLS,
and individual GLSs, including aliphatic GLS (Ali-GLS): glucoraphanin (GRA), gluconapin (NAP),
glucobrassicanapin (GBN), glucoerucin (GER), progoitrin (PRO), sinigrin (SIN), glucoiberverin (GIV),
glucoiberin (GIB), and glucoalyssin (ALY); indolic GLS (indolic GLS): glucobrassicin (GBS), neoglucobrassicin
(neoGBS), and 4hydroxyglucobrassicin (OHGBS); and an aromatic GLS (Aro-GLS): gluconasturtiin (GST).
The chromosome bars were mapped based on the B. oleracea genome, previous reports and our r esearch30,31,49.
QTLs are represented by different shapes and colors depending on different plant organs: seeds (auburn), florets
(dark green), and leaves (green). The numbers and regions of their coverage in the seeds, florets and leaf indicate
the genetic loci and alleles. The column cabel (red) in the chromosomes shows the QTLs regeion for individual
GLSs, and dotted arrow (light blue) points to the single or many traits. Different colors of QTLs for GLS and SF
were used to distinguish between previous studies (in dark) and this work (in red).
We detected some major and special QTLs for SF metabolism in broccoli florets based on a DH population
in various environments. It is believed that these QTLs can be used for marker-assisted selection breeding and
fine mapping.
Methods
Plant materials. A DH of broccoli was developed from F 1 plants resulting from the cross of parents from
inbred lines 86,101 and 90,196, and there were 176 plants (genotypes) in this DH family generated from F 1
cultivated by a pollination method as our previously described55. Actually, DH is normally used to retain the
desired alleles in the genome and a quicker way to produce homogenous line, instead of self-pollination over
generations to produce inbred lines. In this study, all plant materials were bred and planted at the same farm of
the Institute of Vegetables and Flowers (39°90′N, 116°29′E), Chinese Academy of Agricultural Sciences (Beijing)
(IVF-CAAS). These 176 DH lines, their parents (individual 30 plants), and the F1 (30 plants) were all grown in
autumn 2017 (environment 1) and 2018 (environment 2) in Beijing (IVF-CAAS), separately. All plants were
sown on July 6–8 in 2017 and 2018, and were planted in the field after one month. The two environments
included 266 plants with three repeats (n = 3, total 798 plants) at random, and the plants were spaced 30 cm ×
50 cm apart with 15 plants in each row. For the DH population, the experimental plots were surrounded by two
additional rows planted to serve as a protective buffer. There were similar control and management for environ-
ment 1 and environment 2, the difference was that the monthly average temperature in september and october
2018 was 18.6 °C to 35 °C and 10.2 °C to 21.6 °C, which were a little higher than corresponding month in 2017
(17.2 to 32.3 °C and 8.1 °C to 19.2 °C).
Line 86,101 showed very early maturity (55 days after planting in the field) and exhibited some clovers in its
small florets a yellow-green broccoli head color (Fig. 5). Inbred line 90,196 also showed early maturity (60 days
after planting in the field) but exhibited no clovers in its middle florets, and its broccoli head color was green and
changed to deep purple under freezing temperature. The DH family presented differences in the phenotypes of
traits such as head color, shape, size, and the presence of clovers (Fig. 5).
Scientific Reports | (2021) 11:9004 | https://doi.org/10.1038/s41598-021-88652-3 7
Vol.:(0123456789)www.nature.com/scientificreports/
Figure 5. Phenotypic traits of the parental lines 86,101 and 90,196 and some individual DH lines.
Pretreatment and genetic analysis of SF. When the broccoli plants were mature, the florets were har-
vested, and the plant materials of the parents, F1 hybrid, and each DH line were collected and cut into small
pieces 5 cm in diameter. All the samples were immediately frozen in liquid nitrogen and stored at − 80 °C. Then,
the frozen samples were dried in a lyophilizer (BETA 2–8 LD plus, Christ). The dried samples were powdered
using an IKA-A10 (IKA-Werke GmbH & Co. KG) mill, and the fine powder was used for SF extraction and
quantitative analysis by RP-HPLC according to methods described in our previous r eports3,22,56. According to
mixed major gene plus polygene inheritance analysis, genetic analysis of sulforaphane content in the DH popula-
tion and parental lines was performed following our previous r eport57. The maximum likelihood method based
on the iterated expectation conditional maximization (IECM) algorithm, was used for estimating the distribu-
tion parameters. The genetic analysis (parameters) were carried out by a least-squares method in the optimal
model choosen by the Akaike information criterion (AIC).
Genotype analysis and QTL mapping. Genomic DNA was extracted from the young leaves of the two
parents, the F1 plants and the DH families using the hexadecyl trimethyl ammonium bromide (CTAB) method,
and DNA quality was detected by 1% agarose electrophoresis. A total of 176 individuals were genotyped using
438 SSR markers. These SSR markers were obtained from the Brassica website (http://www.brassica.bbsrc.ac.uk
and http://www.brassica.bbsrc.ac.uk) (398 pairs), B. oleracea genome (01–20) (2170 pairs) (Table S2)31, and B.
Scientific Reports | (2021) 11:9004 | https://doi.org/10.1038/s41598-021-88652-3 8
Vol:.(1234567890)www.nature.com/scientificreports/
oleracea expressed sequence tags (ESTs) were obtained from the National Center for Biotechnology Information
database (978 pairs)58. For PCR, the reaction volume of 10 μL contained 5 μL of a 2X reaction mix, 0.5 μL of the
forward primer, 0.5 μL of the reverse primer, 2 μL of genomic DNA template and 2 μL of ddH2O. The cycling
conditions were as follows: 5 min 94 °C; 40 cycles of 30 s at 94 °C, 30 s at 55 °C and 1 min at 72 °C; and a final
extension of 10 min at 72 °C. Thereafter, 6% denaturing polyacrylamide gel electrophoresis (PAGE) was used to
separate the PCR products.
QTL analysis was carried out via inclusive composite interval mapping (ICIM-ADD) with QTL IciMapping
version 4.2 software (http://www.i sbreeding.n
et). The critical LOD score for a significant QTL was set at 3.0, and
the walking speed for the genome-wide scan was set at 1 cM, through which both the additive and dominant
effects of a QTL can be e stimated34,59. The LOD threshold for each significant QTL was calculated via 1000 per-
mutations at p < 0.05. Conditional QTL analysis between 86,101 and 90,196 in the DH population was conducted
using the software QGAstation2.0 based on a mixed model for the complex quantitative t raits60.
Statistical analysis. The calculation of descriptive statistics, frequency distributions and one-way ANOVA
was performed using SPSS 19.0 software (http://www.spss.com). Additionally, Microsoft Office Excel 2010 soft-
ware was used for data entry and simple analysis.
Human and animal rights. This article does not contain any studies with human participants or animals
performed by any of the authors.
Data availability
Data supporting the current study can be obtained by contacting the corresponding author (lizhansheng@caas.
cn).
Received: 18 July 2020; Accepted: 15 April 2021
References
1. Burow, M., Markert, J., Gershenzon, J. & Wittstock, U. Comparative biochemical characterization of nitrile-forming proteins from
plants and insects that alter myrosinase-catalysed hydrolysis of glucosinolates. FEBS J. 273, 2432–2446. https://doi.org/10.1111/j.
1742-4658.2006.05252.x (2006).
2. Brown, A. F. et al. Glucosinolate profiles in broccoli: variation in levels and implications in breeding for cancer chemoprotection.
J. Am. Soc. Hortic. Sci. 127, 807–813 (2002).
3. Li, Z. S. et al. Variation of sulforaphane levels in broccoli (Brassica Oleracea Var. Italica) during flower development and the role
of gene Aop2. J. Liq. Chromatogr. R. T. 37, 1199–1211. https://doi.org/10.1080/10826076.2012.704608 (2014).
4. Giambanelli, E. et al. Broccoli glucosinolate degradation is reduced performing thermal treatment in binary systems with other
food ingredients. RSC Adv. 5, 66894–66900. https://doi.org/10.1039/c5ra11409h (2015).
5. Rask, L. et al. Myrosinase: gene family evolution and herbivore defense in Brassicaceae. Plant Mol. Biol. 42, 93–113. https://doi.
org/10.1023/A:1006380021658 (2000).
6. Zhang, J. M., Pontoppidan, B., Xue, J. P., Rask, L. & Meijer, J. The third myrosinase gene TGG3 in Arabidopsis thaliana is a pseu-
dogene specifically expressed in stamen and petal. Physiol. Plant. 115, 25–34. https://doi.org/10.1034/j.1399-3054.2002.1150103.x
(2002).
7. Andreasson, E., Jorgensen, L. B., Hoglund, A. S., Rask, L. & Meijer, J. Different myrosinase and idioblast distribution in Arabidopsis
and Brassica napus. Plant Physiol. 127, 1750–1763. https://doi.org/10.1104/pp.127.4.1750 (2001).
8. Falk, A., Taipalensuu, J., Ek, B., Lenman, M. & Rask, L. Characterization of rapeseed myrosinase-binding protein. Planta 195,
387–395 (1995).
9. Angelino, D. et al. Myrosinase-dependent and -independent formation and control of isothiocyanate products of glucosinolate
hydrolysis. Front Plant Sci. https://doi.org/10.3389/fpls.2015.00831 (2015).
10. Andersson, D. et al. Myrosinases from root and leaves of Arabidopsis thaliana have different catalytic properties. Phytochemistry
70, 1345–1354. https://doi.org/10.1016/j.phytochem.2009.07.036 (2009).
11. Robin, A. H. K. et al. Expression profiling of glucosinolate biosynthetic genes in brassica oleracea L. Var. capitata inbred lines
reveals their association with glucosinolate content. Molecules https://doi.org/10.3390/molecules21060787 (2016).
12. Abuyusuf, M. et al. Glucosinolate profiling and expression analysis of glucosinolate biosynthesis genes differentiate white mold
resistant and susceptible cabbage lines. Int. J. Mol. Sci. https://doi.org/10.3390/ijms19124037 (2018).
13. Liang, H., Yuan, Q. P. & Xiao, Q. Effects of metal ions on myrosinase activity and the formation of sulforaphane in broccoli seed.
J. Mol. Catal. B-Enzym. 43, 19–22. https://doi.org/10.1016/j.molcatb.2006.03.008 (2006).
14. Sangkret, S., Pongmalai, P., Devahastin, S. & Chiewchan, N. Enhanced production of sulforaphane by exogenous glucoraphanin
hydrolysis catalyzed by myrosinase extracted from Chinese flowering cabbage (Brassica rapa var. parachinensis). Sci. Rep. https://
doi.org/10.1038/s41598-019-46382-7 (2019).
15. Roman, J., Castillo, A. & Mahn, A. Molecular docking of potential inhibitors of broccoli myrosinase. Molecules https://doi.org/10.
3390/molecules23061313 (2018).
16. Mahn, A., Angulo, A. & Cabanas, F. Purification and characterization of broccoli (brassica oleracea var italica) myrosinase (beta-
thioglucosidase glucohydrolase). J. Agric. Food Chem. 62, 11666–11671. https://doi.org/10.1021/jf504957c (2014).
17. Roman, J., Castillo, A., Cottet, L. & Mahn, A. Kinetic and structural study of broccoli myrosinase and its interaction with different
glucosinolates. Food Chem. 254, 87–94. https://doi.org/10.1016/j.foodchem.2018.01.179 (2018).
18. Fahey, J. W. et al. Sulforaphane bioavailability from glucoraphanin-rich broccoli: control by active endogenous myrosinase. PLoS
ONE https://doi.org/10.1371/journal.pone.0140963 (2015).
19. Ishida, M., Hara, M., Fukino, N., Kakizaki, T. & Morimitsu, Y. Glucosinolate metabolism, functionality and breeding for the
improvement of Brassicaceae vegetables. Breed. Sci. 64, 48–59. https://doi.org/10.1270/jsbbs.64.48 (2014).
20. Fahey, J. W., Zalcmann, A. T. & Talalay, P. The chemical diversity and distribution of glucosinolates and isothiocyanates among
plants. Phytochemistry 56, 5–51. https://doi.org/10.1016/S0031-9422(00)00316-2 (2001).
21. Padilla, G., Cartea, M. E., Velasco, P., de Haro, A. & Ordás, A. Variation of glucosinolates in vegetable crops of Brassica rapa.
Phytochemistry 68, 536–545. https://doi.org/10.1016/j.phytochem.2006.11.017 (2007).
22. Li, Z. S. et al. Transcriptome reveals the gene expression patterns of sulforaphane metabolism in broccoli florets. PLoS ONE https://
doi.org/10.1371/journal.pone.0213902 (2019).
Scientific Reports | (2021) 11:9004 | https://doi.org/10.1038/s41598-021-88652-3 9
Vol.:(0123456789)www.nature.com/scientificreports/
23. Griffiths, D. W. et al. Identification of glucosinolates on the leaf surface of plants from the Cruciferae and other closely related
species. Phytochemistry 57, 693–700 (2001).
24. Barbieri, G., Pernice, R., Maggio, A., De Pascale, S. & Fogliano, V. Glucosinolates profile of Brassica rapa L. subsp Sylvestris L.
Janch var. esculenta Hort. Food Chem. 107, 1687–1691. https://doi.org/10.1016/j.foodchem.2007.09.054 (2008).
25. Farnham, M. W., Wilson, P. E., Stephenson, K. K. & Fahey, J. W. Genetic and environmental effects on glucosinolate content and
chemoprotective potency of broccoli. Plant Breed. 123, 60–65. https://doi.org/10.1046/j.0179-9541.2003.00912.x (2004).
26. Grubb, C. D. & Abel, S. Glucosinolate metabolism and its control. Trends Plant Sci. 11, 89–100. https://doi.org/10.1016/j.tplants.
2005.12.006 (2006).
27. Halkier, B. A. & Du, L. C. The biosynthesis of glucosinolates. Trends Plant Sci. 2, 425–431. https://doi.org/10.1016/S1360-1385(97)
90026-1 (1997).
28. Field, B. et al. Glucosinolate and amino acid biosynthesis in Arabidopsis. Plant Physiol. 135, 828–839. https://doi.org/10.1104/pp.
104.039347 (2004).
29. Kliebenstein, D. J., Kroymann, J. & Mitchell-Olds, T. The glucosinolate-myrosinase system in an ecological and evolutionary
context. Curr. Opin. Plant Biol. 8, 264–271. https://doi.org/10.1016/j.pbi.2005.03.002 (2005).
30. Sotelo, T., Soengas, P., Velasco, P., Rodriguez, V. M. & Cartea, M. E. Identification of metabolic qtls and candidate genes for glu-
cosinolate synthesis in brassica oleracea leaves. Seeds and Flower Buds. PloS one https://doi.org/10.1371/journal.pone.0091428
(2014).
31. Liu, S. Y. et al. The Brassica oleracea genome reveals the asymmetrical evolution of polyploid genomes. Nat. Commun. https://doi.
org/10.1038/Ncomms4930 (2014).
32. Van Os, H., Stam, P., Visser, R. G. F. & Van Eck, H. J. RECORD: a novel method for ordering loci on a genetic linkage map (vol
112, pg 30, 2005). Theor. Appl. Genet. 112, 389–389. https://doi.org/10.1007/s00122-005-0152-7 (2006).
33. Zhang, Y. M. & Gai, J. Y. Methodologies for segregation analysis and QTL mapping in plants. Genetica 136, 311–318. https://doi.
org/10.1007/s10709-008-9313-3 (2009).
34. Meng, L., Li, H. H., Zhang, L. Y. & Wang, J. K. QTL IciMapping: Integrated software for genetic linkage map construction and
quantitative trait locus mapping in biparental populations. Crop. J. 3, 269–283. https://doi.org/10.1016/j.cj.2015.01.001 (2015).
35. Liu, Y. et al. Fine mapping and candidate gene analysis of a seed glucosinolate content QTL, qGSL-C2, in rapeseed (Brassica napus
L.). Theor. Appl. Genet. 133, 479–490. https://doi.org/10.1007/s00122-019-03479-x (2020).
36. He, Y. J., Fu, Y., Hu, D. X., Wei, D. Y. & Qian, W. QTL mapping of seed glucosinolate content responsible for environment in bras-
sica napus. Front Plant Sci. https://doi.org/10.3389/fpls.2018.00891 (2018).
37. Rahman, H., Kebede, B., Zimmerli, C. & Yang, R. C. Genetic study and QTL mapping of seed glucosinolate content in brassica
rapa L. Crop. Sci. 54, 537–543. https://doi.org/10.2135/cropsci2013.06.0391 (2014).
38. Ramchiary, N. et al. QTL analysis reveals context-dependent loci for seed glucosinolate trait in the oilseed Brassica juncea: impor-
tance of recurrent selection backcross scheme for the identification of “true” QTL. Theor. Appl. Genet. 116, 77–85. https://doi.org/
10.1007/s00122-007-0648-4 (2007).
39. Javidfar, F. & Cheng, B. F. Construction of a genetic linkage map and QTL analysis of erucic acid content and glucosinolate com-
ponents in yellow mustard (Sinapis alba L.). BMC Plant Biol. https://doi.org/10.1186/1471-2229-13-142 (2013).
40. Abercrombie, J. M., Farnham, M. W. & Rushing, J. W. Genetic combining ability of glucoraphanin level and other horticultural
traits of broccoli. Euphytica 143, 145–151. https://doi.org/10.1007/s10681-005-3059-0 (2005).
41. Farnham, M. W., Stephenson, K. K. & Fahey, J. W. Glucoraphanin level in broccoli seed is largely determined by genotype. HortSci-
ence 40, 50–53. https://doi.org/10.21273/Hortsci.40.1.50 (2005).
42. Liang, H., Yuan, Q. P., Dong, H. R. & Liu, Y. M. Determination of sulforaphane in broccoli and cabbage by high-performance
liquid chromatography. J. Food. Compos. Anal. 19, 473–476. https://doi.org/10.1016/j.jfca.2005.11.005 (2006).
43. Gorissen, A. et al. No de novo sulforaphane biosynthesis in broccoli seedlings. Food Chem. 127, 192–196. https://d oi.o
rg/1 0.1 016/j.
foodchem.2010.12.067 (2011).
44. Bello, C., Maldini, M., Baima, S., Scaccini, C. & Natella, F. Glucoraphanin and sulforaphane evolution during juice preparation
from broccoli sprouts. Food Chem. 268, 249–256. https://doi.org/10.1016/j.foodchem.2018.06.089 (2018).
45. Liu, Z. Y. et al. Enriching glucoraphanin in brassica rapa through replacement of BrAOP2.2/BrAOP2.3 with non-functional genes.
Front Plant Sci. https://doi.org/10.3389/fpls.2017.01329 (2017).
46. Liu, Z. et al. Reducing progoitrin and enriching glucoraphanin in Braasica napus seeds through silencing of the GSL-ALK gene
family. Plant Mol. Biol. 79, 179–189. https://doi.org/10.1007/s11103-012-9905-2 (2012).
47. Yin, L., Chen, C. M., Chen, G. J., Cao, B. H. & Lei, J. J. Molecular cloning, expression pattern and genotypic effects on glucoraphanin
biosynthetic related genes in chinese kale (brassica oleracea var. alboglabra bailey). Molecules 20, 20254–20267. https://doi.org/
10.3390/molecules201119688 (2015).
48. Li, Z. et al. Characterization of glucosinolates in 80 broccoli genotypes and different organs using UHPLC-Triple-TOF-MS method.
Food Chem. 334, 127519. https://doi.org/10.1016/j.foodchem.2020.127519 (2021).
49. Sotelo, T., Velasco, P., Soengas, P., Rodriguez, V. M. & Cartea, M. E. Modification of leaf glucosinolate contents in brassica oleracea
by divergent selection and effect on expression of genes controlling glucosinolate pathway. Front Plant Sci. https://d oi.o
rg/1 0.3 389/
fpls.2016.01012 (2016).
50. Traka, M. H. et al. Genetic regulation of glucoraphanin accumulation in Beneforte (R) broccoli. New Phytol. 198, 1085–1095.
https://doi.org/10.1111/nph.12232 (2013).
51. Rohr, F., Ulrichs, C., Schreiner, M., Zrenner, R. & Mewis, I. Responses of Arabidopsis thaliana plant lines differing in hydroxylation
of aliphatic glucosinolate side chains to feeding of a generalist and specialist caterpillar. Plant Physiol. Biochem. 55, 52–59. https://
doi.org/10.1016/j.plaphy.2012.03.005 (2012).
52. Kliebenstein, D. J., Gershenzon, J. & Mitchell-Olds, T. Comparative quantitative trait loci mapping of aliphatic, indolic and benzylic
glucosinolate production in Arabidopsis thaliana leaves and seeds. Genetics 159, 359–370 (2001).
53. Kliebenstein, D. J. et al. Genetic control of natural variation in Arabidopsis glucosinolate accumulation. Plant Physiol. 126, 811–825.
https://doi.org/10.1104/pp.126.2.811 (2001).
54. Wentzell, A. M. et al. Linking metabolic QTLs with network and cis-eQTLs controlling biosynthetic pathways. Plos Genet. 3,
1687–1701. https://doi.org/10.1371/journal.pgen.0030162 (2007).
55. Yuan, S. X. et al. Chromosome doubling of microspore-derived plants from cabbage (brassica oleracea var. capitata L.) and broccoli
(brassica oleracea Var. italica L.). Front Plant Sci. https://doi.org/10.3389/Fpls.2015.01118 (2015).
56. Li, Z. S. et al. Natural sulforaphane from broccoli seeds against influenza a virus replication in MDCK cells. Natl. Prod. Commun.
https://doi.org/10.1177/1934578x19858221 (2019).
57. Mang, X. L. et al. Genetic analysis and QTL mapping of traits related to head shape in cabbage (Brassica oleracea var. capitata L.).
Sci. Hortic-Amsterdam 207, 82–88. https://doi.org/10.1016/j.scienta.2016.05.015 (2016).
58. Chen, C. et al. A co-dominant marker BoE332 applied to marker-assisted selection of homozygous male-sterile plants in cabbage
(Brassica oleracea var. capitata L.). J. Integr. Agric. 12, 596–602. https://doi.org/10.1016/S2095-3119(13)60277-4 (2013).
59. Liang, Y. T. et al. QTL and QTL networks for cold tolerance at the reproductive stage detected using selective introgression in rice.
PLoS ONE https://doi.org/10.1371/journal.pone.0200846 (2018).
Scientific Reports | (2021) 11:9004 | https://doi.org/10.1038/s41598-021-88652-3 10
Vol:.(1234567890)www.nature.com/scientificreports/
60. Meng, L. J., Zhao, X. Q., Ponce, K., Ye, G. Y. & Leung, H. QTL mapping for agronomic traits using multi-parent advanced genera-
tion inter-cross (MAGIC) populations derived from diverse elite indica rice lines. Field Crop. Res. 189, 19–42. https://doi.org/10.
1016/j.fcr.2016.02.004 (2016).
Acknowledgements
This study was funded by the National Natural Science Foundation of China (31501761), the National Key
Research and Development Program of China (2017YFD0101805), the China Agriculture Research System
(CARS-23-A8), the Key Laboratory of Biology and Genetic Improvement of Horticultural Crops, Ministry of
Agriculture, P.R. China, the Science and Technology Innovation Program of the Chinese Academy of Agricul-
tural Sciences (CAAS-ASTIPIVFCAAS), and the State Key Laboratory of Vegetable Germplasm Innovation. We
thank the academic English editors (AJE) (available online: https://www.aje.com/services/editing/) for editing
this manuscript.
Author contributions
Z.L. and Y.L. conceived and designed the study. Z.L. performed the experiments. Z.L., Z.F., L.Y., and M.Z. ana-
lyzed the data. Z.L. prepared the manuscript, and Y.L. and Y.Z. improved the manuscript. S.Y., H.L., Y.W., F.H.,
and J.J. contributed reagents and materials. All authors have read and approved the final manuscript.
Competing interests
The authors declare no competing interests.
Additional information
Supplementary information The online version contains supplementary material available at https://doi.org/
10.1038/s41598-021-88652-3.
Correspondence and requests for materials should be addressed to Z.L.
Reprints and permissions information is available at www.nature.com/reprints.
Publisher’s note Springer Nature remains neutral with regard to jurisdictional claims in published maps and
institutional affiliations.
Open Access This article is licensed under a Creative Commons Attribution 4.0 International
License, which permits use, sharing, adaptation, distribution and reproduction in any medium or
format, as long as you give appropriate credit to the original author(s) and the source, provide a link to the
Creative Commons licence, and indicate if changes were made. The images or other third party material in this
article are included in the article’s Creative Commons licence, unless indicated otherwise in a credit line to the
material. If material is not included in the article’s Creative Commons licence and your intended use is not
permitted by statutory regulation or exceeds the permitted use, you will need to obtain permission directly from
the copyright holder. To view a copy of this licence, visit http://creativecommons.org/licenses/by/4.0/.
© The Author(s) 2021
Scientific Reports | (2021) 11:9004 | https://doi.org/10.1038/s41598-021-88652-3 11
Vol.:(0123456789)You can also read