Behavioral characteristics as potential biomarkers of the development and phenotype of epilepsy in a rat model of temporal lobe epilepsy - Nature
←
→
Page content transcription
If your browser does not render page correctly, please read the page content below
www.nature.com/scientificreports
OPEN Behavioral characteristics
as potential biomarkers
of the development and phenotype
of epilepsy in a rat model
of temporal lobe epilepsy
Karolina Nizinska1*, Kinga Szydlowska1, Avgoustinos Vouros2, Anna Kiryk1,3,
Aleksandra Stepniak1, Eleni Vasilaki2 & Katarzyna Lukasiuk1
The present study performed a detailed analysis of behavior in a rat model of epilepsy using both
established and novel methodologies to identify behavioral impairments that may differentiate
between animals with a short versus long latency to spontaneous seizures and animals with a low
versus high number of seizures. Temporal lobe epilepsy was induced by electrical stimulation of the
amygdala. Rats were stimulated for 25 min with 100-ms trains of 1-ms biphasic square-wave pluses
that were delivered every 0.5 s. Electroencephalographic recordings were performed to classify
rats into groups with a short latency (< 20 days, n = 7) and long latency (> 20 days, n = 8) to the first
spontaneous seizure and into groups with a low number of seizures (62 ± 64.5, n = 8) and high number
of seizures (456 ± 185, n = 7). To examine behavioral impairments, we applied the following behavioral
tests during early and late stages of epilepsy: behavioral hyperexcitability, open field, novel object
exploration, elevated plus maze, and Morris water maze. No differences in stress levels (e.g., touch
response in the behavioral hyperexcitability test), activity (e.g., number of entries into the open arms
of the elevated plus maze), or learning (e.g., latency to find the platform in the Morris water maze
test during training days) were observed between animals with a short versus long latency to develop
spontaneous seizures or between animals with a low versus high number of seizures. However, we
found a higher motor activity measured by higher number of entries into the closed arms of the
elevated plus maze at week 26 post-stimulation in animals with a high number of seizures compared
with animals with a low number of seizures. The analysis of the Morris water maze data categorized
the strategies that the animals used to locate the platform showing that the intensity of epilepsy and
duration of epileptogenesis influenced swimming strategies. These findings indicate that behavioral
impairments were relatively mild in the present model, but some learning strategies may be useful
biomarkers in preclinical studies.
Epilepsy is one of the most common brain disorders, affecting 1% of the world’s population1. Current data
from the World Health Organization indicate that 50 million people suffer from epilepsy (https://www.who.int/
health-topics/epilepsy; accessed December 4, 2020). Each year, approximately 2.4 million new cases of epilepsy
are diagnosed2,3. In 30% of cases, epilepsy develops as a result of brain insult, most commonly stroke, mechanical
trauma, and status epilepticus4. The initial insult is followed by a latency period (referred to as epileptogenesis)
to the first spontaneous seizure. Epileptogenesis is a process by which several neurobiological events occur,
including molecular, cellular, and functional changes, following brain d amage5,6.
In preclinical and clinical studies of human epilepsy and animal models of epilepsy, electroencephalography
(EEG) is used for seizure diagnosis. Electroencephalography measures the frequency and intensity of recurrent
spontaneous seizures and can predict upcoming seizure events7. Electroencephalography in human clinical
studies is a minimal criterion for an epilepsy d iagnosis7. Electroencephalography is also frequently used in
1
Laboratory of Epileptogenesis, Nencki Institute of Experimental Biology, Warsaw, Poland. 2Department of
Computer Science, Faculty of Engineering, University of Sheffield, Sheffield, Great Britain. 3Laboratory of Animal
Models, Nencki Institute of Experimental Biology, Warsaw, Poland. *email: k.nizinska@nencki.edu.pl
Scientific Reports | (2021) 11:8665 | https://doi.org/10.1038/s41598-021-88088-9 1
Vol.:(0123456789)www.nature.com/scientificreports/
animal studies to characterize the development of epilepsy and disease phenotypes. However, the generation of
reliable data often requires manual analysis or at least the manual validation of EEG recordings, which can be
time-consuming and laborious. This makes EEG an inconvenient tool for rapid drug screening or long-term
observations of animal cohorts, thus justifying the search for new, noninvasive biomarkers.
In the present study, we searched for noninvasive biomarkers of epilepsy that might be useful for the diagnosis
of epilepsy and prediction of epileptogenesis. In animal models of epilepsy, behavioral and cognitive impair-
ments are frequently observed. We sought to identify noninvasive biomarkers by evaluating whether behavioral
impairments depend on the latency to the first spontaneous seizure and intensity of epilepsy, measured as the
total number of seizures.
Materials and methods
Animal surgery and status epilepticus induction. All of the animal procedures were approved by the
Ethical Committee on Animal Research of the Nencki Institute of Experimental Biology (permit no. 483/2013 of
the Warsaw Local Ethics Committee for Animal Experimentation) and conducted in accordance with guidelines
that were established by European Council Directive 2010/63/EU and accordance with the ARRIVE g uidelines8.
Twenty-six adult male Sprague–Dawley rats (270–300 g) from the Mossakowski Medical Research Centre, Polish
Academy of Sciences (Warsaw, Poland), were used in this study. The experiments included two animal groups.
The first group consisted of n = 8 control and n = 8 stimulated rats. The second group consisted of n = 4 control
and n = 7 stimulated rats. The rats were housed under controlled conditions (24 °C, 50–60% humidity, 12 h/12 h
light/dark cycle) with food and water available ad libitum. The animals were housed in pairs. Environmental
enrichment was employed by using various toys (e.g., wooden and plastic balls) and snacks that were changed
weekly. Starting 4 weeks before electrical stimulation, the rats were regularly handled every other day for 10 min.
The timeline of the experiments is presented in Fig. 1A.
The amygdala stimulation model of temporal lobe epilepsy was used in the present study9. Status epilepticus
was triggered by electrical stimulation of the amygdala as previously d escribed10 with some modifications. Briefly,
surgery was performed under isoflurane anesthesia (2–2.5% in 100% O2) that was preceded by an injection of
butorphanol (Butomidor, Richter Pharma AG, Wells, Austria; 0.5 mg/kg, i.p.) for analgesia. Stimulating and
recording bipolar electrodes (Plastic One, Roanoke, VA, USA; catalog no. E363-3-2WT-SPC) were implanted
in the left lateral nucleus of the amygdala 3.6 mm posterior and 5.0 mm lateral to bregma, 6.5 mm ventral to the
surface of the brain. A stainless-steel screw electrode (Plastics One, Roanoke, VA, USA; catalog no. E363/20)
was implanted contralaterally in the skull over the right frontal cortex (3.0 mm anterior and 2.0 mm lateral to
bregma) as a surface EEG recording electrode. Two stainless-steel screw electrodes were placed bilaterally over
the cerebellum (10.0 mm posterior and 2.0 mm lateral to bregma) as ground and reference electrodes. The socket
contacts of all of the electrodes were placed in a multi-channel electrode pedestal (Plastics One, Roanoke, VA,
USA; catalog no. MS363) that was attached to the skull with dental acrylate (Duracryl Plus). After 2 weeks of
recovery, the animals were electrically stimulated via the intra-amygdala electrode to evoke status epilepticus.
Stimulation consisted of a 100-ms train of 1-ms biphasic square-wave pulses (400 μA peak to peak) that were
delivered at 60 Hz every 0.5 s for 30 min. If the animal did not exhibit status epilepticus, then the stimulation was
continued for an additional 10 min. Status epilepticus was stopped 1 h after the cessation of stimulation via an
intraperitoneal injection of diazepam (20 mg/kg).If the first dose of diazepam did not suppress status epilepticus,
then the animal received subsequent doses of 5 mg/kg diazepam. Time-matched control animals had electrodes
implanted but did not receive electrical stimulation.
The rats were continuously monitored by video EEG (vEEG; Comet EEG, Grass Technologies, West Warwick,
RI, USA) using a Panasonic WV-CP480 camera from the moment of stimulation until week 5 of the study (first
vEEG recording), from week 11 to week 15 (second vEEG recording), and starting at week 27 until the end of the
experiment (third vEEG recording; Fig. 1A). Spontaneous seizures were identified from the EEG recordings by
browsing the EEG manually on the computer screen. An electrographic seizure was defined as a high-frequency
(> 8 Hz) and high-amplitude (> 2 × baseline) discharge that lasted at least 5 s. The latency to the first spontaneous
seizure, number and frequency of seizures, and number of epileptic animals in each group were evaluated. The
analysis of video EEG showed that the stimulated animals developed partial and generalized seizures. Among
the 15 stimulated animals, nine had at least one generalized seizure. However, the frequency of partial seizures
was higher than generalized seizures. The number of generalized seizures was low: 83 of 3654 seizures (2.3%).
Body weight monitoring. Body weight was monitored 2 weeks before and 0, 1, 2, 5, 9, 12, 24, and 31 weeks
after stimulation (Fig. 1C). This parameter was used to assess the general health status of the rats after electrode
implantation and at later time points.
Behavioral tests. All of the animals in the study underwent a battery of behavioral tests, in the following
order: open field test, novel object recognition test, elevated plus maze test (weeks 8 and 26 after the induction of
status epilepticus) and Morris water maze test (weeks 9 and 27 after the induction of status epilepticus). All of the
tests were recorded using WinTV software (Hauppauge, NY, USA). Video files were analyzed using EthoVision
8.5 software (Noldus, Leesburg, VA, USA), and the data were exported to Microsoft Excel. Tests were performed
in an order from the least to the most stressful for the animals. By using different behavioral tests to assess similar
parameters, such as anxiety or activity, we were able to validate the observed effect on these differenct param-
eters. Moreover, we could observe that a specific parameter was specifically sensitive in a particular test. To avoid
negative effects of repeated testing which can influence the animal’s activity all of the animals were familiarized
with the testing areas prior to testing and we performed the behavioral tests beginning with the least invasive to
the most invasive(and hence the least to the most stressful). The order of animals within trials was randomized.
Scientific Reports | (2021) 11:8665 | https://doi.org/10.1038/s41598-021-88088-9 2
Vol:.(1234567890)www.nature.com/scientificreports/
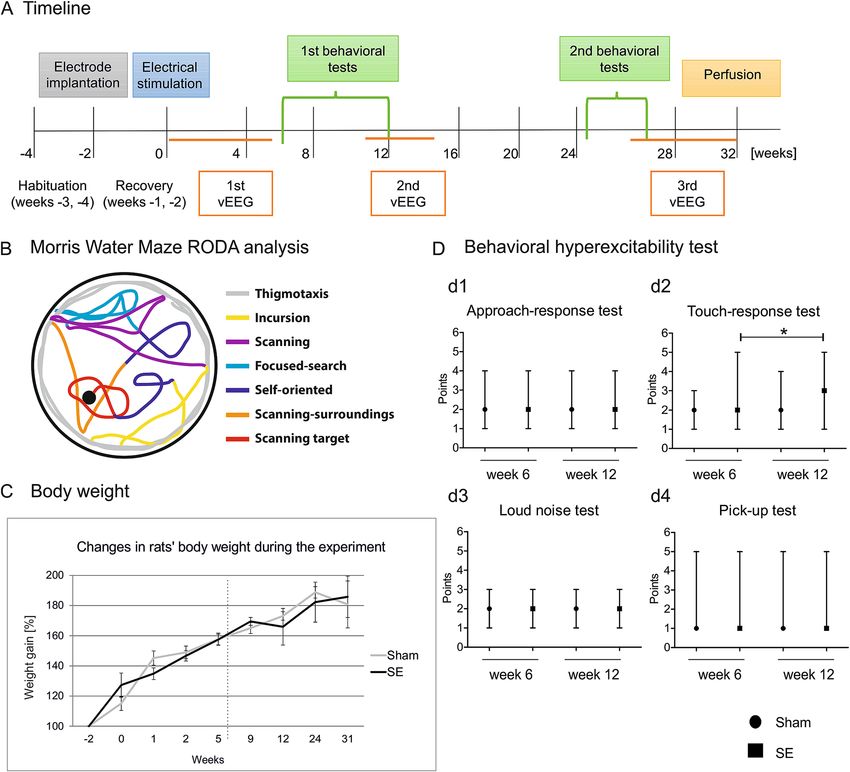
Figure 1. Experimental design, swimming strategies in the Morris water maze, and the animals’ wellbeing
during the experiment between sham and stimulated rats. (A) Experimental design. Timeline of electrode
implantation 2 weeks before electrical stimulation (0 week-start), video EEG (vEEG) monitoring, the battery of
behavioral tests, and perfusion (32 week-end). (B) Schematic illustration of swimming strategies in the Morris
water maze using Rodent Data Analysis (RODA) software. (C) Body weight in sham (n = 12) and stimulated
animals (SE, n = 15) during 31 weeks after electrical stimulation. No differences were observed between groups
(mean ± SEM). (D) Behavioral hyperexcitability test. Notice a higher touch-response score in stimulated rats
(SE, n = 15) at week 12 compared with week 6. *p < 0.05. The data are expressed as median and range (min, max).
The behavioral hyperexcitability test was performed at weeks 6 and 12 after stimulation as previously
described11. Animal behavior was assessed in four categories: approach response, touch response, loud noise,
and pick-up. In the approach-response test, a pen that was held vertically was moved slowly toward the face of
the animal. Responses were scored as the following: 1 (no reaction), 2 (sniffing the pen), 3 (moving away from
the pen), 4 (freezing), 5 (jumping away from the pen), and 6 (attacking the pen). In the touch-response test, the
animal was gently prodded in the rump with the blunt end of the pen. Responses were scored as the following:
1 (no reaction), 2 (turning toward the touched area), 3 (moving forward, away from the touch), 4 (freezing), 5
(jerking around toward the touch), 6 (turning away from the touch), and 7 (jumping with or without vocaliza-
tion). In the loud noise test, a clicking noise was generated by a timer, several centimeters above the head of the
animal. Responses were scored as the following: 1 (no reaction), 2 (jumping slightly, flinching, or flicking the
ears), and 3 (jumping abruptly). In the pick-up test, the animal was picked up by grasping it around the body.
Responses were scored as the following: 1 (very easy), 2 (easy with vocalization), 3 (some difficulty, with the
rat rearing and facing the experimenter’s hand), 4 (freezing with or without vocalization), 5 (difficult, with the
rat avoiding the hand by moving away), and 6 (very difficult, with the rat behaving defensively, with or without
Scientific Reports | (2021) 11:8665 | https://doi.org/10.1038/s41598-021-88088-9 3
Vol.:(0123456789)www.nature.com/scientificreports/
attacking the experimenter’s hand). The behavioral hyperexcitability test was repeated four times during 1 day
at 1 h intervals. Median scores were used for the subsequent data analysis.
The open field test and novel object exploration test were performed at weeks 8 and 26 using a square, dark
gray box (1 m × 1 m) as previously described12,13. In the open field test, the animal was placed in the center of the
arena. The rat’s movements were monitored for 30 min. The latency to enter the inner area of the arena, latency
to enter the central area, and speed were monitored during the test. After 30 min of video monitoring animal
was then removed from the arena and placed in a cage for 10 min while the arena was cleaned with 0.1% acetic
acid and an object (black bottle, 2.5 cm diameter, 7 cm height) was placed in the center for the subsequent novel
object exploration test. Novel object exploration test starts after 10 min break. The rat’s movements were moni-
tored for 15 min. In novel object exploration test, the latency to enter the inner area of the arena, the latency to
approach the novel object, and mobility were monitored.
The elevated plus maze test was performed at weeks 8 and 26 after stimulation. A crossed maze was elevated
50 cm above the floor, with two open arms and two closed arms. Each arm was 30 cm long and 5 cm wide, as
previously described14–16. Briefly, the rat was placed in the central area of the maze and monitored for 5 min. The
number of entries into the closed and open arms and speed were monitored during the test.
The Morris water maze test was performed at weeks 9 and 27 after stimulation using a swimming pool (2 m
diameter, 1.5 m height) as previously described9. A platform (6 cm diameter, 50 cm height) was placed in one of
four quadrants of the pool. The pool was filled with water (28 °C) to a depth of 2 cm above the platform. Visual
cues (i.e., black circle and colorful poster) were placed on two opposite walls of the room. The rat’s behavior
was recorded using an Ikegami ICD-505P camera that was placed above the pool, and EthoVision 3.0 software
was used for recording and analysis. The data were exported to Microsoft Excel. The order of the animals was
randomized within trials. The test consisted of 3 days of training (two trials, 60 s each). Memory was tested 48 h
after the last training session. For the test, the platform was removed, and the animals were allowed to swim in
the pool for 1 min. The time to locate the platform was measured during all training days. The time spent over
the platform region, speed, the time spent in the target quadrant, and the time spent in the other quadrants were
monitored during the test. Rodent Data Analysis (RODA) software was used to evaluate swimming strategies17,18.
Morris water maze analysis using RODA software. EthoVision files from the Morris water maze
test were analyzed using RODA 4.0.2 s oftware18, which implements an updated classification procedure based
on a previous study by Gehring et al.17. The same procedure was also applied by Huzard et al.19. For a detailed
protocol, see: https://github.com/RodentDataAnalytics/mwm-ml-gen/wiki (accessed December 4, 2020). This
analysis relies on categorizing the animals’ trajectories into classes of behaviors that are known as strategies that
are implemented to solve the maze (Fig. 1B;17,20).
Briefly, the animal’s trajectories inside the maze were segmented into overlapping segments 12% of which
were manually labeled. RODA software was used to classify the remainder of the segments and map them back to
the original trajectories. We used default tuning as described by Vouros et al. (2018) and the classification results
were manually assessed18. In our analysis we used the following strategies: thigmotaxis (the animal moves along
the periphery of the arena, close to the walls), incursion (the animal starts to move along the inward locations
of the arena), scanning (the animal randomly searches the arena, preferably the central region, and turns away
from the walls if it touches them), focused search (the animal actively searches a particular small region of the
arena that is not where the platform is located), chaining response (the animal memorizes the distance of the
platform from the arena wall and swims in a circular pattern to find it), self-orienting (the animal swims in a
loop and orients itself inside the arena), scanning surroundings (the animal crosses the platform or a region very
close to the platform), and scanning target (the animal actively searches near the platform location; Fig. 1B)17,18.
The remaining segments are classified automatically. Raw data were exported to Microsoft Excel.
In a more detailed analysis behavioral strategies were grouped into low-level strategies and high-level
strategies18,19,21. For example thigmotaxis and incursion were referenced as low-level strategies in Huzard et al.
(2020) similar to the chaining response. However, such strategy groups are usually implemented based on spe-
cific experimental work. For example, in Huzard et al. (2020), the chaining response was listed as a low-level
strategy in the sense that it is “sub-optimal” (i.e., the animal does not use spatial cues to learn the task, and its
learning is adapted to a weak strategy). In the present study, thigmotaxis and incursion were considered low-
level strategies because the animals mostly stayed in areas that were close to the walls of the arena. Scanning,
focused search, chaining response, and self-orienting were classified as medium-level strategies because the
animals explored inner parts of the arena. Scanning surroundings and scanning target were classified as high-
level strategies because the animals passed or were focused on areas of the arena that contained the platform. We
generally expected that impaired animals were likely to underuse medium- and high-level strategies or overuse
low-level strategies. It would be informative to examine whether such behavioral differences are observed in
epileptic animals.
Perfusion. The rats were deeply anesthetized with isoflurane and perfused for histological analysis at week
32 after stimulation. Animals were perfused as previously d escribed9 with some modifications. Sodium chloride
(0.9%, kept on ice) was infused during first 20 min of perfusion followed by cold 4% paraformaldehyde (30 ml/
min), pH 7.4 for the next 10–15 min. The brains were removed from the skull and incubated with 4% paraform-
aldehyde overnight. Next, the brains were cryoprotected in 30% saccharose in 0.02 M potassium phosphate buff-
ered saline (KPBS, pH 7.4) for the next 48 h. The brains were then frozen in dry ice and stored at − 80 °C. Brains
were cryosectioned in the coronal plane and Nissl staining was performed to confirm electrode placements.
Scientific Reports | (2021) 11:8665 | https://doi.org/10.1038/s41598-021-88088-9 4
Vol:.(1234567890)www.nature.com/scientificreports/
Validation cohort. The animal procedure was approved by the Ethical Committee on Animal Research of
the Nencki Institute (Permit No. 483/2013) at the Warsaw Local Ethics Committee for Animal Experimentation
and conducted in accordance with the guidelines established by European Council Directive 2010/63/EU.
Thirteen adult male Sprague–Dawley rats (270–300 g) from Mossakowski Medical Research Centre Polish
Academy of Sciences in Warsaw (Poland) were used as a validation cohort in this study. The validation cohort
consisted of six sham animals and seven stimulated animals in which epilepsy was evoked using electrical stimu-
lation of the amygdala as described above. Animals in the validation cohort were housed under environmentally
enriched conditions with more toys and more frequent handling than the exploration group. All of the animals
in the experiment underwent to the battery of behavioral tests including open field test, novel object exploration
test, elevated plus maze test and Morris water maze test during weeks 8–9 after status epilepticus induction.
Statistical analysis. The statistical analyses were performed using Prism 5 software (GraphPad, San Diego,
CA, USA). Student’s t-test and repeated measures analysis of variance (ANOVA) followed by the Bonferroni
post hoc test were used to analyze the Morris water maze and EEG data. One-way analysis of variance (ANOVA)
followed by the Bonferroni post hoc test was used to analyze the other data. Values of p < 0.05 and p < 0.01 were
considered statistically significant.
Results
Animals wellbeing. To investigate the animals’ general wellbeing, body weight was monitored during the
study. The data are expressed as a percentage of body weight on the day of electrode implantation (i.e., 2 weeks
before stimulation). No differences in percent body weight were found between the sham and stimulated ani-
mals at weeks 0–2 (Fig. 1C). No changes in body weight were observed between sham and stimulated rats at later
time points after stimulation at weeks 5–31 (Fig. 1C).
Influence of amygdala stimulation‑induced status epilepticus on behavior. We did not observe
any differences between sham and stimulated rats in the behavioral hyperexcitability test including approach
response, touch response, loud noise, and pick-up (Fig. 1Dd1–d4). We observed a higher touch-response score
in stimulated rats at week 12 compared with week 6 (median = 2, minimun = 1, maximum = 5 at week 6 vs.
median = 3, mininimum = 1, maximum = 5 at week 12; p < 0.05; Fig. 1Dd2).
We did not detect differences in the open field test between sham and stimulated rats at weeks 8 and 26 includ-
ing the latency to enter inner area of the arena, the latency to enter the central area, and speed (Supplementary
Table S1A).
No changes were observed in the novel object exploration test between sham and stimulated rats at weeks 8
and 26 including the latency to enter the inner area of the arena, the latency to approach the novel object and
mobility (Supplementary Table S1B).
We did not observe differences in the elevated plus maze test between sham and stimulated rats at weeks 8
and 26 including the number of entries into the closed arms, the number of entries into the open arms and speed
(Supplementary Table S1C).
No changes were observed in the Morris water maze between sham and stimulated rats at weeks 9 and 27
including the percent of time spent in the platform region (Q1) during 3 days of training (Fig. 2Aa1, Aa2), swim-
ming time over the platform, speed, time spent in the target quadrant, time spent in quadrant 2, time spent in
quadrant 3, and time spent in quadrant 4 (Supplementary Table S1D).
The principal component analysis of swimming strategies in the Morris water maze test did not separate sham
and stimulated rats, indicating that performance in this test was not markedly disturbed by status epilepticus
(Supplementary Fig. S2A). More detailed analyses of swimming strategies detected some specific impairments.
No significant differences in thigmotaxis, incursion, scanning, focused search, self-orienting, scanning sur-
roundings or scanning target were observed during 3 days of training at week 9 or 27 following status epilepticus
induction (Supplementary Table S3). The analysis of swimming strategies in the Morris water maze on the test
day between sham and stimulated rats at weeks 9 and 27 showed no differences in thigmotaxis, incursion, self-
orienting, scanning surroundings, or scanning target. Interestingly, we observed decreases in scanning at week
9 and week 27 (week 9: 16.6% ± 3.8% vs. 6.9% ± 1.6%, p < 0.05; week 27: 19.24% ± 3.2% vs. 10.7% ± 1.9%, p < 0.05)
in the stimulation group compared with the sham group at both time points. We also observed increases in thig-
motaxis at week 27 (9.8% ± 3.4% vs. 27.1% ± 6.1%, p < 0.05) in the stimulation group compared with the sham
group (Fig. 2Bb1, Bb2). Moreover, a higher proportion of scanning to incursion was observed in the sham group
compared with the stimulation group on the test day at week 9 (1.3% ± 1.2% vs. 0.4% ± 0.5%, p < 0.05; Fig. 2Cc1,
Cc2) but not at week 27 (Fig. 2Cc3, Cc4).
More detailed analysis showed the transition probabilities among all of the strategies. The probabilities of
strategy transitions were checked in the test trials (weeks 9 and 27) in the sham and stimulated groups (Sup-
plementary Fig. S4). At week 9, the sham group transitioned more often from medium- to low-level strategies
(57.4%) and from high- to medium-level strategies (63.2%) compared with the stimulated group (66.7% and
58.9%, respectively). The stimulated group also exhibited a slight preference for transitioning from low- to high-
level strategies (59.0%) compared with the sham group (48.1%). At week 27, the same observations hold true for
the sham group (transitions from high to medium increased to 81.5% and from medium to low to 62.2%) and
the stimulated group (transitions from high to medium increased to 60.8% and from medium to low to 66.7%).
The sham group also exhibited a higher probability of transitions from low- to medium-level strategies (71.1%)
compared with week 9 (51.9%) and week 27 (45.5%) in the stimulated group. Overall, at week 27, the sham group
exhibited a tendency toward transitioning to a medium strategy (81.5% from high to medium and 71.1% from
Scientific Reports | (2021) 11:8665 | https://doi.org/10.1038/s41598-021-88088-9 5
Vol.:(0123456789)www.nature.com/scientificreports/
Figure 2. Performance in the Morris water maze test between sham and stimulated animals. (A) Time to find
the platform (in seconds) in the Morris water maze during training days. No differences were observed at week
9 (a1) and week 27 (a2) (mean ± SD). (B) Analysis of swimming strategy in the Morris water maze on the test
day using RODA software. The stimulated group (SE, n = 15) exhibited a decrease in the number of sections
where they exhibited incursion (IC) and scanning (SC) strategies at weeks 9 and 27 of the experiment compared
with sham animals (n = 12) (b1, b2). *p < 0.05. The focused search (FS) strategy increased at week 9, and
thigmotaxis (TT) increased at week 27 in stimulated animals (SE, n = 15) compared with sham animals (n = 12).
*p < 0.05 (mean ± SEM). (C) Comparison of scanning and incursion strategies in the Morris water maze. A lower
proportion of scanning (SC) to incursion (IC) was observed in stimulated rats (SE, n = 15) compared with the
sham group (n = 12) on the test day at week 9. *p < 0.05 (c1, c2). No differences were observed at week 27 (c3-c4)
(mean ± SD).
low to medium), and the stimulated group exhibited a tendency toward transitioning to lower strategies (60.8%
from high to medium and 66.7% from medium to low; Supplementary Fig. S4).
Influence of speed of epilepsy development on behavior. To measure the speed of epilepsy devel-
opment, we recorded the latency to the first spontaneous seizure. We divided the group of stimulated animals
according to a median split of latency. This division resulted in groups of animals with a short latency (< 20 days,
n = 7) and long latency (> 20 days, n = 8) to the first spontaneous seizure. We did not observe differences between
the sham, short-latency, and long-latency groups in the behavioral hyperexcitability test including approach
response, touch response, loud noise, and pick-up (Supplementary Table S5A).
Scientific Reports | (2021) 11:8665 | https://doi.org/10.1038/s41598-021-88088-9 6
Vol:.(1234567890)www.nature.com/scientificreports/
No differences were observed in the open field test between the sham, short-latency, and long-latency groups
at weeks 8 and 26 including the latency to enter the inner area of the arena, the latency to enter the central area,
and speed (Supplementary Table S5B).
No differences were observed in the novel object exploration test between the sham, short-latency and long-
latency groups at weeks 8 and 26 including the latency to enter the inner area of the arena, the latency to approach
the novel object, and mobility (Supplementary Table S5C).
We did not observe changes in the elevated plus maze test between the sham, short-latency, and long-latency
groups at weeks 8 and 26 including the number of entries into the closed arms, the number of entries into the
open arms, and speed (Supplementary Table S5D).
No differences were observed in the Morris water maze between the sham, short-latency, and long-latency
groups at weeks 9 and 27 including the percent of time spent in the target region (Q1) during 3 days of training
(Fig. 3Aa1, Aa2), swimming time over the platform, speed, time spent in the target quadrant (Fig. 3Aa3, Aa4),
time spent in quadrant 2, time spent in quadrant 3, and time spent in quadrant 4 (Supplementary Table S5E).
The principal component analysis of swimming strategies in the Morris water maze test did not separate the
sham, short-latency and long-latency groups, indicating that performance in this test was not markedly disturbed
by status epilepticus (Supplementary Fig. S2B). More detailed analysis detected some specific impairments.
No significant differences in thigmotaxis, incursion, scanning, focused search, self-orienting, scanning sur-
roundings, or scanning target were observed during 3 days of training at week 9 or 27 following the induction
of status epilepticus (Supplementary Table S6).
Interestingly, the analysis of swimming strategies in the Morris water maze test detected a decrease in scanning
strategy in the short-latency and long-latency groups compared with the sham group at week 9 (16.6% ± 3.8%
vs. 2.8% ± 1.0% vs. 11.0% ± 4.1%, respectively; p < 0.05;Fig. 3Bb1). No differences in the following strategies were
observed between groups at week 27 during the test day including thigmotaxis, incursion, scanning, focused
search, self-orienting, scanning surroundings, and scanning target (Fig. 3Bb1, Bb2). Moreover, a lower proportion
of scanning to incursion was observed in the short-latency group compared with the sham group during the test
day at week 9 (1.3% ± 1.1% vs. 0.2% ± 0.2% vs. 0.7% ± 0.6%, respectively; p < 0.05; Fig. 3Cc1–3).No differences
in proportion of scanning to incrusion between sham, short latency and long latency groups were observed
27 week (Fig. 3Cc4–6). We observed a correlation between latency to the first spontaneous seizure versus scan-
ning strategy at week 9 after stimulation (R = − 0.7088; p < 0.01).
More detailed analyses were conducted to determine the transition probabilities among all strategies. The
probabilities of strategy transitions were checked in test trials (weeks 9 and 27) in the sham, short-latency, and
long-latency groups (Supplementary Fig. S7). At week 9, the probabilities of transitions in the sham group were
51.9% from low- to medium-level, 57.4% from medium- to low-level and 63.2% from high- to medium-level. In
the long-latency group, the probabilities were 58.3% from low- to high-level strategies, 66.7% from medium- to
low-level strategies, and 78.6% from high- to medium-level strategies. In the short-latency group, the prob-
abilities were 59.5% from low- to high-level strategies, 66.7% from medium- to low-level strategies, and 60.7%
from high- to low-level strategies. At week 27, the probabilities in the sham group were 81.5% from high- to
medium-level strategies, 62.2% from medium- to low-level strategies, and 71.1% from low- to medium-level
strategies. In the long-latency group, the probabilities were 57.1% from low- to medium-level strategies, 74.1%
from medium- to low-level strategies, and 69.3% from high- to medium-level strategies. In the short-latency
group, the probabilities were 75.0% from low- to high-level strategies, 55.6% from medium- to low-level strate-
gies, and 54.2% from high- to low-level strategies.
Influence of epilepsy on behavior. To examine whether epilepsy influences behavior, we divided the
cohort of stimulated animals into two groups: stimulated rats that developed spontaneous seizures (n = 7) and
stimulated rats that did not develop spontaneous seizures (n = 8) before the first behavioral tests. We did not
observe differences between the sham, non-epileptic, and epileptic groups in the behavioral hyperexcitability
test including approach, touch response, loud noise, and pick-up (Supplementary Table S8A).
We did not detect changes in the open field test between the sham, non-epileptic, and epileptic groups at
week 8 including the latency to enter the inner area of the arena, the latency to enter the central area, and speed
(Supplementary Table S8B).
No differences were observed in the novel object exploration test between the sham, non-epileptic, and
epileptic groups at week 8 including the latency to enter the inner area of the arena, the latency to approach the
novel object, and mobility (Supplementary Table S8C).
We did not observe differences in the elevated plus maze test between the sham, non-epileptic, and epileptic
groups at week 8 including the number of entries into the closed arms, the number of entries into the open arms,
and speed (Supplementary Table S8D).
No changes in the percent time spent in the target region (Q1)were observed in the Morris water maze test
between the sham, non-epileptic, and epileptic groups at week 9 during 3 days of training (Fig. 4A).
We did not detect differences in Morris water maze performance between the sham, non-epileptic, and epi-
leptic groups at week 9 including swimming time over the platform, speed, time spent in the target quadrant,
time spent in quadrant 2, time spent in quadrant 3, and time spent in quadrant 4 (Supplementary Table S8E).
We found significant differences in swimming strategies in the Morris water maze. The epileptic group
exhibited an increase in thigmotaxis compared with the non-epileptic group at week 9 in the second trial dur-
ing the second day of training (day 2, trial 2: 10.7% ± 7.8% vs. 3.7% ± 8.3%, p < 0.05; Supplementary Table S9).
No differences in thigmotaxis were found between the sham, non-epileptic, and epileptic groups during the
first day, first trial on the second day, and third day of the Morris water maze training days. No significant dif-
ferences in incursion, scanning, focused search, self-orienting, scanning surroundings, or scanning target were
Scientific Reports | (2021) 11:8665 | https://doi.org/10.1038/s41598-021-88088-9 7
Vol.:(0123456789)www.nature.com/scientificreports/
observed between the sham, non-epileptic, and epileptic groups during 3 days of training at week 9 following
status epilepticus induction (Supplementary Table S9). The analysis of swimming strategies in the Morris water
maze on the test day detected a decrease in scanning in the epileptic group compared with the sham group at
week 9 (16.6% ± 3.8% vs. 2.7% ± 1.3%, p < 0.05). No differences were observed in thigmotaxis, incursion, focused
search, self-orienting, scanning surroundings, and scanning target (Fig. 4B). A higher proportion of scanning
to incursion was observed in the epileptic group compared with the sham group during the test day at week 9
(1.3% ± 1.2% vs. 0.6% ± 0.6% vs. 0.2% ± 0.2%, respectively; p < 0.05; Fig. 4Cc1–c3).
Scientific Reports | (2021) 11:8665 | https://doi.org/10.1038/s41598-021-88088-9 8
Vol:.(1234567890)www.nature.com/scientificreports/
◂Figure 3. Performance and swimming strategies in the Morris water maze between sham, long-latency, and
short-latency animals. (A) Time to find the platform and time spent in the target region. No differences were
observed in the time to find the platform (in seconds) during Morris water maze training days at week 9 (a1)
and week 27 (a3). No differences were observed in the time spent in the target region (Q1) at 9 week (a2) and
week 27 (a4) between sham animals (n = 12), stimulated animals (including long- and short-latency animals
together; SE, n = 15), the long-latency group (n = 8), and the short-latency group (n = 7) (mean ± SD). (B)
Analysis of swimming strategy in the Morris water maze on the test day using RODA software. The short-
latency group (n = 7) exhibited a decrease in the number of sections where they presented a scanning (SC)
strategy at week 9 of the experiment compared with sham animals (n = 12) (b1). *p < 0.05. No differences
were observed between the sham, long-latency, and short-latency groups at week 27 (c2) (mean ± SEM). (C)
Comparison of scanning and incursion strategies in the Morris water maze. A higher proportion of scanning
(SC) to incursion (IC) was observed in the sham group (n = 12) compared with the short-latency group (n = 7)
on the test day of the Morris water maze test at week 9 (*p < 0.05) (c1, c3) and week 27 (*p < 0.05) (c4, c6). No
differences were observed between the sham (n = 12) and long-latency (n = 8) groups at week 9 (c1, c2) and week
27 (c4, c5) (mean ± SD).
More detailed analyses showed the probabilities of transitions among strategies in test trials at week 9 after
stimulation in the sham, non-epileptic, and epileptic groups (Supplementary Fig. S10). In the sham group, the
probabilities were 51.9% from low- to medium-level strategies, 57.4% from medium- to low-level strategies, and
63.2% from high to medium-level strategies. In the non-epileptic group, the probabilities were 50% to both the
probabilities from low- to medium and to high-level strategies, 66.7% from medium- to low-level strategies, and
75.0% from high- to medium-level strategies. In the epileptic group, the probabilities were 69.4% from low- to
high-level strategies, 66.7% from medium- to low-level strategies, and 62.5% from high- to low-level strategies.
Influence of epilepsy intensity on behavior. As a measure of the intensity of epilepsy development, we
recorded the total number of spontaneous seizures. We divided the group of stimulated animals according to
a median split of the total number of spontaneous seizures, resulting in a group with a low number of seizures
(62 ± 64.5, n = 8) and a group with a high number of seizures (456 ± 185.0, n = 7).
We did not observe any differences between the sham, low-seizure-number, and high-seizure-number groups
in the behavioral hyperexcitability test including approach response, touch response, loud noise, and pick-up
(Supplementary Table S11A).
No differences were detected in the open field test between the sham, low-seizure-number, and high-seizure-
number groups at weeks 8 and 26 including the latency to enter the inner area of the arena, the latency to enter
the central area, and speed (Supplementary Table S11B).
No differences were observed in the novel object exploration test between the sham, low-seizure-number,
and high-seizure-number groups at weeks 8 and 26 including the latency to enter the inner area of the arena,
the latency to approach the novel object, and mobility (Supplementary Table S11C).
No differences were observed in the elevated plus maze test between the sham, epileptic, low-seizure-number,
and high-seizure-number groups at week 8 including the number of entries into the closed arms (Fig. 5Aa1).
Interestingly, we detected an increase in the number of entries into the closed arms in the high-seizure-number
group compared with the low-seizure-number group at week 26 (19.7 ± 3.3 vs. 35.0 ± 5.1, respectively; p < 0.05;
Fig. 5Aa2). No differences were found between the sham, epileptic, low-seizure-number, and high-seizure-
number groups at weeks 8 and 26 including the number of entries into the open arms (Fig. 5Aa3, Aa4) and
speed (Supplementary Table S11D).
No differences were observed in the Morris water maze between the sham, low-seizure-number, and high-
seizure-number groups at weeks 9 and 27including the percent time spent in the target region (Q1) during 3 days
of training (Fig. 5Bb1, Bb2).
No differences were observed in the Morris water maze test between the sham, low-seizure-number, and
high-seizure-number groups at weeks 9 and 27 including swimming time over the platform, speed, time spent
in the target quadrant, time spent in quadrant 2 (, time spent in quadrant 3, and time spent in quadrant 4 (Sup-
plementary Table S11E).
The principal component analysis of swimming strategies in the Morris water maze did not separate the sham,
low-seizure-number and high-seizure-number groups, indicating that performance in this test was not mark-
edly disturbed by status epilepticus (Supplementary Fig. S2C). A more detailed analysis of swimming strategies
detected some specific impairments.
No significant differences in thigmotaxis, incursion, scanning, focused search, self-orienting, scanning sur-
roundings, or scanning target were found between the sham, low-seizure-number, and high-seizure-number
groups during 3 days of training at week 9 or 27 following status epilepticus induction (Supplementary Table S12).
Interestingly, the analysis of swimming strategies in the Morris water maze test detected an increase in incur-
sion in the high-seizure-number group compared with the sham group at week 9 (16.9% ± 2.4% vs. 21.3% ± 8.5%,
p < 0.05; Fig. 5Cc1). A decrease in scanning was observed in the high-seizure-number group compared with
the sham group at both time points (week 9: 16.6% ± 3.8% vs. 6.1% ± 1.6%, p < 0.05; week 27: 19.2% ± 3.2% vs.
11.9% ± 2.6%, p < 0.05; Fig. 5Cc1, Cc2). No differences were observed in thigmotaxis, incursion, focused search,
self-orienting, scanning surroundings or scanning target (Fig. 5Cc1, Cc2). Moreover, a lower proportion of scan-
ning to incursion was observed in the low-seizure-number group compared with the sham group during the test
day at week 9 (1.3% ± 1.1% vs. 0.3% ± 0.3%, p < 0.05; Fig. 5Dd1–3). Interestingly, a lower proportion of scanning to
incursion in the Morris water maze test day was observed in the high-seizure-number group compared with the
Scientific Reports | (2021) 11:8665 | https://doi.org/10.1038/s41598-021-88088-9 9
Vol.:(0123456789)www.nature.com/scientificreports/
Figure 4. Performance and swimming strategies in the Morris water maze test in sham, non-epileptic, and
epileptic animals at week 9. (A) Performance in the Morris water maze test. No differences were observed in
the time to find the platform (in seconds) during Morris water maze training days at week 9 of the experiment
between sham (n = 12), non-epileptic (n = 8), and epileptic (n = 7) animals (a1) (mean ± SD). (B) Analysis
of swimming strategy on the Morris water maze test day using RODA software. The epileptic group (n = 7)
exhibited a decrease in the number of sections where they presented a scanning (SC) strategy at week 9
compared with the sham group (n = 12). *p < 0.05 (mean ± SEM). (C) Comparison of scanning and incursion
strategies in the Morris water maze. A higher proportion of scanning (SC) to incursion (IC) was observed in the
sham group (n = 12) compared with the epileptic group (n = 7) at week 9. *p < 0.05 (c1, c3). No differences were
observed between sham and non-epileptic animals (n = 8) (c1, c2) (mean ± SD).
sham group at week 27 (0.9% ± 0.8% vs. 0.3% ± 0.3%, p < 0.05; Fig. 5Dd4–6). We observed a correlation between
the number of seizures and scanning strategy at week 9 after stimulation (R = − 0.5322; p < 0.05).
More detailed analyses were conducted to determine transition probabilities among all of the strategies.
Transition probabilities were checked in the test trials (weeks 9 and 27) in the sham, low-seizure-number, and
high-seizure-number groups (Supplementary Fig. S13). At week 9, the probabilities in the sham group were 51.9%
from low- to medium-level strategies, 57.4% from medium- to low-level strategies, and 63.2% from high- to
medium-level strategies. In the low-seizure-number group, the probabilities were to both the probabilities from
low- to medium- and low- to high-level strategies, 66.7% from medium to low-level strategies, and 75.0% from
high- to medium-level strategies. In the high-seizure-number group, the probabilities were 69.4% from low- to
high-level strategies, 66.7% from medium- to low-level strategies, and 62.5% from high- to low-level strategies.
At week 27, the probabilities in the sham group were 81.5% from high-to medium-level strategies, 62.2% from
medium- to low-level strategies, and 71.1% from low- to medium-level strategies. In the low-seizure-number
group, the probabilities were 57.1% from low- to medium-level strategies, 58.3% from medium to low-level
strategies, and 55.0% from high- to medium-level strategies. In the low-seizure-number group, the probabilities
were 75.0% from low- to high-level strategies, 79.2% from medium- to low-level strategies, and 70.8% from
high- to medium-level strategies.
Validation cohort. To examine predictive validity of the behavioral measures we performed a battery of
behavioral tests using a validation cohort that consisted of six sham and seven stimulated animals that were
housed under environmentally enriched conditions.
We did not detect changes in the open field test between the sham and stimulated groups at week 8 including
the latency to enter the inner area of the arena, the latency to enter the central area, and speed (Supplementary
Table S14A).
Scientific Reports | (2021) 11:8665 | https://doi.org/10.1038/s41598-021-88088-9 10
Vol:.(1234567890)www.nature.com/scientificreports/
No differences were observed in the novel object exploration test between the sham and stimulated groups
at week 8 including the latency to enter the inner area of the arena, the latency to approach the novel object, and
mobility (Supplementary Table S14B).
We did not observe differences in the elevated plus maze test between the sham and stimulated groups at
week 8 including the number of entries into the closed arms, the number of entries into the open arms, and
speed (Supplementary Table S14C).
No differences were observed in Morris water maze performance between sham and stimulated groups at
week 9 including swimming time over the platform, speed, time spent in the target quadrant (4), time spent in
quadrant 1, time spent in quadrant 2, and time spent in quadrant 3 (Supplementary Table S14D).
We did not observe differences in thigmotaxis, incursion, scanning, focused search, self-orienting or scanning
surroundings in Morris water maze test between the sham and stimulated groups. However, in the validation
cohort we observed a trend toward an increased thigmotaxis in the stimulated group compared with the sham
group. Stimulated animals also exhibited a trend toward an decreased in scanning strategy. Interestingly, we
observed a significant decrease in the stimulated group compared with the sham animals (17.2 ± 12.0 vs. 4.7 ± 6.0;
p < 0.05; Supplementary Figure S15).
Discussion
The present study investigated the possibility of using common behavioral tests as a source of biomarkers for
use in preclinical studies in the epilepsy field. We were interested in identifying behavioral indices that can dif-
ferentiate epileptic and non-epileptic animals and disease phenotypes. We identified only a few, limited specific
behavioral disturbances that could distinguish these groups. We observed differences between sham and epileptic
animals (but not between stimulated epileptic and stimulated non-epileptic animals) in swimming strategies
during the test session in the Morris water maze and behavioral hyperexcitability test. We also found that epileptic
animals that had a high number of seizures differed from epileptic animals that had a low number of seizures in
the number of entries into the closed arms of the elevated plus maze.
In the present study we performed a battery of behavioral tests, in the following order: behavioral hyperex-
citability test (weeks 6 and 12 after status epilepticus induction), open field test, novel object recognition test,
elevated plus maze test (weeks 8 and 26 after status epilepticus induction) and Morris water maze test (weeks 9
and 27 after status epilepticus induction). Tests were performed in an order from the least to the most stressful
for the animals. Repeated testing can have different impacts on performance in behavioral tests depending on
the treatment group which is unavoidable. Our testing order began from less invasive (and the least stressful)
to the most invasive (and thus most stressful). Animal’s performance was not severely influenced by repeated
testing effect because we saw few differences between groups.
Comparison between sham and stimulated animals. We used a well-characterized model of tempo-
ral lobe epilepsy in rats in which epilepsy is evoked by amygdala s timulation9,10,22–24. Behavioral deficits in the
Morris water maze have been reported in stimulated animals in this model9, but the present study was the first to
conduct a comprehensive panel of behavioral tests to search for noninvasive behavioral biomarkers.
Behavioral and cognitive impairments that result from status epilepticus have been observed in many rat
models of epilepsy. Rats that were subjected to pilocarpine-induced epilepsy exhibited an increase in depressive-
like behavior in a post-seizure behavioral test battery (also called the behavioral hyperexcitability test) 3–4 weeks
after status epilepticus induction11. The strongest reaction was observed in the touch-response and pick-up tests.
Rattka et al. (2013) reported that kainate-treated rats had significantly higher scores in the touch-response and
finger-snap tests than sham-treated c ontrols25. Higher scores in the touch-response test were also observed
between epileptic and sham rats 11–12 weeks after status epilepticus induction26. Similarly, our data showed
higher scores in the touch-response test in stimulated animals 12 weeks after epilepsy induction, suggesting that
rats with seizures had a higher level of anxiety-like behavior than the sham group.
Nissinen et al. (2000) observed spatial learning impairments in epileptic animals in the Morris water maze.
Epileptic animals exhibited impairments in the ability to find the platform compared with control animals during
all 7 days of t raining9. Similarly, Rattka et al. reported that kainate-treated rats had a significantly longer escape
latency during days 3 and 4 of training compared with sham-treated controls 30 weeks after status epilepticus
induction25. Inostroza et al. (2011) also reported a longer escape latency in kainate-treated rats at 3 days of the
experiment, whereas lithium + pilocarpine-treated rats had a longer escape latency at 2 and 3 days of training,
8 weeks after epilepsy i nduction27. In the present study, no changes in escape latency were observed during any
of the training days at weeks 9 and 27 of the experiment, which suggests that the stimulated animals were not
impaired or had significantly less impairment in spatial learning. This may be explained by the fact that behavio-
ral tests are sensitive to specific experimental and environmental conditions, including housing c onditions28–33.
Notably, our animals were housed under environmental enrichment conditions, in contrast to the previous
studies mentioned above.
To analyze Morris water maze performance more closely, we used RODA software to quantitatively analyze the
rats’ learning s trategies17. We observed different swimming strategies in epileptic animals, and their swimming
strategies differed according to the intensity of epilepsy and latency to the first spontaneous seizure. Previous
studies of epilepsy reported behavioral impairments that were caused by epilepsy and epileptogenesis, mainly
reflected by measures of thigmotaxis in the Morris Water Maze test. In the present study, we performed a more
detailed analysis of swimming strategies and found that thigmotaxis in the Morris water maze was indicative of
behavioral and learning impairments. Using the RODA software, we analyzed different swimming strategies and
evaluated differences between different types of strategies. The analysis of different swimming patterns showed
specific significant changes in swimming strategies. The sham group spent more time in the central area of the
Scientific Reports | (2021) 11:8665 | https://doi.org/10.1038/s41598-021-88088-9 11
Vol.:(0123456789)www.nature.com/scientificreports/
pool, exhibiting incursion and scanning strategies. Both of these swimming patterns represent a place strategy
and maze exploration, meaning that the rats actively searched inward areas of the arena because the platform
was located there and moved away from the wall. Stimulated animals spent more time near the wall at week 27
of the experiment and exhibited a thigmotaxis strategy, which was previously reported in epileptic animals34.
The behavior of these rats may suggest place navigation disability or anxiety-like behavior. The receiver operat-
ing characteristic analysis of the ratio between scanning and incursion strategies showed that the stimulated
group spent more time in the outer area of the arena, whereas the sham group spent more time in the inner area,
Scientific Reports | (2021) 11:8665 | https://doi.org/10.1038/s41598-021-88088-9 12
Vol:.(1234567890)www.nature.com/scientificreports/
◂Figure 5. Performance between sham, low-seizure-number, and high-seizure-number groups in the elevated
plus maze test and Morris water maze test (with swimming strategy analysis) 9 and 27 weeks after stimulation.
(A) Performance in the elevated plus maze test. The high-seizure-number group (n = 8) exhibited an increase
in the number of entries into the closed arms in the elevated plus maze test at week 26 compared with the
low-seizure-number group (a2). *p < 0.05. No differences were observed between groups in the number of
entries into the closed arms at week 8 (a1) or the number of entries into the open arms at weeks 8 and 26 of the
experiment (a3, a4) (mean ± SEM). (B) Performance in the Morris water maze. No differences were observed
in the time to find the platform (in seconds) during Morris water maze training days at week 9 (b1) and week
27 (b2) of the experiment between the sham (n = 12), low-seizure-number (n = 7), and high-seizure-number
(n = 8) groups (mean ± SEM). (C) Analysis of swimming strategy on the Morris water maze test day using RODA
software. The high-seizure-number group (n = 8) exhibited an increase in the number of sections where they
presented an incursion (IC) strategy compared with sham animals (c1). *p < 0.05. The high-seizure-number
group (n = 8) exhibited a decrease in the scanning (SC) strategy at week 9 and week 27 of the experiment
compared with the sham group (n = 12) (c1, c2). *p < 0.05 (mean ± SEM). (D) Comparison of scanning and
incursion strategies in the Morris water maze. A higher proportion of scanning (SC) to incursion (IC) was
observed in the sham group (n = 12) compared with the low-seizure-number group (n = 7) on the Morris water
maze test day at week 9 (d1, d2). *p < 0.05. The high-seizure-number group exhibited a lower proportion of
scanning (SC) to incursion (IC) compared with the sham group (n = 12) on the Morris water maze test day at
week 27 (d4, d6). *p < 0.05. No differences were observed between the sham (n = 12) and high-seizure-number
(n = 8) groups at week 9 (d1, d3) or between the sham (n = 12) and low-seizure-number (n = 7) groups at week 27
of the experiment (d4-d5) (mean ± SD).
looking for the platform. As per our expectations, stimulated animals underused medium-level strategies and
overused low-level strategies (see Fig. 2, week 27). Sham animals at both weeks 9 and 27 transitioned slightly
more often from a medium-level strategy to a high-level strategy and less often from a high-level strategy to a
low-level strategy compared with the stimulated group. Based on strategy transitions from low to medium levels
and from low to high levels, little difference was observed in stimulated animals between weeks 9 and 27, whereas
sham animals had a higher probability of ending at a medium-level strategy at week 27. These results showed that
sham animals had a higher probability of making better decisions to find the platform than stimulated animals.
Comparison between sham, long latency and short latency groups. Nissinen et al. (2000) used
the same animal model of temporal lobe epilepsy and found that stimulated animals had a variable latency to
the first spontaneous seizure, which oscillated around week 1 and weeks 2–3 after s timulation9. Little is known
about behavioral differences between rats that have short versus long latencies to develop spontaneous seizures.
We found that alterations of swimming strategies in the Morris water maze depended on the latency to the first
spontaneous seizure. In the standard analysis of the Morris water maze data, we did not observe any significant
differences between sham animals, stimulated animals with a long latency to spontaneous seizures, and stimu-
lated animals with a short latency to spontaneous seizure during all 3 days of training. No differences were found
between groups in the percent time spent in the platform region during the test day. The analysis of swimming
strategies showed that animals with a short latency to the first spontaneous seizure exhibited a decrease in the
scanning strategy compared with sham animals at week 9 of the experiment. Sham-operated animals spent more
time exploring the maze and searching for the platform region than animals with a short latency.
The ratio between scanning and incursion strategies showed that animals with a short latency to the first
spontaneous seizure spent more time in the outer area of the arena at week 9. Overall and similarly to our previ-
ous observation, stimulated animals underuse medium level strategies and overuse low level strategies (see Fig. 2
week 27). These results indicate that the rats’ behavioral strategies in the Morris water maze were related to the
latency to the first spontaneous seizure.
Comparison between sham, non‑epileptic and epileptic groups. We observed behavioral altera-
tions in the Morris water maze in stimulated epileptic animals compared with sham and stimulated non-epi-
leptic animals at week 9 after stimulation. The scanning strategy in epileptic animals significantly decreased
compared with sham animals. Moreover, the ratio between the scanning and incursion strategies indicates that
epileptic animals spent more time in the outer area of the arena, whereas sham animals spent more time search-
ing for the platform. These results suggest that spontaneous seizures affected the rats’ place navigation strategy.
Comparison between sham, low seizures number and high seizures number groups. Nissinen
et al. (2000) used the same animal model of temporal lobe epilepsy and found that epileptic animals could be
divided into subgroups of animals with low and high seizure frequencies. They found that epileptic rats’ swim-
ming navigation depended on seizure frequency. Their data showed that animals with fewer seizures found
the platform faster than animals with more s eizures9. In the present study, the low-seizure-number and high-
seizure-number groups did not differ from the sham group during all training days of the Morris water maze
test at weeks 9 and 27 after stimulation. The analysis of swimming strategy showed that animals with a high
number of seizures exhibited an increase in incursion and a decrease in scanning compared with sham animals.
These results show that the rats’ place navigation strategy depended on seizure frequency. The receiver operating
characteristic analysis of the ratio between scanning and incursion indicated differences between the sham and
high-seizure-number groups, indicating that sham rats spent more time engaged in a scanning strategy at week
27 of the experiment compared with the high-seizure-number group. Interestingly, the ratio between scanning
Scientific Reports | (2021) 11:8665 | https://doi.org/10.1038/s41598-021-88088-9 13
Vol.:(0123456789)You can also read