Proteomic analysis based discovery of a novel biomarker that differentiates intestinal Behçet's disease from Crohn's disease
←
→
Page content transcription
If your browser does not render page correctly, please read the page content below
www.nature.com/scientificreports

                OPEN              Proteomic analysis‑based
                                  discovery of a novel biomarker
                                  that differentiates intestinal
                                  Behçet’s disease from Crohn’s
                                  disease
                                  Jihye Park1,2,6, Daeun Jeong3,4,6, Youn Wook Chung3,5,6, Seunghan Han3,4, Da Hye Kim3,
                                  Jongwook Yu1,2, Jae Hee Cheon1,2,6* & Ji‑Hwan Ryu3,4,6*

                                  Intestinal Behçet’s disease (BD) and Crohn’s disease (CD) present similar manifestations, but
                                  there are no specific diagnostic tests to differentiate them. We used a proteomic approach to
                                  discover novel diagnostic biomarkers specific to intestinal BD. Colon mucosa tissue samples were
                                  obtained from patients with intestinal BD or CD using colonoscopy-guided biopsy of the affected
                                  bowel. Peptides from seven intestinal BD and seven CD patients were extracted and labeled using
                                  tandem mass tag (TMT) reagents. The labeled peptides were identified and quantified using liquid
                                  chromatography-tandem mass spectrometry (LC–MS/MS). The proteins were further validated using
                                  immunohistochemical (IHC) analysis with tissue samples and an ELISA test with serum samples
                                  from 20 intestinal BD and 20 CD patients. Using TMT/LC–MS/MS-based proteomic quantification, we
                                  identified 39 proteins differentially expressed between intestinal BD and CD. Beta-2 glycoprotein 1
                                  (APOH) and maltase-glucoamylase (MGAM) showed higher intensity in the IHC staining of intestinal
                                  BD tissues than in CD tissues. The serum MGAM level was higher in intestinal BD patients. Proteomic
                                  analysis revealed that some proteins were differentially expressed in patients with intestinal BD
                                  compared with those with CD. Differential MGAM expression in intestinal BD suggests its role as a
                                  potential novel diagnostic biomarker.

                                  Abbreviations
                                  BD	Behçet’s disease
                                  CD	Crohn’s disease
                                  IBD	Inflammatory bowel disease
                                  TMT	Tandem mass tag
                                  LC–MS	Liquid chromatography-tandem mass spectrometry
                                  DAIBD	Disease Activity Index for Intestinal Behçet’s Disease
                                  CDAI	Crohn’s Disease Activity Index
                                  IHC	Immunohistochemistry
                                  DAVID	Database for Annotation, Visualization and Integrated Discovery
                                  MGAM	Maltase-glucoamylase
                                  APOH	Beta-2 glycoprotein 1
                                  PLG	Plasminogen
                                  IL16	Interleukin 16
                                  SRSF3	Serine/arginine-rich splicing factor 3

                                  1
                                   Department of Internal Medicine, Yonsei University College of Medicine, 50‑1 Yonsei‑ro, Seodaemun‑gu,
                                  Seoul 03722, Korea. 2Institute of Gastroenterology, Yonsei University College of Medicine, Seoul, Korea. 3Severance
                                  Biomedical Science Institute, Yonsei University College of Medicine, 50‑1 Yonsei‑ro, Seodaemun‑gu, Seoul 03722,
                                  Korea. 4Brain Korea 21 PLUS Project for Medical Science, Yonsei University College of Medicine, Seoul,
                                  Korea. 5Airway Mucus Institute, Yonsei University College of Medicine, Seoul 03722, Korea. 6These authors
                                  contributed equally: Jihye Park, Daeun Jeong, and Youn Wook Chung; Jae Hee Cheon and Ji-Hwan Ryu are
                                  co-corresponding authors. *email: Geniushee@yuhs.ac; yjh@yuhs.ac

Scientific Reports |   (2021) 11:11019                | https://doi.org/10.1038/s41598-021-90250-2                                                 1

                                                                                                                                              Vol.:(0123456789)
www.nature.com/scientificreports/
CLU Clusterin
PPP4C Serine/threonine-protein phosphatase 4 catalytic subunit
KEGG Kyoto Encyclopedia of Genes and Genomes
IPA Ingenuity Pathway Analysis
HLA Human leukocyte antigen
MICA MHC class I related gene A
CRP C-reactive protein
ESR Erythrocyte sedimentation rate
ASCA Anti-Saccharomyces cerevisiae antibodies
AAEA Anti-alpha-enolase antibodies
UC Ulcerative colitis
TB Tuberculosis
ACE Angiotensin-converting enzyme
MT-2 Metallothionein-2
Behçet’s disease (BD) is an idiopathic, chronic, relapsing, multi-systemic vasculitis characterized by recurrent oral
or genital ulcers, arthritis, and ocular, dermal, neurovascular, and gastrointestinal manifestations1,2. Intestinal BD
is diagnosed when a patient with BD has clinical gastrointestinal symptoms and typical endoscopic fi ndings3. It
is a very rare disease, but the prevalence of BD is the highest in countries located along the Silk Road stretching
from Asia to the Mediterranean c ountries4. Crohn’s disease (CD) is a chronic, relapsing, inflammatory, bowel
disease (IBD) that may affect the gastrointestinal tract from the mouth to the anus. Once considered to be a
Western disease, the incidence of CD has rapidly increased in East Asian countries, such as Japan, Korea, and
Hong Kong, while plateauing in the West5,6.
Both intestinal BD and CD often present similar gastrointestinal and extraintestinal manifestations, as well as
endoscopic findings. Therefore, it is sometimes difficult to differentiate between these two diseases. Clinically, oral
and genital ulcerations are more common in intestinal BD patients, and perianal lesions are more common in CD
patients7. However, both diseases develop nonspecific, waxing and waning, life-long gastrointestinal symptoms8.
Moreover, ocular and skin manifestations, and arthropathy, can occur in both d iseases9. Endoscopically, a typical
intestinal BD ulcer is characterized by being single or few in number, round or oval in shape, deep, possessing a
sharp margin, being larger than 10 mm, and showing localization to the ileocecal valve10. The “atypical” intestinal
BD ulcer without the systemic manifestations could be confused with CD. There have been several attempts to
develop a diagnostic biomarker to differentiate between the two diseases, but there are practically no available
tests because of several limitations.
Proteomic analysis is a promising technology that is a powerful tool for identifying biomarkers to help diag-
nose and choose personalized treatment. It allows high-throughput study of protein expression with high accu-
racy, sensitivity, and repeatability, and it enables the identification of molecular mechanisms that are responsible
for the development of a specific d isease11,12. The tandem mass tag (TMT)-liquid chromatography-tandem mass
spectrometric (LC–MS/MS) method has been recently developed to identify and quantify proteins. Although
several studies have investigated colon mucosal biopsies using gel-based proteomic approaches to identify pro-
tein biomarkers that differentiate intestinal BD from I BD13,14, no applicable biomarkers are currently available.
Since gel-free proteomic approaches have several advantages compared to gel-based approaches, particularly for
identifying membrane-bound and/or glycosylated large proteins (e.g., mucins)15, we used gel-free approaches to
analyze intestinal BD proteomes in comparison with CD proteomes.
Here, we aimed to develop diagnostic biomarkers to differentiate between intestinal BD and CD. We employed
a coupled TMT/LC–MS/MS-based method to identify proteins that were differentially expressed between patients
with intestinal BD and CD.
Methods
Study population and sample collection. In total, 47 patients with intestinal BD and 47 patients with
CD were recruited from the IBD Clinic of Severance Hospital, Seoul, Korea. Intestinal BD and CD were diag-
nosed according to clinical, histological, endoscopic, and radiological c riteria16,17. Exclusion criteria included
indeterminate colitis, ulcerative colitis, intestinal tuberculosis, a history of malignancy, or insufficient available
medical records. The intestinal BD ulcer type was defined according to the Korean Inflammatory Bowel Disease
study group, and the CD phenotype was defined according to the Montreal Classification18,19. The severity of
intestinal BD was determined using the Disease Activity Index for Intestinal Behçet’s Disease (DAIBD) score,
and CD severity was determined using the Crohn’s Disease Activity Index (CDAI) s core20,21.
The intestinal mucosa tissue samples were obtained from patients with intestinal BD or CD using colonos-
copy-guided biopsy of the affected bowel. The tissue and serum samples were preserved at −80 °C.
Informed consent was obtained from all individuals enrolled in this study. This study was approved by the
Institutional Review Board of Yonsei University College of Medicine (IRB No: 2012-0039-030) and was conducted
in accordance with the Declaration of Helsinki.
TMT sample processing and protein quantitation. For proteomic analysis, the colon mucosa tissue
samples were lysed and labeled with tandem mass tag (TMT, Thermo Scientific, San Jose, CA, USA) according
to the manufacturer’s instructions. The labeled peptide samples were pooled into a new vial and dried using
SpeedVac (Thermo Scientific). The following processes, including strong cation exchange fraction and liquid
chromatography (LC)-mass spectrometry (MS) and database searching, were performed by Poochon Scientific
(Frederick, MD) as described previously22. Briefly, TMT-multiplex labeled peptide mixture (100 µg protein/each
Scientific Reports | (2021) 11:11019 | https://doi.org/10.1038/s41598-021-90250-2 2
Vol:.(1234567890)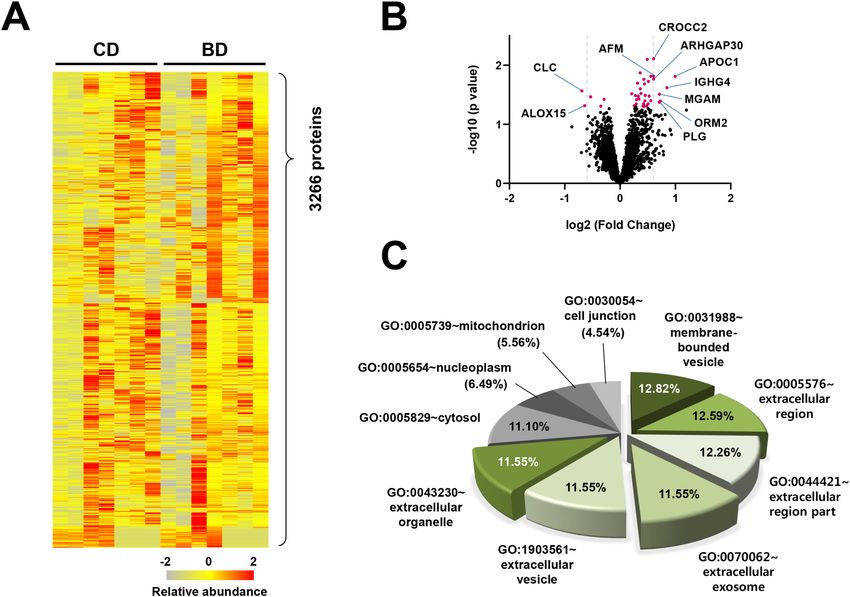
www.nature.com/scientificreports/
plex) fractionation was performed using an Agilent AdvanceBio Column and Agilent UHPLC 1290 system (Agi-
lent, Santa Clara, CA). LC/MS/MS analysis was performed using a Thermo Scientific Q-Exactive hybrid Quad-
rupole-Orbitrap Mass Spectrometer and Thermo Dionex UltiMate 3000 RSLCnano System (Thermo Scientific).
Raw MS data files were searched against the human protein sequence databases obtained from the NCBI website
using Proteome Discoverer 1.4 software (Thermo Scientific) based on the SEQUEST and percolator algorithms.
The false positive discovery rate (FDR) was set at 5%. The resulting Proteome Discoverer Report from Poochon
Scientific contained all assembled proteins with peptide sequences and peptide spectrum match counts (PSM#)
and TMT-tag-based quantification ratios.
Immunohistochemistry (IHC). Formalin-fixed paraffin-embedded colonic biopsy sections from patients
with intestinal BD (n = 20) and those with CD (n = 20) were stained with 39 antibodies and counterstained with
hematoxylin–eosin. Antibodies against APOH (HPA003732) and MGAM (HPA002270) were purchased from
Atlas Antibodies AB (Bromma, Sweden). Detailed antibody information, antibody dilution factors, and antigen
retrieval methods are provided in Supplementary Table I. IHC analysis was performed as previously described23.
Primary antibodies (1:1000 dilution for anti-APOH and 1:2000 dilution for anti-MGAM) were applied over-
night at 4 °C. Staining was visualized using an Olympus BX43 microscope with the Olympus CellSens Entry
software (Hamburg, Germany).
We used a semi-quantitative grading method to assess protein expression, as described p reviously24. Briefly,
100 × magnification was used to grade all fields for each sample, and the staining intensity was scored from 1
to 3. Staining extent was scored from 1 to 4. The scores were multiplied together, and the final scores were clas-
sified as follows: 1–3, weak; 4–8, moderate; and 9–12, strong staining. Fisher’s exact test was used to assess the
immunochemical scores for protein expression. In this particular test, values of p less than 0.2 were determined
as a threshold for moving to the next validation test.
Enzyme‑linked immunosorbent assay (ELISA). Serum samples from patients with BD (n = 20) and
those with CD (n = 20)—constituting an independent cohort of patients distinct from those providing samples
for IHC staining—were analyzed using ELISA. The serum was diluted 1:50,000 for APOH and 1:200 for MGAM.
ELISA was performed according to the manufacturer’s instructions using the APOH ELISA kit (KA0982,
Abnova, Taipei, Taiwan) and the MGA ELISA kit (MBS2021345, MyBioSource, San Diego, CA).
Data analysis and statistical methods. A heat map was generated using the “limma” package for R25.
The fold changes of proteins and p values were calculated using linear regression in “limma.” The heat map
was drawn using the heatmap.2 function in the “gplots” package for R (https://CRAN.R-project.org/package=
gplots), and colors were changed using the “RColorBrewer” package for R (1.1-2. https://CRAN.R-project.org/
package=RColorBrewer). Volcano plots were plotted using GraphPad Prism 8 software. Data were expressed as
the mean ± SEM. Student’s t-test was used for the statistical analysis of serum ELISA data. Statistical significance
was set at p < 0.05.
Result
Descriptive patient characteristics. The colon mucosa tissue samples of 27 patients with intestinal BD
and 27 patients with CD, and serum samples of 20 patients with intestinal BD and 20 patients with CD, were
obtained. Detailed patient characteristics of the 94 patients are shown in Table 1. The mean age of the patients
with intestinal BD and CD was 51. 0 ± 11.4 years and 36. 1 ± 16.0 years (p < 0.001), respectively, which were
comparable to those obtained in a previous study7. A total of 42.6% of the patients with intestinal BD and 74.5%
of the patients with CD were men. The mean disease duration of intestinal BD and CD was 7.1 ± 6.0 years and
8.0 ± 5.5 years, respectively. Oral ulcers, genital ulcers, skin manifestations, and joint manifestations were more
common in patients with intestinal BD and perianal lesions were more common in those with CD. Intestinal
BD ulcers were located in the ileocecal valve (74.5%), ascending colon (10.6%), and postoperative anastomosis
site (14.6%). The intestinal BD ulcers occurred with the following frequency: solitary (48.9%), two (19.1%), and
multiple (31.9%). The CD showed localization in the ileal (14.9%), colonic (2.1%), and ileocolic (83.0%) regions
and could be characterized as non-stricturing and non-penetrating (63.0%), stricturing (15.2%), and penetrat-
ing (21.7%). The number of patients with a DAIBD score ≥ 40 was 35 (74.5%) and that of patients with a CDAI
score ≥ 150 was 24 (51.1%).
Discovery of biomarker candidates using TMT/LC–MS/MS‑based proteomic approach. The
colon mucosa tissue samples of patients with intestinal BD (n = 7) and those with CD (n = 7) were analyzed using
a TMT/LC–MS/MS-based proteomic approach to identify intestinal BD-specific markers (Fig. 1). A total of
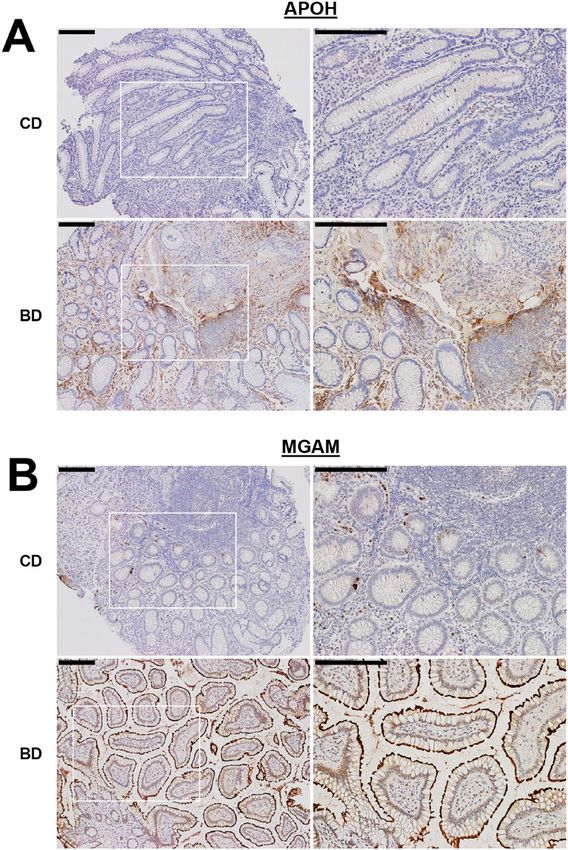
3,266 proteins were quantitatively identified, and at least two identified peptides were detected for each protein
(Fig. 2A). Logistic regression analysis showed that 39 proteins were significantly different between intestinal BD
and CD patients (p < 0.05) (Fig. 2B). Among them, 34 proteins were overexpressed, and 5 proteins were under-
expressed in patients with intestinal BD compared to patients with CD (Table 2). The proteins were classified
by cellular compartment (CC) based on gene ontology (GO) enrichment analysis using a functional annotation
tool (DAVID Bioinformatics Resources, version 6.8) (Supplementary Table II). Among the top ten CC catego-
ries, 72.31% of GO items were associated with membrane-bounded vesicle (GO:0031988), extracellular region
(GO:0005576), extracellular region (GO:0044421), extracellular exosome (GO:0070062), extracellular vesicle
(GO:1903561), and extracellular organelle (GO:0043230), indicating that although there were a certain number
of proteins from other cellular compartments such as the cytosol, nucleoplasm, mitochondrion, or cell junction,
Scientific Reports | (2021) 11:11019 | https://doi.org/10.1038/s41598-021-90250-2 3
Vol.:(0123456789)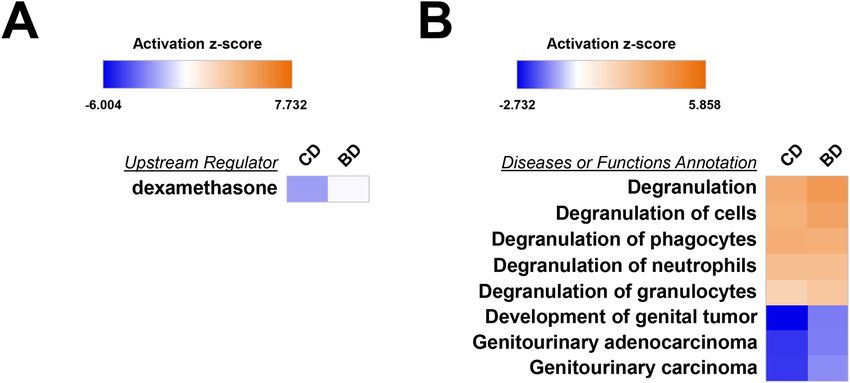
www.nature.com/scientificreports/
Variables Intestinal Behƈet’s disease (n = 47) Crohn’s disease (n = 47) p value
Age (years) 51.0 ± 11.4 36.1 ± 16.0 < 0.001
Males 20 (42.6%) 35 (74.5%) 0.001
Smoking history 12 (25.5%) 11 (23.4%) 0.810
Disease duration (years) 7.1 ± 6.0 8.0 ± 5.5 0.439
Charlson comorbidity index (≥ 2) 8 (17.0%) 2 (4.3%) 0.045
Extraintestinal manifestation
Oral ulcer 16 (41.0%) 0 (0.0%) < 0.001
Genital ulcer 11 (28.2%) 0 (0.0%) < 0.001
Skin manifestation 9 (23.1%) 0 (0.0%) 0.001
Joint manifestation 12 (30.8%) 2 (4.3%) 0.001
Eye manifestation 4 (10.3%) 3 (6.5%) 0.533
Vascular manifestation 1 (2.6%) 0 (0.0%) 0.459
Perianal lesion 1 (2.1%) 28 (59.6%) < 0.001
Disease activity score
Remission (CDAI < 150) 23 (48.9%)
Mild (CDAI : 150–219) 10 (21.3%)
Moderate (CDAI : 220–450) 13 (27.7%)
Severe (CDAI > 450) 1 (2.1%)
Remission (DAIBD < 20) 7 (14.9%)
Mild (DAIBD : 20–39) 5 (10.6%)
Moderate (DAIBD : 40–74) 26 (55.3%)
Severe (DAIBD ≥ 75) 1 (2.1%)
Previous surgery 10 (21.3%) 11 (23.4%) 0.804
Previous medication
Corticosteroid 15 (31.9%) 15 (31.9%) 1.000
Immunomodulator 15 (31.9%) 21 (44.7%) 0.203
Anti-TNFɑ 4 (8.5%) 6 (12.8%) 0.503
Table 1. Baseline characteristics of the study patients. Variables are expressed as mean ± SEM or n (%). BD
Behƈet’s disease, CD Crohn’s disease, TNF tumor necrosis factor, CDAI Crohn’s disease activity index, DAIBD
disease activity index of Behƈet’s disease, SD standard deviation.
a large portion of colon mucosal proteomes were composed of secretion-related proteins (Fig. 2C). Notably,
APOH and MGAM were included in all six secretion-related CC categories in the GO analysis.
IHC validation of biomarker candidates. IHC analysis was performed to validate 39 candidate bio-
markers. A total of 40 colonic biopsy sections from patients with intestinal BD (n = 20) and CD (n = 20) were
stained with each antibody and analyzed using a semi-quantitative grading method as described in the Methods
section. Seven candidate proteins were selected based on their differential expression between intestinal BD
and CD: maltase-glucoamylase (MGAM), beta-2 glycoprotein 1 (APOH), plasminogen (PLG), pro-interleukin
16 (IL16), serine/arginine-rich splicing factor 3 (SRSF3), clusterin (CLU), and serine/threonine-protein phos-
phatase 4 catalytic subunit (PPP4C). Fisher’s exact test showed that APOH (p = 0.039) and MGAM (p = 0.192)
levels were consistently higher in intestinal BD than in CD, suggesting that these two proteins might be dis-
tinctive biomarkers of intestinal BD distinguishing it from CD. There were no significant differences in the
expression of PLG (p = 0.480), IL16 (p = 0.563), SRSF3 (p = 0.591), CLU (p = 1.000), or PPP4C (p = 0.450) between
intestinal BD and CD. IHC analysis of the colon mucosa tissue obtained from patients with intestinal BD showed
that stronger APOH immunoreactivity was detected in a portion of the lamina propria (Fig. 3A, lower panels),
and the MGAM immunoreactive signal was exclusively present in the brush border membrane of the epithelium
(Fig. 3B, lower panels), consistent with previous findings26.
Serum ELISA validation of biomarker candidates. Since APOH and MGAM were included in all
six secretion-related CC categories of GO analysis (Fig. 2C), we hypothesized that these proteins could also
be detected in the blood. This notion was supported by several biochemical studies that identified APOH as a
component of circulating plasma lipoproteins27, and the fact that MGAM is found in brush border membrane
vesicles28. Both proteins were also recently detected in exosomes using in-depth proteomic analyses29. Although
there was no difference in APOH concentration between the two groups (Fig. 4A), serum concentrations of
MGAM were statistically higher in patients with intestinal BD compared to those with CD (p < 0.05), when the
two candidate biomarkers were further tested with serum ELISA in an independent validation cohort (intestinal
BD, n = 20; CD, n = 20) (Fig. 4B). These results suggest that MGAM can be a specific, diagnostic biomarker of
intestinal BD.
Scientific Reports | (2021) 11:11019 | https://doi.org/10.1038/s41598-021-90250-2 4
Vol:.(1234567890)www.nature.com/scientificreports/
Figure 1. The colon mucosa tissue samples were obtained and analyzed using a TMT/LC–MS/MS-based
approach for the discovery cohort (intestinal BD, n = 7; CD, n = 7). Candidate protein biomarker validation was
performed using tissue IHC staining with the validation cohort 1 (intestinal BD, n = 20; CD, n = 20) and serum
ELISA testing with the validation cohort 2 (intestinal BD, n = 20; CD, n = 20).
Analysis of the MGAM‑related pathway in the colon mucosa proteome. The DAVID functional
annotation tool was used to identify the biological pathways of the colon mucosa proteome of intestinal BD and
CD patients, in which MGAM could be involved. The Kyoto Encyclopedia of Genes and Genomes (KEGG) dem-
onstrated that 85 pathways were significantly enriched (p < 0.05) (Fig. 5A). Among them, MGAM was involved
in three enriched pathways: metabolic pathways (hsa01100, 467 proteins), galactose metabolism (hsa00052, 19
proteins), and starch and sucrose metabolism (hsa00500, 17 proteins). Unexpectedly, APOH was not related to
any of the 85 enriched pathways.
To determine whether MGAM and APOH share biological functions, 3,266 proteins were divided into three
GO annotation categories: cellular compartment (CC), molecular function (MF), and biological process (BP).
Next, the categories containing MGAM or APOH were selected and compared. There were six CC categories,
but no MF or BP categories, correlating with both MGAM and APOH as represented in Figs. 2C and 5B–D.
This suggests that the physiological roles of MGAM and APOH might differ in the colon mucosa, but both are
assumed to be secreted.
Predicted upstream regulators and disease‑related functions of MGAM in intestinal BD and
CD. Ingenuity pathway analysis (IPA) was performed to predict canonical pathways, upstream regulators,
and disease-related functions to gain more insight into the pathophysiological role of MGAM in intestinal BD
and CD. As shown in Supplementary Fig. 1A, the only canonical pathway related to MGAM was enriched in
“Glycogen degradation III.” Although absolute z scores (CD, − 0.302; BD, 0.302) were lower than the cut-off
(z-score > 2), the pathway significantly differed between intestinal BD and CD (p < 0.000001). The pathway was
predicted to be inhibited in CD and activated in intestinal BD (Supplementary Fig. 1B). Upstream regulator
analysis revealed that the dexamethasone-related pathway was inactivated in CD compared to its status in intes-
tinal BD (Fig. 6A), but the medication history of corticosteroids (31.9%) was similar between the two patient
groups participating in this study (Table 1). This result is consistent with previous observations that patients with
CD require corticosteroid therapy more often than patients with intestinal BD7. Comparison of the diseases and
functional analyses of the two patient groups revealed that the activation of degranulation and the inactivation
of genitourinary carcinogenesis were conserved, and the former is predicted to be more upregulated in intestinal
BD than in CD, and the latter is more downregulated in CD than in intestinal BD (Fig. 6B).
Scientific Reports | (2021) 11:11019 | https://doi.org/10.1038/s41598-021-90250-2 5
Vol.:(0123456789)www.nature.com/scientificreports/
Figure 2. Proteomic characterization of 14 samples (seven from patients with intestinal BD and seven from
patients with CD) using TMT-10plex labeling-based quantitative proteomics. (A) A heat map showing the
relative abundance of 3266 proteins identified across two groups of human intestinal samples. The color key
indicates the relative abundance of each protein (− 2 to 2) across 14 samples. (B) Volcano plot demonstrating
fold changes in protein abundance between intestinal BD and CD. The x-axis represents the log2 ratio, and the
y-axis represents significant differences (-log10 of p value). Proteins showing significantly altered expression
(p < 0.05) are colored in magenta, and include the top ten up- or down-regulated proteins (fold change > 1.5). (C)
A pie diagram showing cellular localization of human colon mucosa proteomes classified by the top ten cellular
compartments in functional annotation with gene ontology (GO) with secretion-related proteins highlighted in
green.
Discussion
Accurate diagnosis of intestinal BD and CD is important for establishing proper treatment plans and predicting
disease prognosis30. Clinical, laboratory, and endoscopic approaches have limitations in differentiating between
these two diseases. Gastrointestinal and systemic symptoms, elevated inflammatory markers, and endoscopic
findings, such as asymmetric deep ulcers in the ileocecal valve, are often shared between the two diseases in
clinical practice31.
We quantified 3,266 proteins from the colon mucosa tissue samples, identified 39 novel diagnostic biomark-
ers, and validated the MGAM protein as a novel diagnostic biomarker using patient serum samples. To the best
of our knowledge, this study is the first to use proteomics to identify a diagnostic marker that can differentiate
intestinal BD from CD.
Quantitative proteomic analysis using isobaric chemical labeling, including super-stable isotope labeling with
amino acids in cell culture, isobaric tags for relative and absolute quantitation, or TMT, is emerging as a highly
effective approach with good quantification performance and reproducibility for profiling new biomarkers in
numerous diseases32. These relatively new proteomic techniques enable the discovery of diagnostic biomarkers
by providing methods not only for peptide identification, but also for the quantification of biological samples.
Thus far, they have been applied to I BD33 or intestinal T
B24, but not to intestinal BD. We identified 39 potential
novel diagnostic biomarkers using quantitative proteomic analysis, and validated MGAM as a biomarker for
differentiating intestinal BD from CD.
MGAM is involved in carbohydrate digestion in the small intestine. MGAM deficiency has been reported
in congenital diarrheal d iseases34. MGAM and sucrase-isomaltase (SI) have identical exon structures. They
are anchored in the small intestinal mucosal brush border and hydrolyze substrates to g lucose35. Romach et al.
reported a trinitrobenzene sulfonic acid-induced colitis rat model that showed a loss of SI expression and
Scientific Reports | (2021) 11:11019 | https://doi.org/10.1038/s41598-021-90250-2 6
Vol:.(1234567890)www.nature.com/scientificreports/
UniProt Entry name Protein (full name) UniProt Accession # Gene name Ratio (CD/BD) p value AUC
APOC1_HUMAN Apolipoprotein C-I P02654 APOC1 0.43 0.015 0.7755
IGHG4_HUMAN Immunoglobulin heavy constant gamma 4 P01861 IGHG4 0.54 0.024 0.8163
PLMN_HUMAN Plasminogen P00747 PLG 0.61 0.042 0.8776
AFAM_HUMAN Afamin P43652 AFM 0.61 0.015 0.7347
RHG30_HUMAN Rho GTPase-activating protein 30 Q7Z6I6 ARHGAP30 0.61 0.017 0.7347
A1AG2_HUMAN Alpha-1-acid glycoprotein 2 P19652 ORM2 0.62 0.040 0.7959
MGA_HUMAN Maltase-glucoamylase, intestinal O43451 MGAM 0.63 0.031 0.7551
CRCC2_HUMAN Putative ciliary rootlet coiled-coil protein 2 H7BZ55 CROCC2 0.66 0.008 0.8367
ZA2G_HUMAN Zinc-alpha-2-glycoprotein P25311 AZGP1 0.66 0.040 0.7755
ACE_HUMAN Angiotensin-converting enzyme P12821 ACE 0.67 0.015 0.8016
APOH_HUMAN Beta-2-glycoprotein 1 P02749 APOH 0.68 0.033 0.8061
GILT_HUMAN Gamma-interferon-inducible lysosomal thiol reductase P13284 IFI30 0.69 0.019 0.7959
NHRF1_HUMAN Na( +)/H( +) exchange regulatory cofactor NHE-RF1 O14745 SLC9A3R1 0.69 0.008 0.7959
VTDB_HUMAN Vitamin D-binding protein P02774 GC 0.70 0.045 0.7347
CLUS_HUMAN Clusterin P10909 CLU 0.70 0.049 0.7347
LOX5_HUMAN Arachidonate 5-lipoxygenase P09917 ALOX5 0.71 0.040 0.7959
LRRF1_HUMAN Leucine-rich repeat flightless-interacting protein 1 Q32MZ4 LRRFIP1 0.71 0.033 0.7959
JUPI1_HUMAN Jupiter microtubule associated homolog 1 Q9UK76 JPT1 0.72 0.049 0.8163
IL16_HUMAN Pro-interleukin-16 Q14005 IL16 0.72 0.021 0.7755
C1S_HUMAN Complement C1s subcomponent P09871 C1S 0.73 0.017 0.8776
ASH2L_HUMAN Set1/Ash2 histone methyltransferase complex subunit ASH2 Q9UBL3 ASH2L 0.76 0.049 0.4959
SRSF2_HUMAN Serine/arginine-rich splicing factor 2 Q01130 SRSF2 0.76 0.030 0.8571
SRSF3_HUMAN Serine/arginine-rich splicing factor 3 P84103 SRSF3 0.77 0.037 0.7959
ITA5_HUMAN Integrin alpha-5 P08648 ITGA5 0.77 0.025 0.7755
PP4C_HUMAN Serine/threonine-protein phosphatase 4 catalytic subunit P60510 PPP4C 0.77 0.033 0.7347
AKP13_HUMAN A-kinase anchor protein 13 Q12802 AKAP13 0.77 0.045 0.7551
TARA_HUMAN TRIO and F-actin-binding protein Q9H2D6 TRIOBP 0.77 0.013 0.8571
LMNB1_HUMAN Lamin-B1 P20700 LMNB1 0.78 0.037 0.7755
TOIP2_HUMAN Torsin-1A-interacting protein 2 Q8NFQ8 TOR1AIP2 0.80 0.020 0.9184
Arf-GAP with coiled-coil, ANK repeat and PH domain-containing protein
ACAP2_HUMAN Q15057 ACAP2 0.82 0.045 0.8163
2
PLEC_HUMAN Plectin Q15149 PLEC 0.82 0.038 0.7755
SMRC2_HUMAN SWI/SNF complex subunit SMARCC2 Q8TAQ2 SMARCC2 0.83 0.033 0.8571
LRRF2_HUMAN Leucine-rich repeat flightless-interacting protein 2 Q9Y608 LRRFIP2 0.84 0.048 0.7857
NU205_HUMAN Nuclear pore complex protein Nup205 Q92621 NUP205 0.87 0.030 0.8776
IMPA2_HUMAN Inositol monophosphatase 2 O14732 IMPA2 1.22 0.038 0.7245
DMD_HUMAN Dystrophin P11532 DMD 1.26 0.049 0.7959
PERE_HUMAN Eosinophil peroxidase P11678 EPX 1.44 0.034 0.8163
LOX15_HUMAN Arachidonate 15-lipoxygenase P16050 ALOX15 1.53 0.048 0.7755
LEG10_HUMAN Galectin-10 Q05315 CLC 1.59 0.027 0.8367
Table 2. Candidate protein biomarkers for differential diagnosis between intestinal Behƈet’s disease and
Crohn’s disease. BD Behƈet’s disease, CD Crohn’s disease, AUCarea under the curve.
a ctivity36. Lackeyram et al. observed that a dextran sodium sulfate-induced colitis piglet model revealed decreased
maximal specific activities of MGAM and S I37. Here, the tissue expression and serum concentrations of MGAM
were lower in patients with CD patients than in those with intestinal BD. Our IPA analysis also predicted that
the MGAM-related “glycogen degradation III” pathway was inactivated in CD (Supplementary Fig. 1A,B). Con-
sistent with our findings, the involvement of the small intestine is relatively common in CD than in intestinal
BD, resulting in digestive problems and nutrient malabsorption. Thus, differential MGAM expression may be
related to different clinical manifestations between intestinal BD and CD, which should be further validated.
MGAM has been shown to be important in neutrophil biology but not in lymphocytes38,39. We identified
MGAM in the colon mucosa tissue samples, but MGAM was also detected in the serum samples. The detected
serum MGAM may be secreted from the gastrointestinal tract or contained in neutrophils. All five degranulation-
related pathways (degranulation, degranulation of cells, degranulation of phagocytes, degranulation of neutro-
phils, and degranulation of granulocytes) enriched in the disease or functional annotations with high activation
z-score indicated that MGAM might be involved in the degranulation process in which mast cell activation is
essential. Although little is known regarding the degranulation in intestinal BD, degranulation signaling in IBD
has been implicated in the regulation of inflammatory responses in the gastrointestinal tract, where the largest
Scientific Reports | (2021) 11:11019 | https://doi.org/10.1038/s41598-021-90250-2 7
Vol.:(0123456789)www.nature.com/scientificreports/
Figure 3. APOH and MGAM expression in the colonic mucosa. Tissue sections from patients with CD or BD
stained with antibodies against APOH (A) or MGAM (B). The selected areas denoted by white boxes in left
panels (original magnification, 100 ×) are enlarged in the right panels (200 ×). Scale bar, 200 µm.
Figure 4. Serum APOH and MGAM protein expression detected using ELISA in intestinal BD patients (A) and
CD patients (B). Results are mean ± SEM; ***p < 0.001. n = 20 patients per each group.
Scientific Reports | (2021) 11:11019 | https://doi.org/10.1038/s41598-021-90250-2 8
Vol:.(1234567890)www.nature.com/scientificreports/
Figure 5. MGAM and APOH characterization in human colon mucosal proteomes. (A) Significant biological
pathways enriched among 3,266 proteins identified by TMT are represented as bar graphs (p < 0.05) with the
MGAM-containing categories highlighted in red. Venn diagrams showing numbers of MGAM-and APOH-
containing categories classified by cellular compartment (B), molecular function (C), and biological process (D)
based on functional annotation with gene ontology (GO) analysis.
population of mast cells in the body r esides40–43. Higher MGAM levels were detected in intestinal BD patients
than in CD patients, and this was related to innate immunity pathogenesis. Further studies are required to
understand how MGAM influences immune cell degranulation and the resulting gut inflammation. Moreover,
it would be valuable to determine whether MGAM levels correlate with the disease activity of intestinal BD.
Here, MGAM was shown to differentiate BD from CD with an area under the curve of 0.805 (95% confidence
interval, 0.665–0.945), 85% sensitivity, and 70% specificity at a cut-off of 150 ng/mL (Fig. 7). However, further
studies with a larger sample size are warranted to validate our data on the role of MGAM in chronic enterocolitis
and to understand its molecular mechanism in depth. In addition, a significant proportion of our CD cohort
population had perianal involvement, which distinguishes CD from intestinal BD. Perianal lesions in CD occur
more frequently in Korea than in Western countries, but the ideal cohort population for the development of
diagnostic biomarkers should present common or resembling clinical, endoscopic, radiologic, and histologic
features of the two diseases. Future studies using such a cohort will be needed to validate MGAM as a distin-
guishing diagnostic biomarker. Finally, the measurement of MGAM levels in a variety of inflammatory diseases
such as ulcerative colitis and intestinal tuberculosis could be worthwhile.
In summary, we used TMT-based proteomic quantification to identify 39 candidate proteins that were dif-
ferentially expressed between intestinal BD and CD. Then, we selected APOH and MGAM proteins as possible
biomarkers for intestinal BD based on the results of IHC staining and semi-quantitative grading. Finally, we
suggest that the levels of MGAM protein in patient serum can potentially be used to differentially diagnose
intestinal BD from CD.
Scientific Reports | (2021) 11:11019 | https://doi.org/10.1038/s41598-021-90250-2 9
Vol.:(0123456789)www.nature.com/scientificreports/
Figure 6. Ingenuity pathway analysis (IPA) of the MGAM-related upstream regulator (A) and disease
or functional annotations (B) in colon mucosa proteomes of internal BD and CD. IPA core analyses were
performed for a proteomic comparison between internal BD and CD using 3,614 UniProt accession numbers.
Significant MGAM-related functional annotations are shown (z-score > 2, p < 0.05). Heat maps illustrating the
predicted activation z-score. The color range indicates its predicted activation state: increasing (orange) or
decreasing (blue).
Figure 7. Receiver operating characteristic (ROC) curve showing the prediction of differentially diagnosing
intestinal BD from CD using serum MGAM protein expression detected using ELISA.
Received: 18 November 2020; Accepted: 5 May 2021
References
1. Sakane, T., Takeno, M., Suzuki, N. & Inaba, G. Behcet’s disease. N. Engl. J. Med. 341, 1284–1291. https://doi.org/10.1056/NEJM1
99910213411707 (1999).
Scientific Reports | (2021) 11:11019 | https://doi.org/10.1038/s41598-021-90250-2 10
Vol:.(1234567890)www.nature.com/scientificreports/
2. James, D. G. Behcet’s syndrome. N. Engl. J. Med. 301, 431–432. https://doi.org/10.1056/NEJM197908233010811 (1979).
3. Lee, H. J. & Cheon, J. H. Optimal diagnosis and disease activity monitoring of intestinal Behcet’s disease. Intest. Res. 15, 311–317.
https://doi.org/10.5217/ir.2017.15.3.311 (2017).
4. Bayraktar, Y., Ozaslan, E. & Van Thiel, D. H. Gastrointestinal manifestations of Behcet’s disease. J. Clin. Gastroenterol. 30, 144–154.
https://doi.org/10.1097/00004836-200003000-00006 (2000).
5. Mak, W. Y., Zhao, M., Ng, S. C. & Burisch, J. The epidemiology of inflammatory bowel disease: East meets west. J. Gastroenterol.
Hepatol. https://doi.org/10.1111/jgh.14872 (2019).
6. Park, S. H. et al. A 30-year trend analysis in the epidemiology of inflammatory bowel disease in the Songpa-Kangdong District of
Seoul, Korea in 1986–2015. J. Crohns Colitis 13, 1410–1417. https://doi.org/10.1093/ecco-jcc/jjz081 (2019).
7. Jung, Y. S. et al. Long-term clinical outcomes of Crohn’s disease and intestinal Behcet’s disease. Inflamm. Bowel. Dis. 19, 99–105.
https://doi.org/10.1002/ibd.22991 (2013).
8. Yazici, Y., Yurdakul, S. & Yazici, H. Behcet’s syndrome. Curr. Rheumatol. Rep. 12, 429–435. https://doi.org/10.1007/s11926-010-
0132-z (2010).
9. Valenti, S., Gallizzi, R., De Vivo, D. & Romano, C. Intestinal Behcet and Crohn’s disease: Two sides of the same coin. Pediatr.
Rheumatol. Online J. 15, 33. https://doi.org/10.1186/s12969-017-0162-4 (2017).
10. Lee, C. R. et al. Colonoscopic findings in intestinal Behcet’s disease. Inflamm. Bowel. Dis. 7, 243–249. https://doi.org/10.1097/
00054725-200108000-00010 (2001).
11. Gisbert, J. P. & Chaparro, M. Clinical usefulness of proteomics in inflammatory bowel disease: A comprehensive review. J. Crohns
Colitis 13, 374–384. https://doi.org/10.1093/ecco-jcc/jjy158 (2019).
12. Titz, B. et al. Proteomics and lipidomics in inflammatory bowel disease research: From mechanistic insights to biomarker identi-
fication. Int. J. Mol. Sci. https://doi.org/10.3390/ijms19092775 (2018).
13. Lee, H. J. et al. Proteomic analysis of serum amyloid a as a potential marker in intestinal Behcet’s disease. Dig. Dis. Sci. 62,
1953–1962. https://doi.org/10.1007/s10620-017-4606-y (2017).
14. Lee, H. J. et al. Proteomics-based functional studies reveal that galectin-3 plays a protective role in the pathogenesis of intestinal
Behcet’s disease. Sci. Rep. 9, 11716. https://doi.org/10.1038/s41598-019-48291-1 (2019).
15. Rabilloud, T. Membrane proteins and proteomics: Love is possible, but so difficult. Electrophoresis 30(Suppl 1), S174-180. https://
doi.org/10.1002/elps.200900050 (2009).
16. Skef, W., Hamilton, M. J. & Arayssi, T. Gastrointestinal Behcet’s disease: A review. World J. Gastroenterol. 21, 3801–3812. https://
doi.org/10.3748/wjg.v21.i13.3801 (2015).
17. Maaser, C. et al. ECCO-ESGAR Guideline for Diagnostic Assessment in IBD Part 1: Initial diagnosis, monitoring of known IBD,
detection of complications. J. Crohns Colitis 13, 144–164. https://doi.org/10.1093/ecco-jcc/jjy113 (2019).
18. Satsangi, J., Silverberg, M. S., Vermeire, S. & Colombel, J. F. The Montreal classification of inflammatory bowel disease: Contro-
versies, consensus, and implications. Gut 55, 749–753. https://doi.org/10.1136/gut.2005.082909 (2006).
19. Cheon, J. H. et al. Development and validation of novel diagnostic criteria for intestinal Behcet’s disease in Korean patients with
ileocolonic ulcers. Am. J. Gastroenterol. 104, 2492–2499. https://doi.org/10.1038/ajg.2009.331 (2009).
20. Cheon, J. H. et al. Development, validation, and responsiveness of a novel disease activity index for intestinal Behcet’s disease.
Inflamm. Bowel. Dis. 17, 605–613. https://doi.org/10.1002/ibd.21313 (2011).
21. Best, W. R., Becktel, J. M., Singleton, J. W. & Kern, F. Jr. Development of a Crohn’s disease activity index. National Cooperative
Crohn’s Disease Study. Gastroenterology 70, 439–444 (1976).
22. Chung, Y. W. et al. Targeted disruption of PDE3B, but not PDE3A, protects murine heart from ischemia/reperfusion injury. Proc.
Natl. Acad. Sci. USA 112, E2253-2262. https://doi.org/10.1073/pnas.1416230112 (2015).
23. Chung, Y. W. et al. Apolipoprotein E and periostin are potential biomarkers of nasal mucosal inflammation a parallel approach of
in vitro and in vivo secretomes. Am. J. Respir. Cell Mol. Biol. 62, 23–34. https://doi.org/10.1165/rcmb.2018-0248OC (2020).
24. Rukmangadachar, L. A. et al. Proteome analysis of the macroscopically affected colonic mucosa of Crohn’s disease and intestinal
tuberculosis. Sci. Rep. 6, 23162. https://doi.org/10.1038/srep23162 (2016).
25. Ritchie, M. E. et al. limma powers differential expression analyses for RNA-sequencing and microarray studies. Nucl. Acids Res.
43, e47. https://doi.org/10.1093/nar/gkv007 (2015).
26. Sukumaran, S. K. et al. Taste cell-expressed alpha-glucosidase enzymes contribute to gustatory responses to disaccharides. Proc.
Natl. Acad. Sci. USA 113, 6035–6040. https://doi.org/10.1073/pnas.1520843113 (2016).
27. Lee, N. S., Brewer, H. B. Jr. & Osborne, J. C. Jr. beta 2-glycoprotein I. Molecular properties of an unusual apolipoprotein, apolipo-
protein H. J. Biol. Chem. 258, 4765–4770 (1983).
28. Naim, H. Y., Sterchi, E. E. & Lentze, M. J. Structure, biosynthesis, and glycosylation of human small intestinal maltase-glucoamylase.
J. Biol. Chem. 263, 19709–19717 (1988).
29. Principe, S. et al. In-depth proteomic analyses of exosomes isolated from expressed prostatic secretions in urine. Proteomics 13,
1667–1671. https://doi.org/10.1002/pmic.201200561 (2013).
30. Limsrivilai, J. & Pausawasdi, N. Intestinal tuberculosis or Crohn’s disease: A review of the diagnostic models designed to differenti-
ate between these two gastrointestinal diseases. Intest. Res. https://doi.org/10.5217/ir.2019.09142 (2020).
31. Kim, J. M. & Cheon, J. H. Pathogenesis and clinical perspectives of extraintestinal manifestations in inflammatory bowel diseases.
Intest. Res. https://doi.org/10.5217/ir.2019.00128 (2020).
32. Li, Z. et al. Systematic comparison of label-free, metabolic labeling, and isobaric chemical labeling for quantitative proteomics on
LTQ Orbitrap Velos. J. Proteome Res. 11, 1582–1590. https://doi.org/10.1021/pr200748h (2012).
33. Starr, A. E. et al. Proteomic analysis of ascending colon biopsies from a paediatric inflammatory bowel disease inception cohort
identifies protein biomarkers that differentiate Crohn’s disease from UC. Gut 66, 1573–1583. https://doi.org/10.1136/gutjnl-2015-
310705 (2017).
34. Canani, R. B. & Terrin, G. Recent progress in congenital diarrheal disorders. Curr. Gastroenterol. Rep. 13, 257–264. https://doi.
org/10.1007/s11894-011-0188-6 (2011).
35. Nichols, B. L. et al. The maltase-glucoamylase gene: Common ancestry to sucrase-isomaltase with complementary starch digestion
activities. Proc. Natl. Acad. Sci. USA 100, 1432–1437. https://doi.org/10.1073/pnas.0237170100 (2003).
36. Amit-Romach, E., Reifen, R. & Uni, Z. Mucosal function in rat jejunum and ileum is altered by induction of colitis. Int. J. Mol.
Med. 18, 721–727 (2006).
37. Lackeyram, D., Mine, Y., Archbold, T. & Fan, M. Z. The small intestinal apical hydrolase activities are decreased in the piglet with
bowel inflammation induced by dextran sodium sulfate. J. Anim. Sci. 90(Suppl 4), 287–289. https://doi.org/10.2527/jas.54010
(2012).
38. Ericson, J. A. et al. Gene expression during the generation and activation of mouse neutrophils: Implication of novel functional
and regulatory pathways. PLoS ONE 9, e108553. https://doi.org/10.1371/journal.pone.0108553 (2014).
39. Dreyfus, J. C. & Poenaru, L. Alpha glucosidases in white blood cells, with reference to the detection of acid alpha 1–4 glucosidase
deficiency. Biochem. Biophys. Res. Commun. 85, 615–622. https://doi.org/10.1016/0006-291x(78)91207-x (1978).
40. Crowe, S. E., Luthra, G. K. & Perdue, M. H. Mast cell mediated ion transport in intestine from patients with and without inflam-
matory bowel disease. Gut 41, 785–792. https://doi.org/10.1136/gut.41.6.785 (1997).
41. He, S. H. Key role of mast cells and their major secretory products in inflammatory bowel disease. World J. Gastroenterol. 10,
309–318. https://doi.org/10.3748/wjg.v10.i3.309 (2004).
Scientific Reports | (2021) 11:11019 | https://doi.org/10.1038/s41598-021-90250-2 11
Vol.:(0123456789)www.nature.com/scientificreports/
42. Hamilton, M. J., Frei, S. M. & Stevens, R. L. The multifaceted mast cell in inflammatory bowel disease. Inflamm. Bowel Dis. 20,
2364–2378. https://doi.org/10.1097/MIB.0000000000000142 (2014).
43. Albert-Bayo, M. et al. Intestinal mucosal mast cells: Key modulators of barrier function and homeostasis. Cells https://doi.org/10.
3390/cells8020135 (2019).
Acknowledgements
This work was supported by the Bio & Medical Technology Development Program of the National Research
Foundation of Korea (NRF) funded by the Ministry of Science, ICT & Future Planning (2017M3A9F3041229
to J.-H.R.) and by a Grant from the Korea Health Technology R&D Project through the Korea Health Industry
Development Institute (KHIDI), funded by the Ministry of Health & Welfare, Republic of Korea (HI18C0094
to J.H.C.).
Author contributions
Guarantor of the article: J.H.C. and J.-H.R. Development of study concept and design: Y.W.C. and J.H.C. Study
supervision: J.H.C. and J.-H.R. Acquisition data: J.P., D.J., Y.W.C., S.H., D.H.K., and J.Y.. Data analysis and inter-
pretation of data: J.P., D.J., S.H., and Y.W.C.. Drafting of the manuscript: J.P., D.J., and Y.W.C. Critical revision of
the manuscript for important intellectual content: J.H.C. and J.-H.R.
Competing interests
The authors declare no competing interests.
Additional information
Supplementary Information The online version contains supplementary material available at https://doi.org/
10.1038/s41598-021-90250-2.
Correspondence and requests for materials should be addressed to J.H.C. or J.-H.R.
Reprints and permissions information is available at www.nature.com/reprints.
Publisher’s note Springer Nature remains neutral with regard to jurisdictional claims in published maps and
institutional affiliations.
Open Access This article is licensed under a Creative Commons Attribution 4.0 International
License, which permits use, sharing, adaptation, distribution and reproduction in any medium or
format, as long as you give appropriate credit to the original author(s) and the source, provide a link to the
Creative Commons licence, and indicate if changes were made. The images or other third party material in this
article are included in the article’s Creative Commons licence, unless indicated otherwise in a credit line to the
material. If material is not included in the article’s Creative Commons licence and your intended use is not
permitted by statutory regulation or exceeds the permitted use, you will need to obtain permission directly from
the copyright holder. To view a copy of this licence, visit http://creativecommons.org/licenses/by/4.0/.
© The Author(s) 2021
Scientific Reports | (2021) 11:11019 | https://doi.org/10.1038/s41598-021-90250-2 12
Vol:.(1234567890)You can also read