Evidence for strong environmental control on bacterial microbiomes of Antarctic springtails - Nature
←
→
Page content transcription
If your browser does not render page correctly, please read the page content below
www.nature.com/scientificreports
OPEN Evidence for strong environmental
control on bacterial microbiomes
of Antarctic springtails
Chiara Leo1,5*, Francesco Nardi1, Claudio Cucini1, Francesco Frati1, Peter Convey2,
James T. Weedon3, Dick Roelofs4 & Antonio Carapelli1
Collembola are a key component of the soil biota globally, playing an important role in community
and ecosystem dynamics. Equally significant are their associated microbiomes, that can contribute to
key metabolic functions. In the present study, we investigated the bacterial community composition
of four Antarctic springtail species to assess if and how the extreme Antarctic environment has shaped
the collembolans’ microbiomes. Springtails were collected from two biogeographical regions, the
maritime and the continental Antarctic. From each region, two endemic species, belonging to the
genera Cryptopygus (Isotomidae, Entomobryomorpha) and Friesea (Neanuridae, Poduromorpha),
were included. This experimental design allowed us to quantify the relative importance of ecological
factors (different regions of occurrence) and/or phylogenetic divergence in the host (different Orders)
in shaping the Collembola microbiome. The diversity and richness of springtail microbiomes was
lower in the Antarctic taxa compared to published information from species from temperate regions.
The microbiome composition was predominantly species-specific, with a limited core microbiome
shared across the four species examined. While both geographic origin and host species influenced
the associated microbiomes, the former was the prevalent driver, with closer similarity between
springtails from the same bioregion than between those belonging to the same genus.
The Collembola (springtails) is one of the richest taxa of basal Hexapoda and, due to their important role in
soil ecosystem functioning, one of the most studied components of the soil fauna. Since springtails can feed on
fungal hyphae, bacteria, algae, mosses, spores and decaying organic matter, their effects on soil dynamics can
be direct (e.g., by producing/feeding on organic matter) or indirect (e.g., by influencing microbial activity and
community composition by grazing)1–6. Despite the importance of springtails for soil dynamics, few studies
to date have investigated their associated microbiomes, thus limiting our knowledge of the various metabolic,
physiological and immunological functions to which the microbiota may contribute. In this respect, the study
of the microbiomes associated with Antarctic springtails, adapted to extreme and almost pristine environments,
may provide an important advance in understanding of bacterial contribution to springtail biology and, in turn,
to Antarctic terrestrial ecosystem functioning.
Antarctic terrestrial ecosystems experience some of the harshest conditions on our planet, with habitats
(permanently or seasonally snow- and ice-free areas) limited to less than 0.3% of the continent’s a rea7–10. Three
main biogeographic regions are generally recognised in Antarctica: the sub-, maritime and continental Antarctic7.
The latter two experience the harshest climatic conditions, with chronically low to very low temperatures, often
ater7–9.
low annual precipitation and limited availability of liquid w
Examination of Antarctic springtail microbiomes may shed new light on the evolutionary adaptation to
the abiotic stresses that typify Antarctica’s extreme and isolated ecosystems9,11, as well as allowing the identi-
fication of currently unknown biotic associations. Existing studies of springtail microbiomes have suggested
that they are characterised by the dominance of Acidobacteria, Actinobacteria, Bacteroidetes, Firmicutes and
Proteobacteria12–15. It has also been suggested that some of these taxa may play a role in antibiotic production,
the provision of metabolic pathways for nitrogen and terpene metabolism, and the production of chitinases nec-
essary for the digestion of food components12–14. Nevertheless, the application of Next Generation Sequencing
(NGS) techniques to study springtail-associated microbiomes has to date mostly focused on model species from
1
Life Science Department, University of Siena, Via Aldo Moro 2, 53100 Siena, Italy. 2British Antarctic Survey, Natural
Environment Research Council, High Cross, Madingley Road, Cambridge CB3 0ET, UK. 3Department of Ecological
Sciences, Vrije Universiteit Amsterdam, De Boelelaan 1081, 1081 HV Amsterdam, The Netherlands. 4Keygene N.V.,
Agro Business Park 90, 6708 PW Wageningen, The Netherlands. 5Department of Life Sciences, Imperial College
London, London, UK. *email: leo6@student.unisi.it
Scientific Reports | (2021) 11:2973 | https://doi.org/10.1038/s41598-021-82379-x 1
Vol.:(0123456789)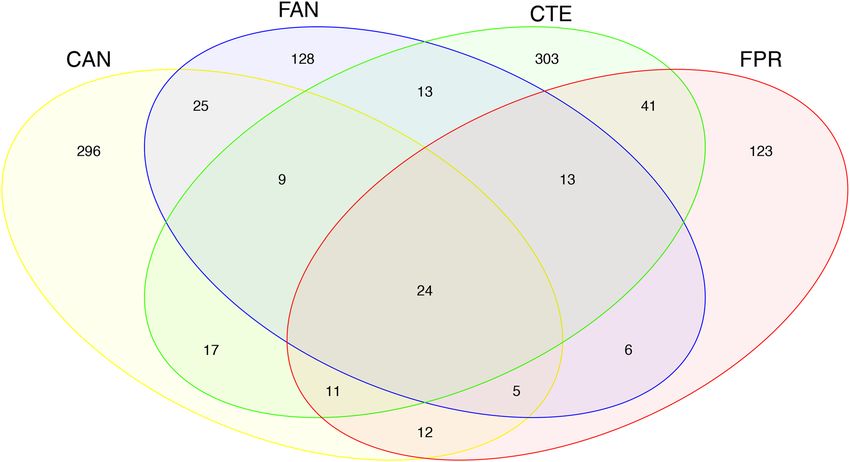
www.nature.com/scientificreports/
temperate environments, such as Folsomia candida12,13, Orchesella cincta14, Folsomia quadrioculata15 and other
ntomobryomorpha16. However, Collembola display substantial evolutionary diversity and, during their long
E
evolutionary history, have adapted to occupy almost every terrestrial ecosystem on Earth, including Antarctica’s
frigid deserts5. There is therefore a need to expand knowledge of their microbiomes to include additional taxa
adapted to different ecological conditions.
In this study, we characterized the microbiomes associated with different Antarctic springtail species using
the V3 region of the bacterial 16S ribosomal RNA (rRNA) encoding gene as a molecular marker. Four springtail
species, belonging to two different genera from different Orders, were selected from two different Antarctic
Conservation Biogeographic Regions (ACBRs17,18). Two species, Cryptopygus antarcticus antarcticus (Willem,
1901) and Friesea antarctica (Willem, 1901) (until recently known as Friesea grisea19) were collected in ACBR3
North-West Antarctic Peninsula, specifically from the South Shetland Islands and Adelaide Island (both in the
maritime Antarctic). Cryptopygus terranovus (Wise, 1967) and F. propria (Greenslade and Fanciulli, 2020) (also
previously known as F. griesea20), were sampled from ACBR8 North Victoria Land (continental Antarctica).
All four species are endemic to different regions within Antarctica and, given their poor dispersal capabili-
ties and the occurrence of insurmountable geographical barriers, have been isolated in these regions for many
millions of years during their e volution20–23. Therefore, studying their microbiomes may allow robust evaluation
of the extent to which Antarctic environments have influenced the springtail-associated bacterial communi-
ties, compared with springtails from lower latitudes. The simple two-factor sampling design used in this study
may also allow differentiation of two potential major evolutionary drivers responsible for shaping Collembola
microbiomes in Antarctica. Specifically, that of the phylogenetic similarity of hosts (through comparing two pairs
of congeneric species), versus that of two distinct biogeographic regions (maritime vs continental Antarctic).
Results
Data processing. Sequencing produced 259,086–327,432 reads per replicate (see “Materials and meth-
ods” section for naming conventions). After demultiplexing and trimming, the number of reads imported
into QIIME2 ranged between 129,543 and 163,716. Quality pre-processing and chimera filtering, along with
sequence pair joining, further reduced the number of paired reads per replicate to 54,045–89,636. Removal of
mitochondrial and chloroplast sequences in QIIME2, as well as the manual removal of co-amplified springtail
18S sequences, generated a final dataset of 1318–17,740 sequences per replicate. It is notable that a high num-
ber of sequences resulting from co-amplification of springtail 18S were obtained, accounting for 73–96% of
sequences per replicate. This is partly explained by the high nucleotide similarity observed at primer binding
sites with springtail 18S sites (in the springtail families Isotomidae and Neanuridae in general), which may have
been exacerbated during amplification. Finally, OTU clustering led to the identification of a total of 1026 bacte-
rial OTUs, ranging between 46 and 116 OTUs per replicate.
Diversity of Antarctic springtail microbiome. Among the 1026 identified bacterial OTUs, the domi-
nant higher taxa were Proteobacteria (average relative frequency 33%), Actinobacteria (27%), Firmicutes (14%)
and Bacteroidetes (11%) (Fig. 1a).
The alpha diversity described by the Shannon and the Evenness indexes was characterised by moderate levels
of bacterial diversity and the absence of dominant OTUs across all the samples analysed (Fig. 2). The overall
observed number of OTUs per sample was 94 ± 33 (mean ± standard deviation), with the lowest value detected in
F. antarctica (56 ± 22; Fig. 2). The OTU richness in the F. antarctica microbiome was significantly different from
all others in pairwise comparisons performed using the Wilcoxon rank sum test (P < 0.05; Fig. 2; Supplementary
Table S1). The Shannon metric showed a moderate intrinsic diversity in each microbial community examined,
with an average of 3.44 ± 0.55 (Fig. 2). The intrinsic diversity described by the Shannon index was significantly
different between the microbiomes of springtails distributed across the two Antarctic bioregions, with Shannon
indices being on average 3.78 ± 0.40 and 3.16 ± 0.49 for continental and maritime Antarctic, respectively (P < 0.05,
Supplementary Table S1). The Evenness index was moderately high among all samples, suggesting a balanced
distribution of taxa (on average 0.78 ± 0.09). A significant difference was observed in the Wilcoxon test between
the two Cryptopygus species sampled in the two Antarctic bioregions, whose Evenness indices were 0.68 ± 0.08
and 0.80 ± 0.08 for C. a. antarcticus and C. terranovus, respectively (P < 0.05, Fig. 2; Supplementary Table S1).
Beta diversity was explored using two phylogeny-based methods, weighted and unweighted UniFrac distances,
with the former focusing on phylogenetic distance and frequency of OTUs (i.e., quantitative) and the latter on
phylogenetic distance only (i.e., qualitative). In the Principal Coordinates Analysis (PCoA) based on weighted
UniFrac distances, the first axis (PCoA1) explained 34% of variation and the second (PCoA2) explained 23.3%
(Fig. 3a). The first axis showed a slight difference in composition between F. antarctica and all other samples.
The second axis separated C. a. antarcticus from all the other samples and, in general, it tended to cluster the
microbiomes according to their hosts’ geographic distribution (maritime vs continental Antarctic; Fig. 3a). PER-
MANOVA analysis on weighted UniFrac distances indicated that differences were significant at all levels, i.e.,
between species, between genera (both P < 0.001) and between bioregions (P < 0.05; Supplementary Table S2).
The PCoA performed using unweighted UniFrac distances showed clear distinction in OTU composition
between the four springtail microbiomes (Fig. 3b). The first axis (PCoA1) explained 17.9% of variation and
tended to separate samples according to bioregion (i.e., maritime vs continental Antarctic; Fig. 3b). The second
axis (PCoA2) explained 14.7% of variation and overall separated the C. a. antarcticus replicates from the remain-
ing samples (Fig. 3b). Additional axes explained a sizeable portion of the observed variance (axis 3: 9%, axis 4:
7.9%), but groupings did not allow for a clear biological interpretation (data not shown). The PERMANOVA
analysis again indicated that differences were statistically significant between species and genera (both P < 0.001),
as well as bioregions (P < 0.05; Supplementary Table S2).
Scientific Reports | (2021) 11:2973 | https://doi.org/10.1038/s41598-021-82379-x 2
Vol:.(1234567890)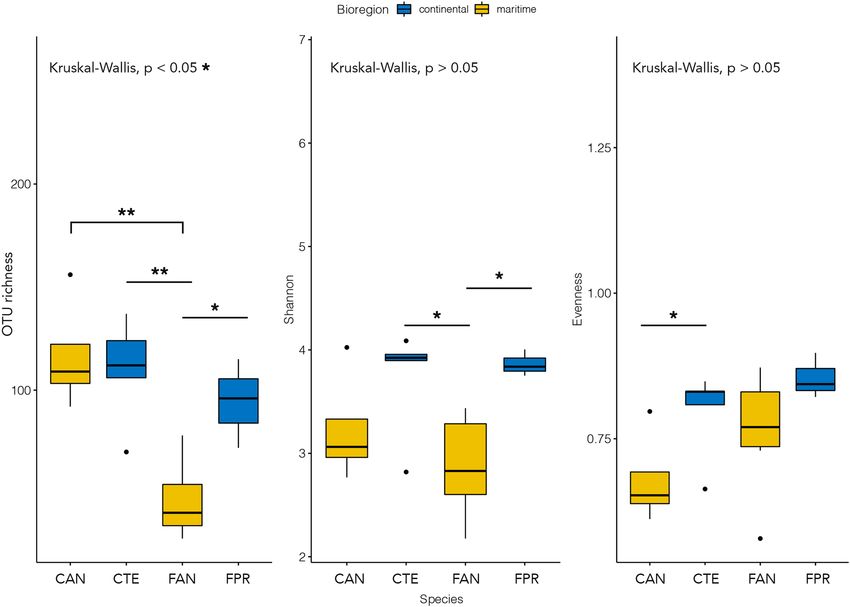
www.nature.com/scientificreports/
Figure 1. Relative abundance plots of the most frequent bacterial OTUs at the phylum (a) and order (b) levels.
Samples are grouped according to host species and sampling location, see Table 1 for explanation of codes. The
figure was generated using the R package ggplot2 v3.2.1 (https://ggplot2.tidyverse.org).
Scientific Reports | (2021) 11:2973 | https://doi.org/10.1038/s41598-021-82379-x 3
Vol.:(0123456789)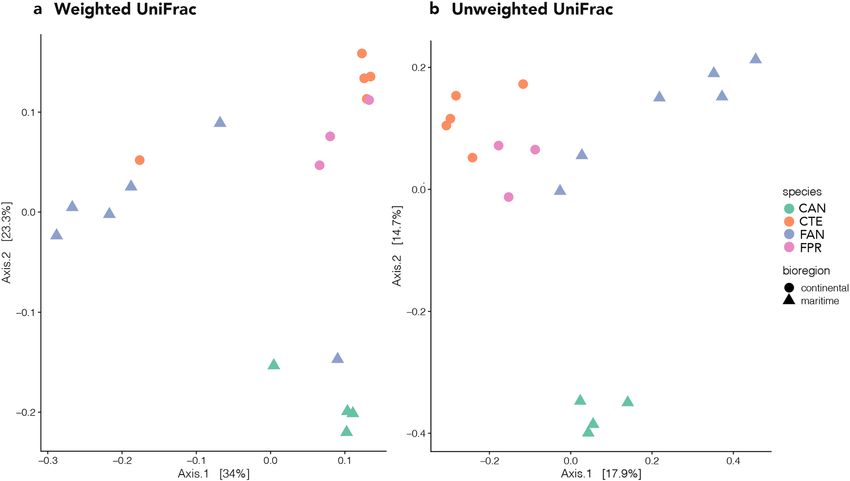
www.nature.com/scientificreports/
Figure 2. Alpha diversity: observed OTU richness, Shannon and Evenness indexes. The P value of the Kruskal–
Wallis test is shown at the top of each plot; lines and asterisks highlight significant differences observed after
pairwise Mann–Whitney–Wilcoxon tests. *P < 0.05; **P < 0.01. Blue and yellow colours indicate species collected
in the continental and maritime Antarctic regions, respectively. The figure was generated using the R package
ggplot2 v3.2.1 (https://ggplot2.tidyverse.org).
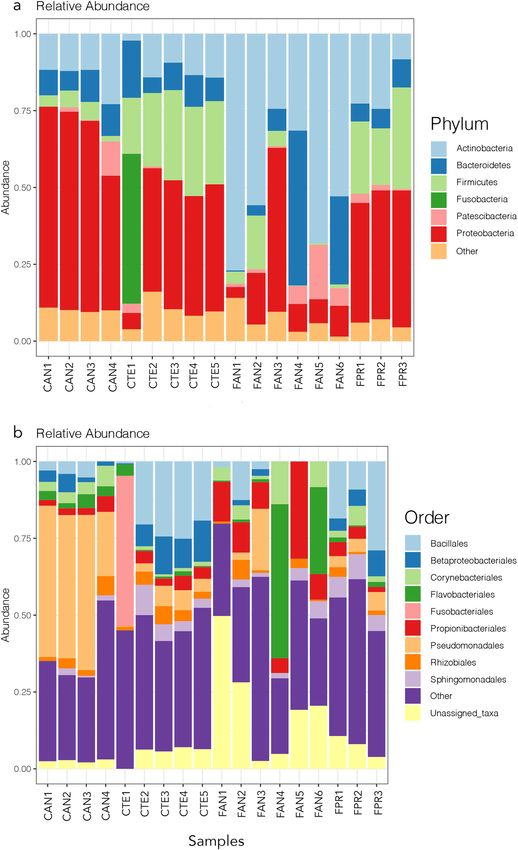
The core microbial community associated with the four springtail species was investigated through a Venn
diagram. Among the 1026 OTUs detected, only 24 were present in all samples (Fig. 4). These latter were OTUs
belonging to the phyla Actinobacteria, Deinococcus-Thermus, Firmicutes, Lentisphaerae and Proteobacteria,
as well as, when properly classified, belonging to the most abundant orders shown in Fig. 1b. The number of
shared OTUs increased when considering the core microbiome of samples grouped by biogeographic region of
origin or by genus. In particular, C. a. antarcticus and F. antarctica from the maritime Antarctic had 63 OTUs
in common, while C. terranovus and F. propria from Victoria Land shared 89 OTUs. In comparison, the two
Cryptopygus species shared 61 OTUs and the two Friesea species shared 48 OTUs.
Discussion
Previous studies of the microbiota associated with Antarctic fauna, such as the oribatid mite Alaskozetes ant-
arcticus24 and the tardigrade Acutuncus antarcticus25, showed higher diversity than those reported in mite and
tardigrade species from lower latitudes. This was not observed in Antarctic springtail microbiomes. On the one
hand, the most abundant bacterial groups, herein identified at the phylum level, were consistent with the micro-
bial community composition reported in previous studies of Collembola microbiomes (Fig. 1a12,14). The Ant-
arctic springtail microbiomes were dominated by Proteobacteria, Bacteroidetes, Firmicutes and Actinobacteria
(Fig. 1a), taxa that have been previously suggested to be mainly involved in decomposition processes, as well as
possibly providing a defence system through antimicrobial p roduction12–14. Although at high taxonomic levels
the dominant microbiota appears to be similar between temperate and Antarctic Collembola, more pronounced
differences exist at lower taxonomic levels. However, these are difficult to interpret at present in biological terms,
as both the precise taxonomy and the metabolic functions of individual species are mostly unknown.
Interestingly, the overall OTU richness observed in this study, seems to be considerably lower than that
described for the temperate springtails Folsomia candida and Orchesella cincta (ca. 200–300 OTUs per s ample12,14),
although some uncertainty may result from unequal sequencing depth. These data would suggest that, as reported
for macro-organisms, the richness of bacterial species associated with Antarctic springtails decreases at higher
latitudes. A similar pattern was observed in a comparison of the bacterial community composition of Antarctic
Scientific Reports | (2021) 11:2973 | https://doi.org/10.1038/s41598-021-82379-x 4
Vol:.(1234567890)www.nature.com/scientificreports/
Figure 3. Principal coordinate analysis (PCoA) showing: (a) the weighted UniFrac, and (b) the unweighted
UniFrac distances between the four samples analysed. The figure was generated using the R package ggplot2
v3.2.1 (https://ggplot2.tidyverse.org).
Figure 4. Venn diagram showing the shared and unique OTUs of the microbiomes associated with the four
Antarctic springtail species. Sample labels are expanded in Table 1. The figure was generated using the R package
gplots v3.0.1.1 (https://CRAN.R-project.org/package=gplots).
and Australian soils26, although not in a comparison of the diversity of Arctic and other Northern Hemisphere
soils27. Antarctic soils are characterized by lower levels of organic carbon, as a result of lower temperatures a
more limited vegetation, than those of the Arctic23–25,28. Multiple factors therefore appear to underlie reduced
diversity of microorganisms in Antarctic soils. We suggest that the same environmental factors may have acted
over evolutionary time to limit the diversity of Antarctic springtail microbiomes compared with those of Col-
lembola from lower latitudes.
Scientific Reports | (2021) 11:2973 | https://doi.org/10.1038/s41598-021-82379-x 5
Vol.:(0123456789)www.nature.com/scientificreports/
Along with ecosystem characteristics, the influence of the host taxon may be equally important in defining
host-microbiota relationships. This has been reported in studies of tardigrades from low and high latitudes, that
showed microbiome composition to be highly species-specific25, and may also be the case in the Antarctic spring-
tails studied here, in which the numbers of OTUs unique to each sample outnumbered those shared (Fig. 4).
This suggestion is further corroborated by the PERMANOVA analyses, where significant divergence between
microbiomes was detected across all comparisons (Supplementary Table S2).
The data obtained in the present study also support a major influence of environmental factors in shaping
microbiome composition. While this result appears plausible, as it is based on the comparison of two pairs of
species, some caution is needed in the interpretation of data from the C. a. antarcticus/C. terranovus species
pair, as the former has been reared under laboratory conditions for 18 months before the study25,29. This can
account for reduction and/or modification of the microbial diversity compared to natural populations (e.g.,29),
as shown in a comparison of whole-body microbiomes between natural and laboratory-reared populations of
the Antarctic tardigrade Acutuncus antarcticus25.
Analyses of beta diversity identified a higher similarity between the microbiomes associated with different
springtail genera originating in the same Antarctic bioregion than with species belonging to the same genus
but originating from different bioregions (Fig. 4). The number of shared OTUs between C. a. antarcticus and
F. antarctica (63) (maritime Antarctic), and between C. terranovus and F. propria (89) (continental Antarctic)
were higher than the numbers shared between species belonging to the same genus (i.e., 61 and 48 shared OTUs
between Cryptopygus and Friesea species, respectively; Fig. 4). Although it has been observed that phylogeneti-
cally related springtails play similar roles in foodwebs and occupy similar ecosystem n iches30, it seems that the
composition of their microbiomes, that should be—in some respects—linked to their role in soil dynamics, does
not follow the evolutionary niche conservation principle. Moreover, Collembola have evolved various feeding
strategies, leading to distinct and specialized morphology of mouthparts, probably to avoid niche overlap when
different springtails species are present in the same ecosystem5. In spite of this, the results obtained suggest a
higher similarity in the microbiota composition between springtail species belonging to different genera, families
and orders (that may be characterised by different feeding behaviours). Therefore, it appears that the phylogenetic
relatedness of hosts seems not to be the primary driver affecting their associated bacterial community composi-
tion, and this latter should be rather connected with their high degree of endemism and the long-term survival
of hosts in a given biogeographical region of Antarctica. This evidence contrasts with the ubiquity hypothesis
of microbial distribution and, as other studies have s uggested31,32, refutes the idea that for microbes “everything
is everywhere”33.
It is also possible that the extreme conditions experienced in Antarctica mean that environmental control
is so pronounced that it has become the primary factor shaping not only the evolution and adaptation of both
Antarctic terrestrial prokaryotes and invertebrate fauna, but also their physiological and ecological interactions.
Furthermore, the long separation time between biota of the continental Antarctic and maritime Antarctic, from
few millions to many tens of millions of years (e.g.,34), may have further fostered the development of highly spe-
cific microbial interactions. This may be a direct consequence of time, with divergence in the associated microbial
community paralleling divergence in the hosts. Such differential selection, arising from diverse environmental
conditions, may have led to the development of novel and varied ecological interactions (i.e., being in contact
with different microbial assemblages in the soil of two distinct regions may have opened to the possibility of
establishing novel and different host-microbiota relationships).
Conclusions
The present study presents the first characterization of the microbiomes associated with two pairs of congeneric
Antarctic springtail species originating from two distinct biogeographical regions (the maritime and continen-
tal Antarctic). These regions experience very different environmental conditions that strongly impact on the
composition and functioning of their terrestrial ecosystems. Moreover, their microbiota and invertebrate fauna
have long evolutionary histories in isolation20,34,35. The reduced diversity and richness of Antarctic springtail
microbiomes, as well as the limited similarities observed between the four microbiomes analysed here, could be
the result of strong environmental control, as well as of millions of years of evolutionary separation. Future appli-
cation of metagenomic functional analyses will allow a better understanding of the evolution of host-microbiome
relationships and their contribution to host adaptation to extreme environmental conditions, as well as of the
metabolic and physiological properties arising from these interactions.
Materials and methods
Sample collection. The samples analysed in the present study were collected from the two main Antarctic
biogeographical regions, the maritime and continental Antarctic (Table 1). In the former, samples were obtained
from Livingston Island (South Shetland Islands) and Lagoon Island, Ryder Bay (off the south-east coast of Ade-
laide Island). In the latter, samples were collected from Campo Icaro and Kay Island, Northern Victoria Land.
Specimens of F. antarctica were sampled during the austral summer of 2002–2003 in collaboration between the
British Antarctic Survey (BAS) and the Italian National Antarctic Program (PNRA). Specimens of C. terranovus
and F. propria from Victoria Land were collected during PNRA-supported expeditions in the austral summers of
2017–2018 and 2018–2019, respectively. Samples of C. a. antarcticus, originating from the Antarctic Peninsula,
were collected in January 2018 and reared in a substrate of Antarctic mosses in a climate chamber at + 2 °C from
July 2018, in the Department of Systems Ecology of the Vrije Universiteit Amsterdam.
Throughout the text we use the term “replicate” to refer to individual DNA isolates, while the terms “sample”
or “species” are used to designate groups of replicates from the same springtail species collected in the same sam-
pling location (two neighbouring sampling locations in the case of F. antarctica). In the analyses described below
Scientific Reports | (2021) 11:2973 | https://doi.org/10.1038/s41598-021-82379-x 6
Vol:.(1234567890)www.nature.com/scientificreports/
Replicate ID Species Sample coordinates Collection sites Bioregion
CTE1
CTE2
Campo Icaro Continental Antarctic; North Victoria Land
CTE3 Cryptopygus terranovus Ice-free rocky ground devoid of vegetation
74°42′45"S; 164° 06′21"E (ACBR 8)
CTE4
CTE5
CAN1
CAN2 South Shetland Islands Reared in climatic chamber (+ 2 °C) on Maritime Antarctic; North-West Antarctic
Cryptopygus antarcticus antarcticus
CAN3 62°0′0″S; 58°0′0″W Antarctic mosses since July 2018 Peninsula (ACBR 3)
CAN4
FPR1
Kay Island Rocky ground on slope with sparse vegeta- Continental Antarctic; North Victoria Land
FPR2 Friesea propria
74°04′14"S; 165°18′60"E tion (ACBR 8)
FPR3
FAN1
Devils Point Livingston Island
Rocky ground close to seashore with sparse
FAN2 South Shetland Islands
vegetation
62°40′15″S; 61°10′57″W
FAN3 Maritime Antarctic; North-West Antarctic
Friesea antarctica
FAN4 Peninsula (ACBR 3)
Lagoon Island
FAN5 Adelaide Island Rocky ground close to seashore
67°35′33″S; 68°14′06″W
FAN6
Table 1. List of the species included in the present study. The number of replicates per species, as well as the
collection site, the geographical coordinates and the bioregion are given.
two types of comparisons are made, (1) partitioning samples across “region” (continental Antarctic vs. maritime
Antarctic) and (2) across “genera” (i.e., C. terranovus and C. a. antarcticus vs. F. propria and F. antarctica).
DNA extraction and sequencing. Between 15 and 20 animals were pooled, rinsed in 70% ethanol and
their DNA extracted using the QIAamp UCP DNA Micro kit (Qiagen, Hilden, Germany) following the manu-
facturer’s instructions. A minimum of three replicates for each species and location were included in the study
(see Table 1 for details). A first PCR was performed, using primers 341F (5′-CCTACGGGNGGCWGCAG-3′)
and 518R (5′-ATTACCGCGGCTGCTGG-3′). The amplification was carried out in a total reaction volume of
25 μl, consisting of 0.5 μl of deoxynucleotides (dNTPs), 1.25 μl of each primer (10 μM), 5 μl of 5× Phusion
High-Fidelity Buffer, 0.5 μl of Phusion Hot-Start High-Fidelity Taq polymerase (Thermo Fischer Scientific Inc.,
Waltham, MA, USA), 13.5 μl of ddH2O and 3 μl of template. The following cycling conditions were applied:
denaturation at 98 °C for 10 s, annealing at 50 °C for 30 s and elongation at 72 °C for 30 s, repeated for 25 cycles;
an initial denaturation was performed at 98 °C for 2 min, as well as a final elongation step at 72 °C for 10 min.
As longer non-specific products may potentially have been co-amplified, the expected ~ 170 bp 16S target was
purified from the gel slice using the Nucleospin Gel kit and PCR Clean-Up (Macherey-Nagel, Düren, Germany)
following the manufacturer’s protocol. Purified PCR products were re-amplified with primers linked to Illumina
adapters with the same reaction mixture following a 12 cycle program: denaturation at 98 °C for 10 s, annealing
and extension at 72 °C for 1 min, as well as an initial denaturation at 98 °C for 2 min and a final elongation at
72 °C for 8 min. PCR products were visualized on a 1.5% agarose gel and purified using Beckman Coulter Agen-
court AMPure XP protocols, with a ratio DNA:beads of 1:1. Purified products were quantified using the Qubit
dsDNA HS Assay Kit (Thermo Fischer Scientific Inc., Waltham, MA, USA). Samples were then indexed using
Herculase II Fusion DNA Polymerase Nextera XT Index Kit V2 and sequenced on a MiSeq Illumina platform at
the Macrogen Inc. facility (Seoul, Republic of Korea).
All amplicon data are available from the NCBI Sequence Read Archive (SRA) database under the project
number PRJNA681366 (https://www.ncbi.nlm.nih.gov/sra/PRJNA681366).
Sequence processing. Demultiplexed raw sequences were trimmed to remove 16S primers using Trim-
momatic v0.3936. Raw sequences were imported into the program Quantitative Insights Into Microbial Ecology
v2 (QIIME237). Sequences were filtered and merged using the DADA2 plugin, truncating the forward and the
reverse reads after 230 and 188 bp, respectively, based on the read q uality38. Sequences were clustered using a
39
97% identity threshold with V SEARCH , including chimera removal. Taxonomic identification of the OTUs
was performed with the feature-classifier plugin trained on the SILVA v132 database40. OTUs classified as mito-
chondrial or chloroplast were removed, as well as sequences corresponding to the springtail ribosomal 18S
gene. A phylogenetic analysis was carried out using the maximum likelihood optimization criterion, as imple-
mented in the phylogeny plugin, using the fasttree m ethod41. Alpha and beta diversity were computed in R
v3.6.1 (2019-07-05), using the R packages m icrobiome42, microbiomeSeq43, phyloseq v1.2844, vegan v2.5-645 and
limma v3.40.646, after data normalization to a sampling depth of 1318 (the minimum number of reads observed
in the smallest library; see Table 1). To investigate alpha diversity, the observed number of OTUs per normal-
ized sample, as well as the Shannon and Evenness indices, were calculated. Differences between groups were
Scientific Reports | (2021) 11:2973 | https://doi.org/10.1038/s41598-021-82379-x 7
Vol.:(0123456789)www.nature.com/scientificreports/
tested using both the Kruskal–Wallis and Wilcoxon rank sum tests (equivalent to the Mann–Whitney test; the
significance level was defined as α = 0.05). P values were adjusted for multiple comparisons in both tests using
the Holm–Bonferroni method. Comparison between samples (beta diversity) were conducted based on phylo-
genetic UniFrac weighted and unweighted distances. A PERMANOVA analysis, performing 999 permutations
and setting the level of significance as α = 0.05, was applied to the weighted and unweighted distance matrices
to test for differences in beta diversity. Comparisons were carried out at the levels of species, genera and biogeo-
graphic region (maritime vs. continental Antarctic; Table 1). Sharing of OTUs was investigated through a Venn
diagram using the R package VennDiagram47 on the original and not normalized OTU table. Finally, the data
were visualized using the R packages ggplot2 v3.2.148 and gplots 3.0.1.149. These two latter tools were applied to
generate the figures shown in the present paper.
Received: 19 November 2020; Accepted: 13 January 2021
References
1. Ineson, P., Leonard, M. A. & Anderson, J. M. Effect of collembolan grazing upon nitrogen and cation leaching from decomposing
leaf litter. Soil Biol. Biochem. 14, 601–605. https://doi.org/10.1016/0038-0717(82)90094-3 (1982).
2. Petersen, H. & Luxton, M. A. comparative analysis of soil fauna populations and their role in decomposition processes. Oikos 39,
288–388. https://doi.org/10.1016/j.pedobi.2006.08.006 (1982).
3. Drake, H. L. & Horn, M. A. As the worm turns: The earthworm gut as a transient habitat for soil microbial biomes. Annu. Rev.
Microbiol. 61, 169–189. https://doi.org/10.1146/annurev.micro.61.080706.093139 (2007).
4. Liu, Y. et al. Higher soil fauna abundance accelerates litter carbon release across an alpine forest-tundra ecotone. Sci. Rep. 9, 10562.
https://doi.org/10.1038/s41598-019-47072-0 (2019).
5. Hopkin, S. P. Biology of the Springtails (Insecta: Collembola) (Oxford University Press, Oxford, 1997).
6. Maaß, S., Caruso, T. & Rillig, M. C. Functional role of microarthropods in soil aggregation. Pedobiologia 58, 59–63. https://doi.
org/10.1016/j.pedobi.2015.03.001 (2015).
7. Bergstrom, D. M., Convey, P. & Huiskes, A. H. L. Trends in Antarctic Terrestrial and Limnetic Ecosystems: Antarctica as a Global
Indicator (Springer, Berlin, 2006). .
8. Convey, P. Antarctic terrestrial biodiversity in a changing world. Polar. Biol. 34(11), 1629–1641. https://doi.org/10.1007/s0030
0-011-1068-0 (2011).
9. Convey, P. et al. The spatial structure of Antarctic biodiversity. Ecol. Monogr. 84(2), 203–244. https://doi.org/10.1890/12-2216.1
(2014).
10. Wauchope, H. S., Shaw, J. D. & Terauds, A. A snapshot of biodiversity protection in Antarctica. Nat. Commun. 10(1), 946. https://
doi.org/10.1038/s41467-019-08915-6 (2019).
11. Chown, S. L. et al. The changing form of Antarctic biodiversity. Nature 522(7557), 431–438. https://doi.org/10.1038/nature1450
5 (2015).
12. Agamennone, V. et al. The microbiome of Folsomia candida: An assessment of bacterial diversity in a Wolbachia-containing animal.
FEMS Microbiol. Ecol. 91(11), 1–10. https://doi.org/10.1093/femsec/fiv128 (2015).
13. Zhu, D. et al. Exposure of soil collembolans to microplastics perturbs their gut microbiota and alters their isotopic composition.
Soil Biol. Biochem. 115, 302–310. https://doi.org/10.1016/j.soilbio.2017.10.027 (2018).
14. Bahrndorff, S. et al. Diversity and metabolic potential of the microbiota associated with a soil arthropod. Sci. Rep. 8(1), 1–8. https
://doi.org/10.1038/s41598-018-20967-0 (2018).
15. Ding, J. et al. Effects of long-term fertilization on the associated microbiota of soil collembolan. Soil Biol. Biochem. 130, 141–149.
https://doi.org/10.1016/j.soilbio.2018.12.015 (2019).
16. Anslan, S., Bahram, M. & Tedersoo, L. Temporal changes in fungal communities associated with guts and appendages of Col-
lembola as based on culturing and high-throughput sequencing. Soil Biol. Biochem. 96, 152–159. https://doi.org/10.1016/j.soilb
io.2016.02.006 (2016).
17. Terauds, A. et al. Conservation biogeography of the Antarctic. Divers Distrib. 18(7), 726–741. https: //doi.org/10.111
1/j.1472-4642.2012.00925.x (2012).
18. Terauds, A. & Lee, J. R. Antarctic biogeography revisited: Updating the Antarctic Conservation Biogeographic Regions. Divers
Distrib. 22(8), 836–840. https://doi.org/10.1111/ddi.12453 (2016).
19. Greenslade, P. An Antarctic biogeographical anomaly resolved: The true identity of a widespread species of Collembola. Polar Biol.
41(5), 969–981. https://doi.org/10.1007/s00300-018-2261-1 (2018).
20. Carapelli, A. et al. Evidence for cryptic diversity in the “pan-Antarctic” springtail Friesea antarctica and the description of two
new species. Insects 11, 141. https://doi.org/10.3390/insects11030141 (2020).
21. Carapelli, A., Convey, P., Frati, F., Spinsanti, G. & Fanciulli, P. P. Population genetics of three sympatric springtail species (Hexapoda:
Collembola) from the South Shetland Islands: Evidence for a common biogeographic pattern. Biol. J. Linn. Soc. 120, 788–803. https
://doi.org/10.1093/biolinnean/blw004 (2017).
22. Collins, G. E., Hogg, I. D., Convey, P., Barnes, A. D. & McDonald, I. R. Spatial and temporal scales matter when assessing the species
and genetic diversity of springtails (Collembola) in Antarctica. Front. Ecol. Evol. 7, 76. https://doi.org/10.3389/fevo.2019.00076
(2019).
23. Collins, G. E. et al. Genetic diversity of soil invertebrates corroborates timing estimates for past collapses of the West Antarctic
Ice Sheet. PNAS 117, 22293–22302. https://doi.org/10.1073/pnas.2007925117 (2020).
24. Holmes, C. J. et al. The Antarctic mite, Alaskozetes antarcticus, shares bacterial microbiome community membership but not
abundance between adults and tritonymphs. Polar Biol. 42, 2075–2085. https://doi.org/10.1007/s00300-019-02582-5 (2019).
25. Vecchi, M., Newton, I. L. G., Cesari, M., Rebecchi, L. & Guidetti, R. The microbial community of tardigrades: Environmental
influence and species specificity of microbiome structure and composition. Microb. Ecol. 76(2), 467–481. https://doi.org/10.1007/
s00248-017-1134-4 (2018).
26. Delgado-Baquerizo, M. et al. Ecological drivers of soil microbial diversity and soil biological networks in the Southern Hemisphere.
Ecology 99(3), 583–596. https://doi.org/10.1002/ecy.2137 (2018).
27. Chu, H. et al. Soil bacterial diversity in the Arctic is not fundamentally different from that found in other biomes. Environ. Micro-
biol. 12(11), 2998–3006. https://doi.org/10.1111/j.1462-2920.2010.02277.x (2010).
28. Siciliano, S. D. et al. Soil fertility is associated with fungal and bacterial richness, whereas pH is associated with community com-
position in polar soil microbial communities. Soil Biol. Biochem. 78, 10–20. https://doi.org/10.1016/j.soilbio.2014.07.005 (2014).
Scientific Reports | (2021) 11:2973 | https://doi.org/10.1038/s41598-021-82379-x 8
Vol:.(1234567890)www.nature.com/scientificreports/
29. Zouache, K. et al. Composition of bacterial communities associated with natural and laboratory populations of Asobara tabida
infected with Wolbachia. Appl. Environ. Microb. 75, 3755–3764. https://doi.org/10.1128/aem.02964-08 (2009).
30. Potapov, A. A., Semenina, E. E., Korotkevich, A. Y., Kuznetsova, N. A. & Tiunov, A. V. Connecting taxonomy and ecology: Trophic
niches of collembolans as related to taxonomic identity and life forms. Soil Biol. Biochem. 101, 20–31. https://doi.org/10.1016/j.
soilbio.2016.07.002 (2016).
31. De Wever, A. et al. Hidden levels of phylodiversity in Antarctic green algae: Further evidence for the existence of glacial refugia.
Proc. R. Soc. B 276, 3591–3599. https://doi.org/10.1098/rspb.2009.0994 (2009).
32. Vyverman, W. et al. Evidence for widespread endemism among Antarctic micro-organisms. Polar Sci. 4(2), 103–113. https://doi.
org/10.1016/j.polar.2010.03.006 (2010).
33. Finlay, B. J. & Clarke, K. J. Ubiquitous dispersal of microbial species. Nature 400, 828–828. https://doi.org/10.1038/23616 (1999).
34. Chown, S. L. & Convey, P. Structure and temporal variability across life’s hierarchies in the terrestrial Antarctic. Philos. Trans. R.
Soc. B 362, 2307–23331. https://doi.org/10.1098/rstb.2006.1949 (2007).
35. Convey, P., Biersma, E. M., Casanova-Katny, A. & Maturana, C. S. Refuges of Antarctic diversity. Chapter 10. In Past Antarctica (eds
Oliva, M. & Ruiz-Fernández, J.) 181–200 (Academic Press, Burlington, 2020). https://doi.org/10.1016/B978-0-12-817925-3.00010
-0.
36. Bolger, A. M., Lohse, M. & Usadel, B. Trimmomatic: A flexible trimmer for Illumina sequence data. Bioinformatics 30(15), 2114–
2120. https://doi.org/10.1093/bioinformatics/btu170 (2014).
37. Bolyen, E. et al. Reproducible, interactive, scalable and extensible microbiome data science using QIIME 2. Nat. Biotechnol. 37,
852–857. https://doi.org/10.1038/s41587-019-0209-9 (2019).
38. Callahan, B. J. et al. DADA2: High-resolution sample inference from Illumina amplicon data. Nat. Methods 13(7), 581–583. https
://doi.org/10.1038/nmeth.3869 (2016).
39. Rognes, T., Flouri, T., Nichols, B., Quince, C. & Mahé, F. VSEARCH: A versatile open source tool for metagenomics. PeerJ 4, e2584.
https://doi.org/10.7717/peerj.2584 (2016).
40. Bokulich, N. A. et al. Optimizing taxonomic classification of marker-gene amplicon sequences with qiime 2’s q2-feature-classifier
plugin. Microbiome 6(1), 90. https://doi.org/10.1186/s40168-018-0470-z (2018).
41. Price, M. N., Dehal, P. S. & Arkin, A. P. Fasttree 2-approximately maximum-likelihood trees for large alignments. PLoS One 5(3),
e9490. https://doi.org/10.1371/journal.pone.0009490 (2010).
42. Lahti, L. & Shetty, S. Microbiome R package. http://microbiome.github.io (2012–2019).
43. Ssekagiri, A., Sloan, W. T. & Ijaz, U. Z. microbiomeSeq: An R package for analysis of microbial communities in an environmental
context. ISCB Africa ASBCB Conference. http://www.github.com/umerijaz/microbiomeSeq (2017).
44. McMurdie, P. J. & Holmes, S. phyloseq: An R package for reproducible interactive analysis and graphics of microbiome census
data. PLoS One 8(4), e61217. https://doi.org/10.1371/journal.pone.0061217 (2014).
45. Oksanen, J., et al. Vegan: Community ecology package. R package version 2.5-6. https://github.com/vegandevs/vegan (2019).
46. Ritchie, M. E. et al. limma powers differential expression analyses for RNA-sequencing and microarray studies. Nucleic Acids Res.
43(7), e47. https://doi.org/10.1093/nar/gkv007 (2015).
47. Chen, H. & Boutros, P. C. VennDiagram: A package for the generation of highly-customizable Venn and Euler diagrams in R.
BMC Bioinf. 12, 35. https://doi.org/10.1186/1471-2105-12-35 (2011).
48. Wickham, H. ggplot2: Elegant Graphics for Data Analysis. Springer, New York. https://ggplot2.tidyverse.org (2016).
49. Warnes, G. R., et al. gplots: Various R Programming Tools for Plotting Data. R package version 3.0.1.1. https://CRAN.R-proje
ct.org/package=gplots (2019).
Acknowledgements
The present study was supported by the Italian National Antarctic Program (PNRA, Grant no. PNRA16-00234).
P. Convey is supported by NERC core funding to the British Antarctic Survey’s ‘Biodiversity, Evolution and Adap-
tation’ Team. The authors would like to thank Dr Stef Bokhorst, who kindly provided specimens of Cryptopygus
antarcticus antarcticus for the present study. The authors would also like to thank the two anonymous Reviewers
for their support and contribution to the present work.
Author contributions
C.L., A.C., D.R., J.T.W. conceptualization and project design; C.L., C.C. data acquisition; C.L., D.R., J.T.W., F.N.,
A.C., P.C., F.F. interpretation of data. All Authors contributed to the draft of the manuscript. All Authors approved
and agreed to the submitted version of the present manuscript.
Competing interests
The authors declare no competing interests.
Additional information
Supplementary Information The online version contains supplementary material available at https://doi.
org/10.1038/s41598-021-82379-x.
Correspondence and requests for materials should be addressed to C.L.
Reprints and permissions information is available at www.nature.com/reprints.
Publisher’s note Springer Nature remains neutral with regard to jurisdictional claims in published maps and
institutional affiliations.
Scientific Reports | (2021) 11:2973 | https://doi.org/10.1038/s41598-021-82379-x 9
Vol.:(0123456789)www.nature.com/scientificreports/
Open Access This article is licensed under a Creative Commons Attribution 4.0 International
License, which permits use, sharing, adaptation, distribution and reproduction in any medium or
format, as long as you give appropriate credit to the original author(s) and the source, provide a link to the
Creative Commons licence, and indicate if changes were made. The images or other third party material in this
article are included in the article’s Creative Commons licence, unless indicated otherwise in a credit line to the
material. If material is not included in the article’s Creative Commons licence and your intended use is not
permitted by statutory regulation or exceeds the permitted use, you will need to obtain permission directly from
the copyright holder. To view a copy of this licence, visit http://creativecommons.org/licenses/by/4.0/.
© The Author(s) 2021
Scientific Reports | (2021) 11:2973 | https://doi.org/10.1038/s41598-021-82379-x 10
Vol:.(1234567890)You can also read