Metformin induced ROS upregulation as amplified by apigenin causes profound anticancer activity while sparing normal cells - Nature
←
→
Page content transcription
If your browser does not render page correctly, please read the page content below
www.nature.com/scientificreports
OPEN Metformin‑induced ROS
upregulation as amplified
by apigenin causes profound
anticancer activity while sparing
normal cells
Madhuri Shende Warkad1, Chea‑Ha Kim1, Beom‑Goo Kang1, Soo‑Hyun Park4, Jun‑Sub Jung4,
Jing‑Hui Feng2, Gozde Inci1, Sung‑Chan Kim1, Hong‑Won Suh2, Soon Sung Lim3 &
Jae‑Yong Lee1*
Metformin increased cellular ROS levels in AsPC-1 pancreatic cancer cells, with minimal effect in HDF,
human primary dermal fibroblasts. Metformin reduced cellular ATP levels in HDF, but not in AsPC-1
cells. Metformin increased AMPK, p-AMPK (Thr172), FOXO3a, p-FOXO3a (Ser413), and MnSOD levels
in HDF, but not in AsPC-1 cells. p-AMPK and p-FOXO3a also translocated from the cytosol to the
nucleus by metformin in HDF, but not in AsPC-1 cells. Transfection of si-FOXO3a in HDF increased ROS
levels, while wt-FOXO3a-transfected AsPC-1 cells decreased ROS levels. Metformin combined with
apigenin increased ROS levels dramatically and decreased cell viability in various cancer cells including
AsPC-1 cells, with each drug used singly having a minimal effect. Metformin/apigenin combination
synergistically decreased mitochondrial membrane potential in AsPC-1 cells but to a lesser extent
in HDF cells. Metformin/apigenin combination in AsPC-1 cells increased DNA damage-, apoptosis-,
autophagy- and necroptosis-related factors, but not in HDF cells. Oral administration with metformin/
apigenin caused dramatic blocks tumor size in AsPC-1-xenografted nude mice. Our results suggest
that metformin in cancer cells differentially regulates cellular ROS levels via AMPK-FOXO3a-MnSOD
pathway and combination of metformin/apigenin exerts anticancer activity through DNA damage-
induced apoptosis, autophagy and necroptosis by cancer cell-specific ROS amplification.
Abbreviations
ROS Reactive oxygen species
H2O2 Hydrogen peroxide
ETC Electron transport chain
AMPK AMP-activated protein kinase
mTOR Mammalian target of the rapamycin
FOXO3a Forkhead box O3a
PVDF Polyvinylidene difluoride
CMC Carboxymethyl cellulose
Reactive oxygen species (ROS) constitute a group of highly reactive molecules such as superoxide anion and
hydrogen peroxide (H2O2), generated by mitochondrial byproducts of aerobic respiration, enzymatic activation
4501, and NADPH oxidases. ROS are thought to cause damage to the entire cell including its
of cytochrome p
1
Department of Biochemistry, Institute of Cell Differentiation and Aging, College of Medicine, Hallym University,
1 Hallymdeahak‑gil, Chuncheon 24252, Republic of Korea (South Korea). 2Department of Pharmacology, Institute
of Natural Medicine, Hallym University, 1 Hallymdeahak‑gil, Chuncheon 24252, Republic of Korea (South
Korea). 3Department of Food Science and Nutrition, The Korean Institute of Nutrition, College of Natural Science
, Hallym University, 1 Hallymdeahak‑gil, Chuncheon 24252, Republic of Korea (South Korea). 4FrontBio Inc. #301,
Bio-2, Chuncheon BioTown, 32 Soyanggang‑ro, Chuncheon‑si, Gangwon‑do 24232, Republic of Korea (South
Korea). *email: jyl3746@gmail.com
Scientific Reports | (2021) 11:14002 | https://doi.org/10.1038/s41598-021-93270-0 1
Vol.:(0123456789)
www.nature.com/scientificreports/
mitochondria and the nucleus by structurally harming DNA, protein, and lipids. However, ROS are also found to
be required in certain cell processes as they are involved in maintenance of redox homeostasis and various cellular
signaling pathways. Proper levels of ROS are also required for other cellular functions, including gene expression2.
For tumor cells, the basal production of ROS is slightly elevated; this is a consequence of increased rates of
metabolism and differences in the metabolic pathways used compared with non-transformed cells. Increased
ROS production in cancer cells is in the background of increased levels of gene mutation and relative hypoxia
compared with normal cells. Moderate increases in ROS levels in cancer cells are thought to contribute to tumor
promotion and progression, as they are involved in signaling and metabolic pathways and they enable DNA
mutation; however, as higher levels of ROS can induce apoptosis, autophagy and necroptosis in the same cells,
these cells also remove higher levels of ROS by increasing the activity of their antioxidant pathways3–5. Modu-
lating ROS levels could be a useful therapeutic strategy for treating c ancer6; for example, ROS inducers such as
doxorubicin and cisplatin have proven to be effective anticancer drugs. Most such drugs, however, induce ROS
not only in cancer cells but also in non-transformed cells, making their use as anticancer drugs less appealing
as they increase peripheral side effects and toxicity.
Metformin, a biguanide, is a prescribed drug for type 2 diabetes patients. It interacts with the respiratory
complex I of the electron transport chain (ETC) in mitochondria and makes a mild leakage of electron transport
to cause ROS production, leading to a mild reduction in ATP production. ATP reduction, in general, results in an
activation of AMP-activated protein kinase (AMPK), in turn inhibiting the mammalian target of the rapamycin
(mTOR) pathway and translating to a reduction in cell proliferation. Over-inhibition of mTOR pathway can also
induce apoptosis and cell-cycle arrest in the c ell7,8. Increased AMPK activity has also been reported to activate
the forkhead box O3a (FOXO3a, or FKHRL1) transcription factor via p hosphorylation9. FOXO3a belongs to
the FOXO family of transcription factors which play a crucial role in regulating cell cycle arrest, cell death, ROS
detoxification, metabolism and longevity10,11. FOXO3a protein mediates resistance to oxidative stress via tran-
scriptional activation of the ROS removal enzymes such as catalase and M nSOD10,12,13.
Differences between normal and cancer cells may involve alternate modes of energy metabolism with dif-
ferent yields of ATP produced from the glucose consumed by each cell type. In normal cells, in the presence of
optimal levels of oxygen, glucose is completely oxidized to C O2, generating 30 or 32 mol of ATP per mole of
glucose consumed; this process involves sequential TCA cycle and oxidative phosphorylation in m itochondria14.
When oxygen is limiting, pyruvate is metabolized to lactate instead. For cancer cells, even in the presence of
optimal levels of oxygen, glucose is mostly fermented to lactate, generating 2 mol of ATP per mole of glucose, a
behavior coined “the Warburg effect.” As oxidative phosphorylation in the mitochondria of cancer cells is heavily
downregulated15, the secretion of lactate due to the Warburg effect is thought to facilitate tumor p rogression16.
17,18
Metformin has been known to possess anti-cancer p roperties . In addition, metformin combined with
other anticancer drugs such as d oxorubicin19, trametinib20, and c isplatin21 t exerts a strong anticancer effect as
revealed in multiple xenograft animal models. However, those combination therapies still show serious toxic
effects. Although metformin is considered as a candidate for cancer therapy, metformin by itself is not currently
used in cancer patients. The current study sought to assess the anticancer activity of metformin in vitro and
in vivo when it was combined with an ROS amplifier, namely apigenin. Apigenin (4′,5,7-trihydroxy-flavone)
belongs to the class of ROS amplifiers22, a group of agents that increase intracellular ROS. Besides being an anti-
oxidant, apigenin also exhibits antibacterial, antiviral, and anti-inflammatory e ffects23. In normal cells, apigenin
upregulates anti-oxidant enzymes. However, in cancer cells, apigenin exhibits pro-oxidation properties24,25, and
several lines of evidence have shown apigenin possesses anticancer a ctivity26,27. Apigenin enhances anticancer
activity when it is co-administered with typical anticancer drugs such as g emcitabine28 and a bivertinib29 both
in vitro and in vivo.
Primary purpose of this study was to investigate whether the combination of metformin and apigenin can
shows a synergistic anticancer activity via a cancer cell-specific targeting. To achieve this aim, we carried out
the experiment if metformin exerts differential effects on ROS targeting-related pathway between the normal
and cancer cells. In addition, the possible synergistic effect of metformin and apigenin in the regulation of cell
growth inhibition, ROS amplification, and mitochondrial membrane potential inhibition, and cell death in cancer
cells. Furthermore, the effect of combination of metformin and apigenin on cancer tumor size in xenografted
nude mice was examined.
Results
Metformin differentially regulates cellular ROS and ATP levels in normal and cancer
cells. AsPC-1 (human pancreatic cancer) and HDF (human normal fibroblast) cells were treated with
increasing concentration of metformin (0.05 to 20 mM) for 48 h. When AsPC-1 cells were treated with met-
formin, cellular ROS levels increased in a concentration-dependent manner (p < 0.01) (Fig. 1A,B). When HDF
cells were treated with metformin, cellular ROS levels were not increased and remained at nearly an undetectable
level (Fig. 1A,B). Cellular ATP levels were almost unchanged by metformin in ASPC-1 cells but deceased by up
to 50% with metformin in HDF cells (p < 0.001) (Fig. 1C).
Metformin causes nuclear localization of p‑AMPK (Thr172) and p‑FOXO3a (Ser413) by activat‑
ing the AMPK/FOXO3a/MnSOD pathway in normal cells but not in cancer cells. We compared
AMPK activation by metformin in cancer and normal cells along with activation of FOXO3a, as the latter is
downstream of AMPK. AsPC-1 and HDF cells were treated with metformin (0.5, 1, 2 and 10 mM) for 24 h and
immunofluorescence analysis of the treated cells with anti p-AMPK (Thr172) and p-FOXO3a (Ser413) antibod-
ies. As shown, p-AMPK (Thr172) and p-FOXO3a (Ser413) were localized in the nucleus for HDF cells but were
more evenly distributed and mostly in the cytosol for AsPC-1 cells (Fig. 2A). Western blot analysis of cell lysates
Scientific Reports | (2021) 11:14002 | https://doi.org/10.1038/s41598-021-93270-0 2
Vol:.(1234567890)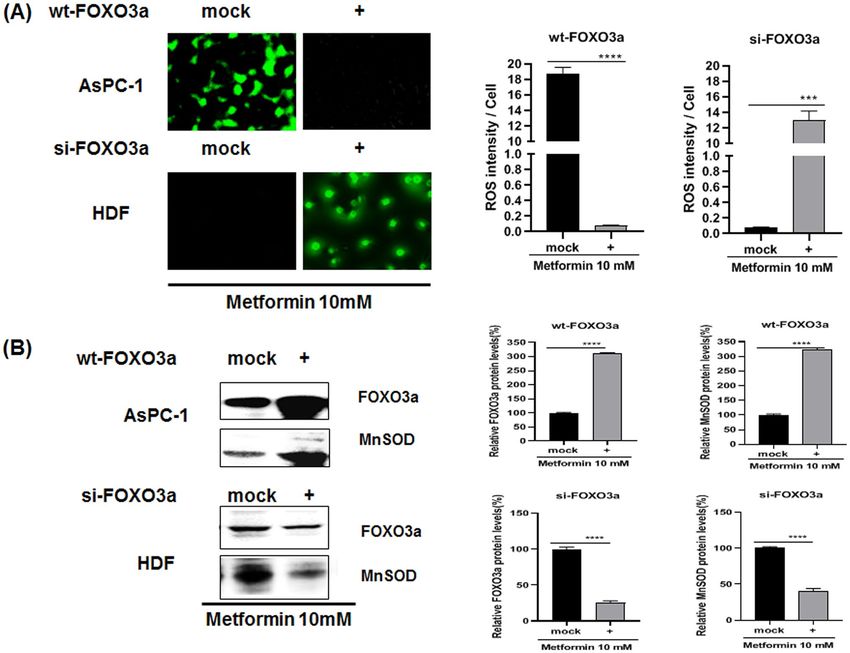
www.nature.com/scientificreports/

                                  Figure 1.  Effects of metformin on cellular ROS and ATP levels in human AsPC-1 and HDF cells. (A) Cellular
                                  ROS production was detected by CellROX Green staining in AsPC-1 and HDF cells after incubation with
                                  metformin (0, 0.05, 0.5, 1, 2, 10 and 20 mM) for 48 h. (B) Corresponding quantitative analysis of ROS levels. (C)
                                  Cellular ATP production was measured in ASPC-1 and HDF cells after incubation with metformin (0, 0.05, 0.5,
                                  and 5 mM) for 48 h. Three different measurements were performed for each sample. Statistical significance is
                                  indicated as *p < 0.05, **p < 0.01, ***p < 0.001, and ****p < 0.0001 compared with HDF group.

                                  Figure 2.  Nuclear localization and protein levels of p-AMPK (Thr172) and p-FOXO3a (Ser413) in metformin-
                                  treated AsPC-1 and HDF cells. AsPC-1 and HDF cells were treated with metformin (0.05, 0.5, 5 mM) for 24 h.
                                  (A) Immunostaining was performed in AsPC-1 and HDF cells using anti-p-AMPK (Thr172) and p-FOXO3a
                                  (Ser413) antibodies. Anti-mouse IgG, F(ab’)2 fragment (Alexa fluor 594 conjugate, red color) was used as the
                                  secondary antibody. DAPI (blue color) was used as the nucleus marker. (B) Levels of AMPK, p-AMPK (Thr172),
                                  FOXO3a, p-FOXO3a (Ser413) and MnSOD proteins were measured in metformin-treated AsPC-1 and HDF
                                  cells by western blot analysis. Three different measurements were performed for each sample. Statistical
                                  significance is indicated as *p < 0.05, **p < 0.01, ***p < 0.001, and ****p < 0.0001 compared with control group.

Scientific Reports |   (2021) 11:14002 |              https://doi.org/10.1038/s41598-021-93270-0                                                  3

                                                                                                                                            Vol.:(0123456789)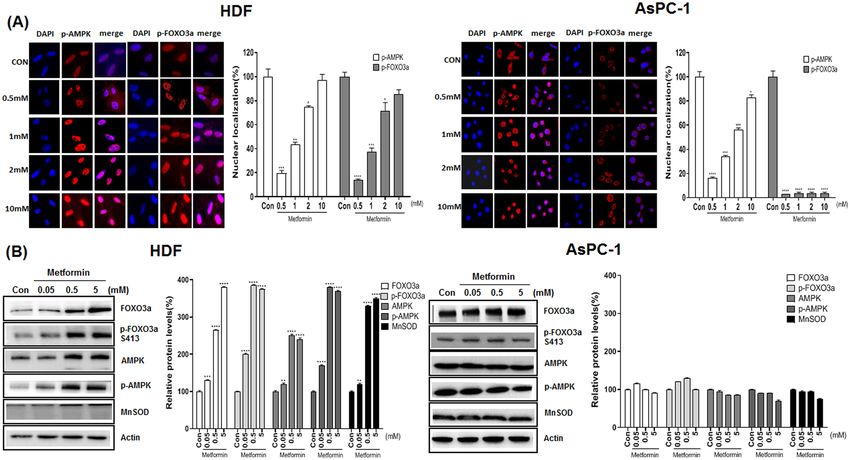
www.nature.com/scientificreports/

                                            Figure 3.  Effect of transfection with si-FOXO3a RNA or wt-FOXO3a plasmids on cellular ROS and protein
                                            levels in metformin-treated AsPC-1 and HDF cells. (A) Cellular ROS level of metformin-treated (for 24 h)
                                            AsPC-1 and HDF cells were measured by CellROX Green staining. AsPC-1 cells were transfected with
                                            si-FOXO3a RNA while HDF cells were transfected with wt-FOXO3a. The transfected cells were treated with
                                            metformin (10 mM) for 24 h; then cellular ROS levels were measured by CellROX Green staining. (B) Protein
                                            levels of FOXO3a and MnSOD were measured in the transfected and metformin-treated cells by western blot
                                            analysis using anti-FOXO3a and MnSOD antibodies. Three different measurements were performed for each
                                            sample. Statistical significance is indicated as *p < 0.05, **p < 0.01, ***p < 0.001, and ****p < 0.0001.

                                            with anti AMPK, p-AMPK (Thr172), FOXO3a, p-FOXO3a (Ser413) and MnSOD antibodies indicated that met-
                                            formin does not activate AMPK, FOXO3a and MnSOD in ASPC-1 cells; however, metformin (from 0.05 to
                                            5 mM) up-regulated p-AMPK (Thr172), p-FOXO3a (Ser413) and MnSOD only in HDF cells (p < 0.01) (Fig. 2B).

                                            Transfection with wild type FOXO3a (wt‑FOXO3a) and si‑FOXO3a RNA suggests that FOXO3a
                                            activation plays a key role in determining cellular ROS levels. To examine whether FOXO3a acti-
                                            vation contributes to cellular ROS levels, AsPC-1 cells were either mock transfected or transfected with wt-
                                            FOXO3a, both subsequently treated with 10 mM metformin. For HDF cells, they were mock transfected or
                                            transfected with si-FOXO3a RNA and then treated with 10 mM metformin as indicated (Fig. 3A). The intracel-
                                            lular ROS levels for this experiment were detected with CellROX staining of the cells and the cell lysates were
                                            also analyzed by western blotting (Fig. 3A,B). Cellular ROS levels were dramatically decreased in wt-FOXO3a-
                                            transfected AsPC-1 cells when compared with mock transfected cells (p < 0.0001) (Fig. 3A). Expression of
                                            FOXO3a and MnSOD proteins were also highly increased in wt-FOXO3a-transfected AsPC-1 cells compared
                                            with mock transfected cells (p < 0.0001) (Fig. 3B). On the other hand, cellular ROS levels were dramatically
                                            increased in si-FOXO3a RNA-transfected HDF cells (p < 0.001) when compared with mock transfected HDF
                                            cells and expression of FOXO3a and MnSOD were largely decreased in wt-FOXO3a-transfected HDF cells
                                            (p < 0.001) (Fig. 3A,B).

                                            Co‑treatment with metformin and apigenin affects cell survival, apoptosis and cellular ROS
                                            levels, and inhibits mitochondrial potential. To examine the anticancer activity of co-treatment with
                                            metformin and apigenin, AsPC-1 cells and HDF cells were treated with either metformin (5 mM), apigenin (1

          Scientific Reports |   (2021) 11:14002 |              https://doi.org/10.1038/s41598-021-93270-0                                               4

Vol:.(1234567890)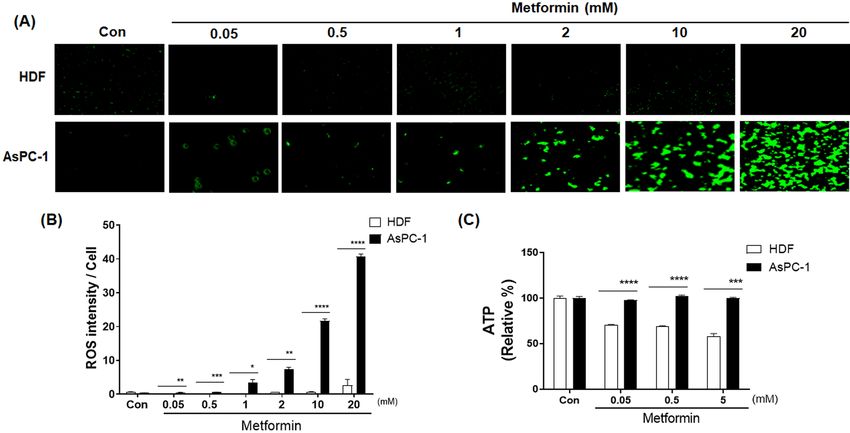
www.nature.com/scientificreports/
or 20 µM), or both metformin and apigenin up to 120 h. Cell growth/viability changes was examined by the
MTT assay. The results showed that metformin or apigenin alone causes little change in cell growth/viability for
AsPC-1 cells; however, co-treatment of the cells with metformin and apigenin cells led to a significant inhibi-
tion of cell growth/viability (Fig. 4A). In contrast, for HDF cells co-treatment with metformin and apigenin did
not significantly affect cell growth/viability (Fig. 4A). Cell cycle analysis via flowcytometry and cellular ROS
level changes via CellROX were also performed in response to varying levels of metformin and in the presence
or absence of apigenin (20 µM) in cancer cells treated for 24 h. Cell cycle analysis showed that co-treatment
with metformin and apigenin induces cell death in majority of AsPC-1 cells (Fig. 4B). As shown in Fig. 4C,
co-treatment with metformin (0.05, 0.5 or 5 mM) and apigenin (20 µM) dramatically increased cellular ROS
levels in AsPC-1 cells (p < 0.0001). However, the same co-treatment did not affect cellular ROS levels or extent
of cell death in HDF cells (Fig. 4B,C). In addition, the effect of N-acetyl cysteine (NAC), an ROS scavenger, was
gauged when co-treating the cancer cells in the presence of metformin and apigenin. From cell cycle analy-
sis, NAC blocked the metformin/apigenin co-treatment-induced cell death in AsPC-1 cells (Fig. 4B) and NAC
also blocked ROS increases seen with co-treatment with metformin and apigenin in the same cells (p < 0.0001)
(Fig. 4C). Combination of metformin (0.05, 0.5 or 5 mM) and apigenin (20 µM) also synergistically inhibited
mitochondrial membrane potential in AsPC-1 cells (p < 0.0001) (Fig. 4D), whereas the same treatment had a
lesser effect in HDF cells (p < 0.001) (Fig. 4D). In addition to AsPC-1 cells, co-treatment with metformin and
apigenin decreased cell viability and increased ROS levels (p < 0.01) in a synergistic manner in other cancer cells
such as MIAPaCa-2, DU145, LNCaP and HCC1195 cells (Fig. 4E,F).
Combination of metformin and apigenin leads to DNA damage‑induced apoptosis, autophagy
and necroptosis in AsPC‑1 cells but not in HDF cells. To examine the mechanism involved in com-
bination of metformin and apigenin-induced cell death, expression of DNA damage-related proteins was meas-
ured by western blot analysis in AsPC-1 and HDF cells. Levels of p-ATM, γ-H2AX, and DNA damage markers
were increased by combination of metformin and apigenin in AsPC-1 cells (p < 0.05), indicating that amplified
ROS induced severe DNA damage (Fig. 5A). DNA damage appeared to induce apoptosis as the levels of p-p53,
Bim, Bid, Bax, cleaved PARP, caspase 3, caspase 8, and caspase 9 were also significantly increased by combina-
tion of metformin and apigenin in AsPC-1 cells (p < 0.05), and not HDF cells (Fig. 5B). Cytochrome C was also
released from mitochondria in AsPC-1 cells, along with Bcl-2, an anti-apoptotic marker, becoming decreased in
AsPC-1 cells (p < 0.01) (Fig. 5B). Interestingly, autophagy-related proteins (AIF, P62 and LC3B) and necroptosis-
related proteins (MLKL, p-MLKL, RIP3 and p-RIP3) were also increased by combination of metformin and api-
genin (p < 0.05), suggesting that autophagy and necroptosis were also involved (Fig. 6A,B). In comparison, DNA
damage markers, apoptosis-, autophagy-, and necroptosis-related proteins were not altered by combination of
metformin and apigenin in HDF cells (Fig. 6A,B).
Combination of metformin and apigenin effectively reduces tumor growth in an in vivo
model. To test the effect of combination of metformin and apigenin on tumor growth, AsPC-1 (1 × 10⁷ cells)
cells were injected into athymic nude mice to generate a xenograft cancer model. When the xenografts had
reached about 80 m m3 in size, the mice were randomized into treatment groups of control (vehicle treated),
metformin (75 or 125 mg/kg), apigenin (5 or 40 mg/kg), or metformin/apigenin combination. The control/
drugs were given orally and twice daily as described in the “Materials and methods” section. As depicted in
Fig. 7A,D, the treatments were continued for a period of 4 weeks, with the tumor sizes monitored as the control
group reached an average of 1000 mm3 in size (starting from 80 mm3 in size). As seen in Fig. 7A, administration
of metformin (75 mg/kg) or apigenin (5 mg/kg) alone caused a little change of tumor size, but a combination of
two drugs decreased tumor size and weight in a synergistoical manner (Fig. 7B,C). Administration with higher
dose of metformin (125 mg/kg) or apigenin (40 mg/kg) caused a reduction of tumor size compared to the con-
trol group (Fig. 7D). However, oral administration of combination of metformin and apigenin decreased tumor
weight profoundly (p < 0.01) (Fig. 7E,F).
Discussion
In the present study, metformin increases ROS production in AsPC-1 cancer cells, but not in the HDF normal
cells. In addition, for AsPC-1 cells, ATP levels were not changed, whereas ATP levels were decreased in HDF cells.
Metformin-induced ROS production in normal cells appears to be primarily associated with signal molecules
such as AMPK, FOXO3a, and MnSOD. Our study clearly demonstrated that in normal cells metformin increases
AMPK and p-AMPK levels and in turn, elevations in FOXO3a and p-FOXO3a, finally leading to increases in
MnSOD levels. MnSOD causes a decrease in existing levels of ROS. For normal cells, metformin leads to AMPK
being activated from a decrease in ATP production in mitochondria. In contrast to the normal cells, metformin
did not affect AMPK, FOXO3a, and MnSOD levels in AsPC-1 cancer cells. Thus, increased ROS levels in cancer
cells appear to be due to the lack of MnSOD action. AMPK-induced activation of FOXO3a is a key step in allow-
ing a differential response between normal and cancer cells via metformin. AMPK-mediated phosphorylation
of FOXO3a S413 activates FOXO3a. When FOXO3a levels were reduced via si-FOXO3a transfection, ROS
increases were also seen in normal cells. We also found that when FOXO3a levels are raised by transfection
via wt-FOXO3a, ROS levels becomes undetectable in cancer cells. This result clearly suggests that FOXO3a is a
key molecule in bringing about this anticancer activity seen with metformin. In normal cells, many drugs are
known to bind to mitochondria, generate ROS and decrease production of ATP upon producing electron leakage
from the mitochondrial ETC. Some of these agents like metformin and apigenin result in a mild leakage in the
ETC30,31 and do not affect cellular integrity and cell survival. However, certain other chemicals such as KCN and
arsenic cause severe mitochondrial damage and induce cell death32,33. If agents that are not cytotoxic to normal
Scientific Reports | (2021) 11:14002 | https://doi.org/10.1038/s41598-021-93270-0 5
Vol.:(0123456789)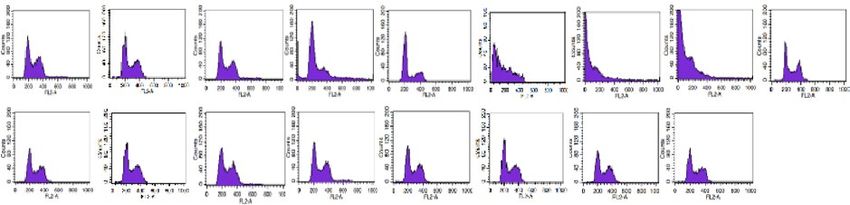
www.nature.com/scientificreports/

          Scientific Reports |   (2021) 11:14002 |   https://doi.org/10.1038/s41598-021-93270-0   6

Vol:.(1234567890)
www.nature.com/scientificreports/
◂Figure 4. Effect of combination metformin/apigenin on cell growth, cell cycle, cellular ROS and mitochondrial
membrane potential in AsPC-1 and HDF cells. (A) The effect of combination of metformin/apigenin on cell
proliferation/viability in AsPC-1 and HDF cells. The cells were treated with metformin (5 mM) alone, apigenin
(1 or 20 µM) alone or metformin/apigenin combination for 24 to 120 h and the cell proliferation/viability was
assessed by MTT assay. (B) Cell cycle was analyzed with PI staining of the cells (AsPC-1 and HDF) treated
with metformin (0.05, 0.5 or 5 mM) alone, apigenin (20 µM) alone or metformin/apigenin combination. (C)
Cellular ROS levels of metformin-treated (for 24 h) in AsPC-1 and HDF cells were measured by CellROX
Green staining when cells (AsPC-1 and HDF) were treated with metformin (0.05, 0.5 or 5 mM), apigenin
(20 µM) or combination of metformin and apigenin for 24 h. (D) Mitochondrial membrane potentials were
measured when cells (AsPC-1 and HDF) were treated with metformin (0.5 or 5 mM), apigenin (20 µM) or
combination of metformin/apigenin for 24 h. Effect of NAC (N-acetyl cysteine, 10 µM) pretreatment on ROS
production (A) and cell death (B) induced by combination of metformin/apigenin was examined. The effects of
combination of metformin (5 mM)/apigenin (1 and 20 μM) on cell proliferation/viability (E) and cellular ROS
level (F) in MIAPaCa-2, DU145, LNCaP and HCC1195 cells. Three different measurements were performed
for each sample. Statistical significance is indicated as *p < 0.05, **p < 0.01, and ****p < 0.0001 compared with
control group. ####p < 0.0001 compared with metformin (0.05, 0.5 or 5 mM)/apigenin (20 µM) treated group.
+
p < 0.05, +++p < 0.01, and ++++p < 0.0001 compared with ASPC-1 control group. ^^p < 0.01, ^^^p < 0.001 and
^^^^p < 0.0001 compared with HDF control group.
cells and only mildly affect mitochondrial membrane potential are combined, they may still be excellent for
amplifying ROS levels and inducing apoptosis in target cancer cells. One such agent is apigenin that is known
to bind mitochondria and only mildly decrease the membrane potential in the treated c ells30,31. Treatment with
metformin or apigenin alone in normal fibroblasts did not affect cell viability. For the same cells, the combina-
tion of metformin and apigenin decreased mitochondrial membrane potential greatly but it did not affect cel-
lular integrity and cell viability. In the present study, 5 mM of metformin itself inhibited MMP just partially in
HDF cells. This observation is in part correlated with finding that IC50 value of metformin for MMP inhibition
reported previously is 19 mM34. However, what we observed in the present is the finding that 5 mM of metformin
could strongly inhibit MMP when metformin (0.05, 0.5 or 5 mM) was combined with apigenin (20 µM). This
finding suggests that metformin interacts with apigenin for MMP inhibition in a synergistic manner. Based on
our results, the overall hypothetical diagram depicting differential cell death by combination of metformin and
apigenin between normal and cancer cells is described (Fig. 8). The exact reason for the synergistic increase on
ROS production with the combination of metformin and apigenin in many cancer cells is not currently clear.
However, it is speculated that metformin and apigenin may act via different mechanisms on the electron transport
system in mitochondria and these additively produce ROS in mitochondria in cancer cells. Our findings suggest
that the decrease of membrane potential by metformin and apigenin appeared to be synergistic when compared
to treatment by each drug alone. Our finding is in line with a previous study in that the decrease of membrane
potential by treatment metformin is well related with the increase of ROS production35.
We also found the combination of metformin and apigenin causing a reduction in cell growth in AsPC-1,
MIAPaCa-2, LNCaP, DU145 and HCC1195 cells in a synergistic manner as revealed by the MTT assay and an
induction of apoptosis in AsPC-1 cells as revealed by cell cycle analysis. This synergistic interaction was not
observed in HDF cells, suggesting that cell growth inhibition and apoptosis induction by combination of met-
formin and apigenin are cancer cell specific. The nullifying effects of NAC against metformin/apigenin-induced
ROS increase and apoptosis suggest that overproduction of ROS level appears to be primarily responsible for the
cell death. Excessive amounts of ROS can cause oxidative damage to lipids, proteins, and D NA5. It is documented
that if increases in ROS reaches a certain threshold that is detrimental to the cell with ROS exerting a cytotoxic
rogression36–38. In our observations,
effect. For cancer cells, this may lead to cell death and thus limit cancer p
a combination of metformin and apigenin generated much higher levels of ROS over that perceived threshold,
bringing about irreversible DNA damage.
The current study indicate that cell death induced by the combination of metformin and apigenin is mediated
through apoptosis, autophagy, and necroptosis as there were increases in the levels of the proteins for each of
these processes. For normal cells, these changes were not seen by the combination of metformin and apigenin,
suggesting that the anticancer activity induced by these two agents might be achieved by selective activation of
apoptosis, autophagy, and necroptosis pathways only for cancer cells.
From our in vivo experiment, we found that the individual oral administration with a lower dose of met-
formin (75 mg/kg) or apigenin (5 mg/kg) alone for 4 weeks did not affect much on tumor volume and weight.
However, a combination of metformin and apigenin for 4 weeks caused a synergistic reduction in tumor volume.
In addition to this finding, we found that individual oral administration of metformin (125 mg/kg) or apigenin
(40 mg/kg) alone at higher doses, to some extent, reduced tumor growth in the ASPC-1 xenograft. However, oral
administration of a combination of both metformin and apigenin almost completely inhibited tumor growth,
suggesting that a combination of the two drugs exerts a more profound anticancer effect in vivo.
Several studies have reported that apigenin exerts an inhibition on tumor growth in several cancer xenograft
models39–41. In addition, administration of metformin has also been documented to have a decrease in tumor
growth in several animal cancer m odels42,43. However, as metformin and apigenin individually do not exert
sufficiently robust antitumor activity, our findings suggest that combining metformin with apigenin may be
useful to further test in preclinical models of pancreatic and other cancer types and potentially for a new class
of normal-cell sparing anticancer drugs.
Scientific Reports | (2021) 11:14002 | https://doi.org/10.1038/s41598-021-93270-0 7
Vol.:(0123456789)www.nature.com/scientificreports/
(A) Metformin 5mM HDF Metformin 5mM AsPC-1
+ Apigenin 300 P-ATM + Apigenin 300 ****
P-ATM
****
γ-H2AX γ-H2AX
Con 0.1 1 10 20 (µ
µM) Con 0.1 1 ********
**** P-p53
P-p53 10 20 µM)
(µ
Relative protein levels(%)
Relative protein levels(%)
**** **** ****
********
**** Bcl-2
p-ATM Bcl-2 **** ****
BID p-ATM BID
200 **** Bax
200 Bax
γ-H2AX γ-H2AX
****
****
****
p-p53 p-p53 **** ***
**
Ser15 Ser15
**
*
100 **
Bcl-2 100 ***
Bcl-2 ****
BID BID
0
Bax 0 (µM)
Con
10
20
Con
10
20
Con
10
20
Con
10
20
Con
10
20
Con
10
20
0.1
1
0.1
1
0.1
1
0.1
1
0.1
1
0.1
1
(µM) Bax
Con
10
20
Con
10
20
Con
10
20
Con
10
20
Con
10
20
Con
10
20
0.1
1
0.1
1
0.1
1
0.1
1
0.1
1
0.1
1
Actin Metformin 5mM + Apigenin
Metformin 5mM + Apigenin Actin
(B) HDF AsPC-1
Metformin 5mM 300 PARP Metformin 5mM 300 **** PARP
+ Apigenin Caspase 3 + Apigenin
****
****
**** ****
Caspase 3
Caspase 8 ****
Relative protein levels(%)
Relative protein levels(%)
**** **** Caspase 8
Con 0.1 1 10 20 (µ
µM) Caspase 9 Con 0.1 1 10 20 (µ
µM) **** Caspase 9
Cyto C **** **** ******** ****
cleaved cleaved ****
Cyto C
200 Bim 200 **** **** Bim
PARP PARP ****
**
Caspase 3 Caspase 3
**
Caspase 8 Caspase 8
100 100
***
Caspase 9 Caspase 9
****
Cyto C Cyto C
0 0
(µM)
Con
10
20
Con
10
20
Con
10
20
Con
10
20
Con
10
20
Con
10
20
0.1
1
0.1
1
0.1
1
0.1
1
0.1
1
0.1
1 (µM)
Con
10
20
Con
10
20
Con
10
20
Con
10
20
Con
10
20
Con
10
20
0.1
1
0.1
1
0.1
1
0.1
1
0.1
1
0.1
1
Bim Bim
Metformin 5mM + Apigenin
Actin Actin Metfomin 5mM + Apigenin
Figure 5. Levels of DNA damage- and apoptosis-related proteins in metformin and apigenin-cotreated AsPC-1
and HDF cells. AsPC-1 and HDF cells were treated with metformin (5 mM) and apigenin (0.1, 1, 10 or 20 μM)
for 48 h. Cell extracts were prepared and subjected to western blot analysis. DNA damage-related proteins were
analyzed with anti-p-ATM, H2AX, and p-p53 (Ser15) antibodies. Apoptosis-related proteins were analyzed
with anti-BID, Bax, cleaved-PARP, cleaved-caspase 3, 8, 9, cytochrome C, and Bim antibodies. Three different
measurements were performed for each sample. Statistical significance is indicated as *p < 0.05, **p < 0.01,
***p < 0.001, and ****p < 0.0001 compared with control group.
Figure 6. Levels of autophagy- and necroptosis-related proteins in metformin/apigenin-combination treated
AsPC-1 and HDF cells. AsPC-1 and HDF cells were treated with metformin (5 mM) and apigenin (0.1, 1, 10 or
20 μM) for 48 h. Cell extracts were prepared and subjected to western blot analysis. Autophagy-related proteins
were analyzed with anti-AIF, P62 and LC3B antibodies. Necroptosis-related proteins were analyzed with anti-
MLKL, p-MLKL, RIP3 and p-RIP3 antibodies. Three different measurements were performed for each sample.
Statistical significance is indicated as *p < 0.05, **p < 0.01, ***p < 0.001, and ****p < 0.0001 compared with control
group.
Scientific Reports | (2021) 11:14002 | https://doi.org/10.1038/s41598-021-93270-0 8
Vol:.(1234567890)www.nature.com/scientificreports/
Figure 7. Effect of metformin and apigenin on tumor growth in xenograft model of nude mice. AsPC-1 (1 × 10⁷
cells in 100 μl) cells were injected subcutaneously into the dorsal flank of athymic nude mice. When tumors
reached a size of approximately 80 m m3, mice were administered orally with metformin (75 mg/kg), apigenin
(5 mg/kg), or combination of two drugs in a group. In another group, mice were administered orally with
metformin (125 mg/kg), apigenin (40 mg/kg) or the combination of two drugs. The drugs were administered
twice a day for a total of 28 days. (A) and (D): Tumor volume was measured for up to four weeks. (B) and (E):
Weights of excised tumors were measured at the end of the study. (C) and (F): Photographs of excised tumors in
each group are shown. Statistical significance is indicated as **p < 0.01, and ***p < 0.001 compared with control
group.
Materials and methods
Reagents. MTT reagents and propidium iodide (PI) were obtained from Sigma-Aldrich (St. Louis, MO).
The CellROX Green reagent, DMEM, FBS, trypsin, penicillin–streptomycin and Hanks Balanced Salt Solution
were purchased from Thermo Fisher Scientific (Waltham, MA); Lipofectamine was obtained from Invitrogen
(Carlsbad, CA). The Lowery assay reagent was from BioRad (Hercules, CA). The immunoblot PVDF (polyvi-
nylidene difluoride) membrane and Immobilon reagent were both purchased from Millipore (St. Louis, MO).
The Mitochondrial Membrane Potential kit and the ATP Assay kit were purchased from Cayman (Ann Arbor,
MI). The Lactate Assay and Mitochondrial Isolation kits along with the PI/RNase solution were purchased
from Abcam (Cambridge, MA). Anti-AMPK, p-AMPK (Thr172), FOXO3a, p-FOXO3a (Ser413) and MnSOD
p-ATM, γ-H2AX, p-p53, Bim, Bid, Bax, cleaved-PARP, cleaved-caspases 3, 8, and 9, cytochrome C and Bcl-2
antibodies and the secondary anti-mouse IgG-horseradish peroxidase antibody were obtained from Cell Signal-
ing (Danvers, MA).
Cell culture. The human cancer cell lines such as AsPC-1 (human pancreatic cancer), MIAPaCa-2 (human
pancreatic cancer), LNCaP (human prostate cancer), DU145 (human prostate cancer) and HCC1195 (human
lung cancer) were purchased from the Korean Cell Line Bank (Seoul, Korea) and the HDF (human primary
dermal fibroblast) was obtained from the Dermatology Laboratory of Seoul National University Medical School
(Seoul, Korea). The cultured cells were grown in the media of DMEM with 10% FBS-penicillin–streptomycin in
a humidified 5% CO2 incubator at 37 °C.
MTT assay. The 3-(4,5-dimethylthiazol-2-yl)-2,5-diphenyltetrazolium bromide (MTT) colorimetric assay
protocol was performed as described by M osmann44. For the assay, the cells were seated in 96-well culture plates
(2 × 10³ cells/well) for 24 h. The cells were then treated with the indicated drugs or control (DMSO carrier) up
to 120 h. The culture media in each well was replaced with 10 µl of stock MTT solution in 100 µl of DMEM and
the plates were incubated for 4 h. MTT solution was replaced with 100 µl of DMSO. The plates were incubated
for 1 h. The absorbance yields of control and drug-treated wells were measured at 570 nm using an automated
microplate reader (Thermo Fisher Scientific, Waltham, MA). These values were then used to calculate the viabil-
ity/proliferation changes relative to control wells.
Scientific Reports | (2021) 11:14002 | https://doi.org/10.1038/s41598-021-93270-0 9
Vol.:(0123456789)www.nature.com/scientificreports/
Figure 8. Hypothetical diagram depicting mechanism of differential cell death induced by combination of
metformin and apigenin between HDF and AsPC-1 cells.
Cell cycle analysis. Drug-treated/control cells were grown for 48 h and then harvested by trypsinization.
The cells were then washed with 1 × PBS and fixed in 70% ethanol at − 20 °C overnight. After the fixation, the
cells were washed twice with 1 × PBS and then collected by centrifugation. The cells were resuspended in PI/
RNase solution (Abcam) and incubated for 1 h. The cell cycle was measured using the FACS Vantage SE cell
sorter (Becton Dickinson, Franklin Lakes, NJ). Cell cycle analysis was performed using ModFit LT software
(Verity Software, Topsham, ME).
Immunofluorescence. The cellular localization of p-FOXO3a (Thr172) or p-AMPK (Ser413) proteins in
AsPC-1 and HDF cells was determined by immunofluorescence antibody staining. First, the cells were treated
with 0.5, 1, 10 and 20 mM of metformin, grown on glass slides for 24 h and were then washed with 1 × PBS.
The cells were fixed in 4% formaldehyde at room temperature for 15 min; they were then washed with 1xPBS
and incubated in blocking buffer (1% BSA in PBS) for 1 h. The slides were again washed with 1 × PBS and then
diluted anti-FOXO3a, p-FOXO3a (Ser413), AMPK, p-AMPK (Thr172) antibodies were added to the cells on
the slides. The slides were incubated in dark at 4 °C overnight. After washing the slides twice with 1 × PBS, the
diluted fluorophore-conjugated secondary antibody was added and incubated at room temperature in dark for
1 h. After washing the slides twice with 1 × PBS, the slides were incubated with the DAPI solution (0.1 µg/ml
double distilled water) for 2 min and washed with 1 × PBS for three times. One drop of mounting reagent was
added to the slides, and were covered with a cover glass and incubated at room temperature overnight. The pho-
tographs were taken using a confocal microscope (Carl Zeiss LSM710).
ROS measurement. To determine the cellular ROS levels in drug-treated AsPC-1 and HDF cells, the cells
were grown for 24 h and then washed with 1 × PBS. The cells were incubated with the fluorogenic probe, Cell-
ROX Green, for 2 h and were then fixed with 4% paraformaldehyde. The photographs were taken using a fluo-
rescence microscope (absorption 485 nm, emission 520 nm) (Zeiss Axiovert 200, Zeiss, Oberkochen, Germany).
ROS intensity of each picture was quantified using Photoshop CS4 (Adobe Systems, San Jose, CA) software after
subtraction of background fluorescence measured in the nucleus. Cellular ROS level was calculated through
dividing ROS intensity by cell numbers in a picture and plotted in bar.
Scientific Reports | (2021) 11:14002 | https://doi.org/10.1038/s41598-021-93270-0 10
Vol:.(1234567890)www.nature.com/scientificreports/
Western blots analysis. The cells were first harvested by trypsinization and then washed twice with cold
1 × PBS. The cells were resuspended in the extraction buffer (150 mM NaCl/50 mM EDTA, pH 8.0/1% Non-
diet p-40) containing the mixture of protease inhibitors (1 mM phenylmethyl methyl sulfonyl fluoride, 5 µg/ml
aprotinin, 5 µg/ml leupeptin). After centrifugation at 14,000 rpm, 4 °C for 30 min, the supernatant was collected
and used for western blot analysis, with the remaining lysate stored at − 70 °C. The protein concentration of each
lysates was determined using the Lowry protein assay reagent (Thermo Fisher Scientific, Waltham, MA). The
protein bands of the cell lysates were resolved in 12% SDS-PAGE gels and they were then electrically transferred
onto a PVDF membrane for western probing. The membrane was blocked in 5% nonfat powder milk in TBST
(50 mM Tris, pH 7.5, 150 mM NaCl, 0.1% Tween 20) for 2 h. The membrane was incubated overnight with the
probing antibody diluted in TBST, washed and incubated with the diluted-anti-mouse IgG-horseradish peroxi-
dase for 2 h. The resulting protein bands were visualized with the Immobilon reagent according to the manufac-
ture’s protocol (Merck Millipore, Burlington, MA). The protein band intensity for each membrane probing was
captured and measured using an image analyzer (Fusion FX7, Vilber Korea, Seoul, Korea). The final figures were
prepared from original protein bands using Adobe Photoshop CS4 program.
In vivo test of anticancer activity. All procedures were conducted in accordance with the ‘Guide for Care
and Use of Laboratory Animals’ published by the National Institute of Health. This work was carried out in com-
pliance with the ARRIVE guidelines45. Four-week-old female athymic nude mice (Koatech, Seoul, Korea) were
received and allowed to acclimatize for a week. AsPC-1 cells (1 × 10⁷ cells/100 µl) were then injected subcutane-
ously at the flank region of mice. Drug treatment was initiated at 7-days post injection of the cancer cells with
the tumors being palpable to a mean volume of 80 m m3. The animals were randomly allocated to four groups (8
mice per group); these included the control group (vehicle treated); metformin group; apigenin group; and the
combination group. Control (vehicle treated), metformin (75 or 125 mg/kg), apigenin (5 or 40 mg/kg) or the
combination of two drugs were dissolved in 0.5% carboxymethyl cellulose (CMC); Drugs were twice daily, orally
administrated. Tumor volume and body weight were measured once a week. The tumor volume assessment
was with a Vernier caliper measurement along two perpendicular axes of the tumor lump, using the formula of
total volume being equal to (length × width2)/2. After 28 days of treatment, the mice were sacrificed by cervical
vertebral dislocation and the tumors were extracted immediately. Tumor weights at the sacrifice time were then
measured. All animal procedures and experimental protocols were approved by Laboratory Animal Committee
of Hallym University (Hallym 2020-23).
Statistical analysis. Statistical analysis was carried out by student t test using the GraphPad Prism Version
4.0 software for Windows (GraphPad Software, San Diego, CA). P-values of less than 0.05 were considered to
indicate statistical significance. All values were expressed as mean ± S.E.M.
Received: 4 February 2021; Accepted: 21 June 2021
References
1. Bedard, K. & Krause, K. H. The NOX family of ROS-generating NADPH oxidases: physiology and pathophysiology. Physiol. Rev.
87, 245–313. https://doi.org/10.1152/physrev.00044.2005 (2007).
2. Forman, H. J., Ursini, F. & Maiorino, M. An overview of mechanisms of redox signaling. J. Mol. Cell. Cardiol. 73, 2–9. https://doi.
org/10.1016/j.yjmcc.2014.01.018 (2014).
3. Diwanji, N. & Bergmann, A. An unexpected friend—ROS in apoptosis-induced compensatory proliferation: implications for
regeneration and cancer. Semin. Cell. Dev. Biol. 80, 74–82. https://doi.org/10.1016/j.semcdb.2017.07.004 (2018).
4. He, L. et al. Antioxidants maintain cellular redox homeostasis by elimination of reactive oxygen species. Cell. Physiol. Biochem.
44, 532–553. https://doi.org/10.1159/000485089 (2017).
5. Scherz-Shouval, R. & Elazar, Z. Regulation of autophagy by ROS: physiology and pathology. Trends Biochem. Sci. 36, 30–38. https://
doi.org/10.1016/j.tibs.2010.07.007 (2011).
6. Perillo, B. et al. ROS in cancer therapy: the bright side of the moon. Exp. Mol. Med. 52, 192–203. https://doi.org/10.1038/s12276-
020-0384-2 (2020).
7. Han, G., Gong, H., Wang, Y., Guo, S. & Liu, K. AMPK/mTOR-mediated inhibition of survivin partly contributes to metformin-
induced apoptosis in human gastric cancer cell. Cancer Biol. Ther. 16, 77–87. https://d oi.o
rg/1 0.4 161/1 53840 47.2 014.9 87021 (2015).
8. Zhao, D. et al. Metformin decreases IL-22 secretion to suppress tumor growth in an orthotopic mouse model of hepatocellular
carcinoma. Int. J. Cancer 136, 2556–2565. https://doi.org/10.1002/ijc.29305 (2015).
9. Greer, E. L. et al. An AMPK-FOXO pathway mediates longevity induced by a novel method of dietary restriction in C. elegans.
Curr. Biol. 17, 1646–1656. https://doi.org/10.1016/j.cub.2007.08.047 (2007).
10. Kops, G. J. et al. Forkhead transcription factor FOXO3a protects quiescent cells from oxidative stress. Nature 419, 316–321. https://
doi.org/10.1038/nature01036 (2002).
11. Libina, N., Berman, J. R. & Kenyon, C. Tissue-specific activities of C. elegans DAF-16 in the regulation of lifespan. Cell 115, 489–502.
https://doi.org/10.1016/s0092-8674(03)00889-4 (2003).
12. Alcendor, R. R. et al. Sirt1 regulates aging and resistance to oxidative stress in the heart. Circ. Res. 100, 1512–1521. https://doi.org/
10.1161/01.RES.0000267723.65696.4a (2007).
13. Nemoto, S. & Finkel, T. Redox regulation of forkhead proteins through a p66shc-dependent signaling pathway. Science 295,
2450–2452. https://doi.org/10.1126/science.1069004 (2002).
14. Fadaka, A. et al. Biology of glucose metabolization in cancer cells. J. Oncol. Sci. 3, 45–51. https://doi.org/10.1016/j.jons.2017.06.
002 (2017).
15. Vander Heiden, M. G., Cantley, L. C. & Thompson, C. B. Understanding the Warburg effect: the metabolic requirements of cell
proliferation. Science 324, 1029–1033. https://doi.org/10.1126/science.1160809 (2009).
Scientific Reports | (2021) 11:14002 | https://doi.org/10.1038/s41598-021-93270-0 11
Vol.:(0123456789)www.nature.com/scientificreports/
16. Jiang, B. Aerobic glycolysis and high level of lactate in cancer metabolism and microenvironment. Genes Dis. 4, 25–27. https://doi.
org/10.1016/j.gendis.2017.02.003 (2017).
17. Kheirandish, M., Mahboobi, H., Yazdanparast, M., Kamal, W. & Kamal, M. A. Anti-cancer effects of metformin: recent evidences
for its role in prevention and treatment of cancer. Curr. Drug Metab. 19, 793–797. https://doi.o rg/1 0.2 174/1 38920 02196 66180 4161
61846 (2018).
18. Zhao, B. et al. Anticancer mechanisms of metformin: a review of the current evidence. Life Sci. 254, 117717. https://doi.org/10.
1016/j.lfs.2020.117717 (2020).
19. Li, Y., Wang, M., Zhi, P., You, J. & Gao, J. Q. Metformin synergistically suppress tumor growth with doxorubicin and reverse drug
resistance by inhibiting the expression and function of P-glycoprotein in MCF7/ADR cells and xenograft models. Oncotarget 9,
2158–2174. https://doi.org/10.18632/oncotarget.23187 (2018).
20. Ko, E., Baek, S., Kim, J., Park, D. & Lee, Y. Antitumor activity of combination therapy with metformin and trametinib in non-small
cell lung cancer cells. Dev. Reprod. 24, 113–123. https://doi.org/10.12717/DR.2020.24.2.113 (2020).
21. Guo, L. et al. Metformin enhances anti-cancer effect of cisplatin in meningioma through AMPK-mTOR signaling pathways. Mol.
Ther. Oncolytics https://doi.org/10.1016/j.omto.2020.11.004 (2020).
22. Park, S., Lim, W., Bazer, F. W. & Song, G. Apigenin induces ROS-dependent apoptosis and ER stress in human endometriosis cells.
J. Cell. Physiol. 233, 3055–3065. https://doi.org/10.1002/jcp.26054 (2018).
23. Xu, L. et al. The anticancer potential of apigenin via immunoregulation. Curr. Pharm. Des. https://doi.org/10.2174/1381612826
666200713171137 (2020).
24. Andueza, A. et al. Oxidation pathways underlying the pro-oxidant effects of apigenin. Free Radic. Biol. Med. 87, 169–180. https://
doi.org/10.1016/j.freeradbiomed.2015.06.003 (2015).
25. Miyoshi, N., Naniwa, K., Yamada, T., Osawa, T. & Nakamura, Y. Dietary flavonoid apigenin is a potential inducer of intracellular
oxidative stress: the role in the interruptive apoptotic signal. Arch. Biochem. Biophys. 466, 274–282. https://doi.org/10.1016/j.abb.
2007.07.026 (2007).
26. Sung, B., Chung, H. Y. & Kim, N. D. Role of apigenin in cancer prevention via the induction of apoptosis and autophagy. J. Cancer
Prev. 21, 216–226. https://doi.org/10.15430/JCP.2016.21.4.216 (2016).
27. Yan, X., Qi, M., Li, P., Zhan, Y. & Shao, H. Apigenin in cancer therapy: anti-cancer effects and mechanisms of action. Cell Biosci.
7, 50. https://doi.org/10.1186/s13578-017-0179-x (2017).
28. Lee, S. H. et al. Enhanced anti-tumor effect of combination therapy with gemcitabine and apigenin in pancreatic cancer. Cancer
Lett. 259, 39–49. https://doi.org/10.1016/j.canlet.2007.09.015 (2008).
29. Huang, S. et al. Apigenin and Abivertinib, a novel BTK inhibitor synergize to inhibit diffuse large B-cell lymphoma in vivo and
vitro. J. Cancer 11, 2123–2132. https://doi.org/10.7150/jca.34981 (2020).
30. Morrissey, C. et al. Apigenin drives the production of reactive oxygen species and initiates a mitochondrial mediated cell death
pathway in prostate epithelial cells. Prostate 63, 131–142. https://doi.org/10.1002/pros.20167 (2005).
31. Shi, M. D., Shiao, C. K., Lee, Y. C. & Shih, Y. W. Apigenin, a dietary flavonoid, inhibits proliferation of human bladder cancer T-24
cells via blocking cell cycle progression and inducing apoptosis. Cancer Cell Int. 15, 33. https://d oi.o rg/1 0.1 186/s 12935-0 15-0 186-0
(2015).
32. Leavesley, H. B., Li, L., Prabhakaran, K., Borowitz, J. L. & Isom, G. E. Interaction of cyanide and nitric oxide with cytochrome c
oxidase: implications for acute cyanide toxicity. Toxicol. Sci. 101, 101–111. https://doi.org/10.1093/toxsci/kfm254 (2008).
33. Woo, S. H. et al. Arsenic trioxide induces apoptosis through a reactive oxygen species-dependent pathway and loss of mitochondrial
membrane potential in HeLa cells. Int. J. Oncol. 21, 57–63. https://doi.org/10.3892/ijo.21.1.57 (2002).
34. Hannah, R. B., Andrew, J. Y. J., Michael, N. P. & Judy, H. Effects of metformin and other biguanides on oxidative phosphorylation
in mitochondria. Biochem. J. 15, 475–487. https://doi.org/10.1042/BJ20140620 (2014).
35. Hsieh, S.-M. et al. Metformin causes cancer cell death through downregulation of p53-dependent differentiated embryo chondro-
cyte 1. J. Biomed. Sci. 25, 81. https://doi.org/10.1186/s12929-018-0478-5 (2018).
36. Nishikawa, M. Reactive oxygen species in tumor metastasis. Cancer Lett. 266, 53–59. https://doi.org/10.1016/j.canlet.2008.02.031
(2008).
37. Nogueira, V. & Hay, N. Molecular pathways: reactive oxygen species homeostasis in cancer cells and implications for cancer therapy.
Clin. Cancer Res. 19, 4309–4314. https://doi.org/10.1158/1078-0432.CCR-12-1424 (2013).
38. Storz, P. Reactive oxygen species in tumor progression. Front Biosci. 10, 1881–1896. https://doi.org/10.2741/1667 (2005).
39. Lin, C. C. et al. Apigenin induces apoptosis through mitochondrial dysfunction in U-2 OS human osteosarcoma cells and inhibits
osteosarcoma xenograft tumor growth in vivo. J. Agric. Food Chem. 60, 11395–11402. https://doi.org/10.1021/jf303446x (2012).
40. Shao, H. et al. Apigenin sensitizes colon cancer cells to antitumor activity of ABT-263. Mol. Cancer Ther. 12, 2640–2650. https://
doi.org/10.1158/1535-7163.MCT-13-0066 (2013).
41. Yang, J., Pi, C. & Wang, G. Inhibition of PI3K/Akt/mTOR pathway by apigenin induces apoptosis and autophagy in hepatocellular
carcinoma cells. Biomed. Pharmacother. 103, 699–707. https://doi.org/10.1016/j.biopha.2018.04.072 (2018).
42. Ko, Y., Choi, A., Lee, M. & Lee, J. A. Metformin displays in vitro and in vivo antitumor effect against osteosarcoma. Korean J. Pediatr.
59, 374–380. https://doi.org/10.3345/kjp.2016.59.9.374 (2016).
43. Xia, C. et al. Metformin combined with nelfinavir induces SIRT3/mROS-dependent autophagy in human cervical cancer cells and
xenograft in nude mice. Eur. J. Pharmacol. 848, 62–69. https://doi.org/10.1016/j.ejphar.2019.01.045 (2019).
44. Mosmann, T. Rapid colorimetric assay for cellular growth and survival: application to proliferation and cytotoxicity assays. J.
Immunol. Methods 65, 55–63. https://doi.org/10.1016/0022-1759(83)90303-4 (1983).
45. Percie du Sert, N. et al. Reporting animal research: explanation and elaboration for the ARRIVE guidelines 2.0. PLoS Biol. 18(7),
e3000411. https://doi.org/10.1371/journal.pbio.3000411 (2020).
Acknowledgements
This work was funded by a grant from FrontBio Inc.
Author contributions
M.S.W., K.C.H. and I.Gz. carried out in vitro experiments. K.B.G. performed figure drawing and statistical
analysis. P.S.H. and J.J.S. performed animal experiments. K.S.C. managed in vitro experiments. S.H.W., L.S.S.
and F.J.H. participated manuscript writing. L.J.Y. managed whole project and wrote the manuscript.
Competing interests
The authors declare no competing interests.
Additional information
Supplementary Information The online version contains supplementary material available at https://doi.org/
10.1038/s41598-021-93270-0.
Scientific Reports | (2021) 11:14002 | https://doi.org/10.1038/s41598-021-93270-0 12
Vol:.(1234567890)www.nature.com/scientificreports/
Correspondence and requests for materials should be addressed to J.-Y.L.
Reprints and permissions information is available at www.nature.com/reprints.
Publisher’s note Springer Nature remains neutral with regard to jurisdictional claims in published maps and
institutional affiliations.
Open Access This article is licensed under a Creative Commons Attribution 4.0 International
License, which permits use, sharing, adaptation, distribution and reproduction in any medium or
format, as long as you give appropriate credit to the original author(s) and the source, provide a link to the
Creative Commons licence, and indicate if changes were made. The images or other third party material in this
article are included in the article’s Creative Commons licence, unless indicated otherwise in a credit line to the
material. If material is not included in the article’s Creative Commons licence and your intended use is not
permitted by statutory regulation or exceeds the permitted use, you will need to obtain permission directly from
the copyright holder. To view a copy of this licence, visit http://creativecommons.org/licenses/by/4.0/.
© The Author(s) 2021
Scientific Reports | (2021) 11:14002 | https://doi.org/10.1038/s41598-021-93270-0 13
Vol.:(0123456789)You can also read