MIRNA 200C EXPRESSION IN FANCONI ANEMIA PATHWAY FUNCTIONALLY DEFICIENT LUNG CANCERS - NATURE
←
→
Page content transcription
If your browser does not render page correctly, please read the page content below
www.nature.com/scientificreports
OPEN MiRNA‑200C expression in Fanconi
anemia pathway functionally
deficient lung cancers
Wenrui Duan1,2,3*, Shirley Tang3, Li Gao1, Kathleen Dotts3, Andrew Fink3, Arjun Kalvala3,
Brittany Aguila3, Qi‑En Wang4 & Miguel A. Villalona‑Calero1,5*
The Fanconi Anemia (FA) pathway is essential for human cells to maintain genomic integrity
following DNA damage. This pathway is involved in repairing damaged DNA through homologous
recombination. Cancers with a defective FA pathway are expected to be more sensitive to cross-link
based therapy or PARP inhibitors. To evaluate downstream effectors of the FA pathway, we studied
the expression of 734 different micro RNAs (miRNA) using NanoString nCounter miRNA array in two
FA defective lung cancer cells and matched control cells, along with two lung tumors and matched
non-tumor tissue samples that were deficient in the FA pathway. Selected miRNA expression was
validated with real-time PCR analysis. Among 734 different miRNAs, a cluster of microRNAs were
found to be up-regulated including an important cancer related micro RNA, miR-200C. MiRNA-200C
has been reported as a negative regulator of epithelial-mesenchymal transition (EMT) and inhibits
cell migration and invasion by promoting the upregulation of E-cadherin through targeting ZEB1 and
ZEB2 transcription factors. miRNA-200C was increased in the FA defective lung cancers as compared
to controls. AmpliSeq analysis showed significant reduction in ZEB1 and ZEB2 mRNA expression. Our
findings indicate the miRNA-200C potentially play a very important role in FA pathway downstream
regulation.
FA is an autosomal recessive disorder (with an exception of the complementation group B, being X-linked) most
commonly associated with DNA damage, progressive bone marrow failure (BMF) and escalated risks of c ancer1–5.
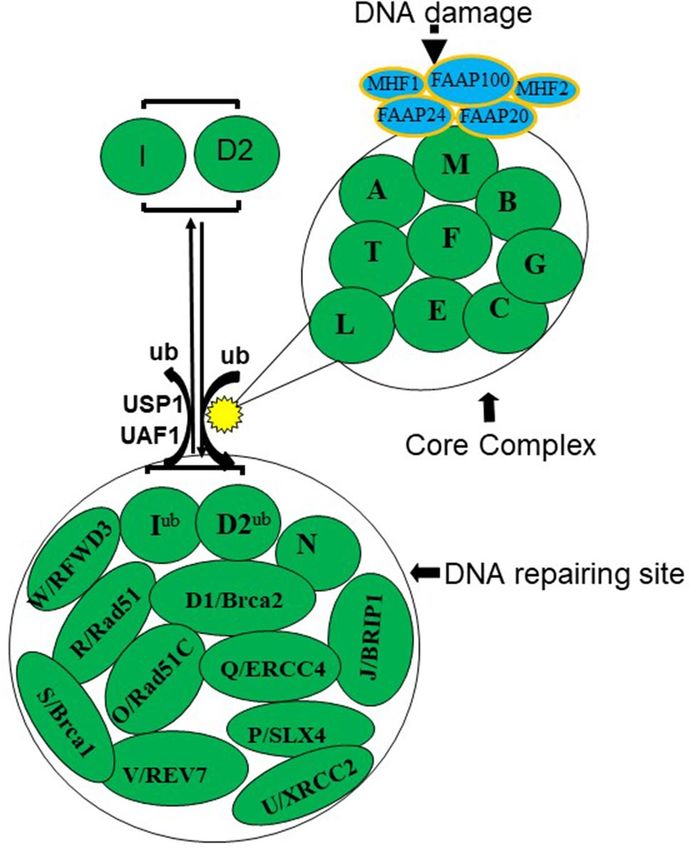
This complex heterogeneous disease is linked to mutations in 22 genes2 identified to date (Fig. 1), referred to
as FA subtypes A, B, C, D1/BRCA2, D2, E, F, G, I, J/BRIP1, L, M, N/PALB2, O/RAD51C, P/SLX4, Q/ERCC4,
R/RAD51, S/BRCA1, T/UBE2T2,3, U/XRCC24, V/REV75 and W/RFWD36. Normal function of these genes is
necessary for the FA pathway to operate mediating homologous recombination, interstrand cross-linked (ICL)
repairs, and other DNA repair f unctions7–10. Cells with FA pathway deficiency are hypersensitive to DNA damage
agents such as cisplatin and mitomycin C (MMC). It has also been shown that patient tumor with germ line FA
gene deficiency (e. g. BRCA1, BRCA2, Rad51C) are sensitive to DNA damaging agents and inhibitors of other
repair pathways such as PARP i nhibitors11–13.
The FA pathway consists of Core Complex proteins and other downstream FA proteins involved in DNA
repair process1. The FA Core Complex consists of FANCA, B, C, E, F, G, L, M and T (UBET2) along with other
additional associated proteins, including FAAP100, FAAP24, FAAP20, and the histone fold dimer proteins
MHF1 and MHF2 10,14,15.
The FA Core Complex serves as a nuclear E3 ubiquitin ligase for two other very important FA proteins,
FANCD2 and FANCI14–19. The activated FANCD2–FANCI heterodimeric proteins are subsequently transported
to sub-nuclear foci, thought to be the sites of DNA repair, which also contain FA pathway downstream proteins
including the DNA repair proteins FANCD1 (BRCA2), J, N, O, P, Q, R, S, U, V and W 1–6,10,14,15,20–22. De-ubiquit-
ination of FANCD2 by the ubiquitin-specific protease 1 (USP1), FANCR(RAD51) by FANCW(RFWD3) result
in these protein inactivation and release from the sites of DNA repair 21–24 (Fig. 1). Since the Core Complex
proteins ubiquitinate and activate FANCD2, thus the FANCD2 protein is the key effector protein in the FA
pathway. FANCD2 is converted from a small (S) to a large (L) form by mono-ubiquitination during S phase of
1
Department of Human and Molecular Genetics, Herbert Wertheim College of Medicine, The Florida International
University, Miami, FL 33199, USA. 2Biomolecular Sciences Institute, The Florida International University, Miami,
FL 33199, USA. 3Comprehensive Cancer Center at The Ohio State University College of Medicine and Public
Health, Columbus, OH 43210, USA. 4Department of Radiation Oncology, Comprehensive Cancer Center, The Ohio
State University, Columbus, OH 43210, USA. 5Department of Medical Oncology and Therapeutics Research, City of
Hope National Medical Center, Duarte, CA 91010, USA. *email: wduan@fiu.edu; mvillalona@coh.org
Scientific Reports | (2021) 11:4420 | https://doi.org/10.1038/s41598-021-83884-9 1
Vol.:(0123456789)
www.nature.com/scientificreports/
Figure 1. The Fanconi anemia (FA) pathway. The FA pathway consists of Core Complex proteins and other
downstream FA proteins involved in DNA repair process. The FA Core Complex consists of FANCA, B, C,
E, F, G, L, M and T (UBET2) along with other additional proteins that associate with the FA Core Complex,
including FAAP100, FAAP24, FAAP20, and the histone fold dimer proteins MHF1 and MHF2. The FA Core
Complex activates FANCD2 and FANCI by mono-ubiquitinating the protein as a response to DNA damage.
The activated FANCD2–I heterodimeric proteins are subsequently transported to sub-nuclear foci, thought
to be the sites of DNA repair, which also contain FA downstream proteins including the DNA repair proteins
FANCD1(BRCA2), D2, I, J, N, O, P, Q, R, S (BRCA1), U, V and W.
cell cycle or following induction of DNA double-strand breaks or interstrand c rosslinks14–16. Any mutation or
epigenetic change that disrupts components of the Core Complex also abrogates its E3 ligase function, leading
to defective FA pathway.
In order to evaluate functionality of the FA pathway, we developed a Triple-Staining Immunofluorescence
method (FATSI), which is able to detect FANCD2 foci formation or lack of formation in paraffin embedded
tumor tissues8,13. In one study, a total of 139 non-small cell lung cancer formalin-fixed paraffin embedded (FFPE)
tumor samples were screened; 104 were evaluable for FANCD2 foci status. Eighty-one of the 104 (81/104, 78%)
evaluable tumors were found FANCD2 foci positive and 23 (22%) were foci negative9. In a separate study, we
analyzed total of 643 human solid tumors and one hundred eighty-five of 643 (185/643, 28.7%) screened patients
were FANCD2 foci n egative13, documenting a 19.7% of lung cancers being functionally deficient.
Recent studies showed that MicroRNA (miRNA) expression is associated with DNA repair p athways24. MiR-
NAs are small, 18 to 25 nucleotide noncoding RNAs, which regulate target genes mRNA levels and direct regula-
tion of protein synthesis of target genes25. MiRNAs play important endogenous roles in biological pathways of
mammals and multicellular organisms via targeting mRNA26–29. Increasing evidence suggests that microRNAs
can function as either oncogenes or tumor suppressor genes30. They derive from larger precursors, which form
stem-loop structures with the mature miRNA as one arm of the precursor hairpin released by ribonuclease III
(RNase III)31.
MiRNAs are critical to cancer development due to their regulatory effects on genes involved in apoptosis,
cell cycle progression, differentiation, migration, metabolism, epithelial-mesenchymal transition and tumor cell
invasion and m etastasis26–29. Among these regulations, the most common way is via translational silencing of
gene expression via suppression or degradation by binding to target mRNA at the 3′ untranslated region UTR
through base pairing27,32,33. A single miRNA may target several hundred mRNAs and can function as oncogenes
or tumor suppressors 26,32–34. Many studies have shown that certain miRNAs can serve as potential cancer bio-
markers for diagnosis or p rognosis27,34–36.
We report herein results of our evaluation of regulation and expression of miRNAs in FA pathway deficient
cancers and discuss potential implications on their use as predictive or prognostic biomarkers.
Scientific Reports | (2021) 11:4420 | https://doi.org/10.1038/s41598-021-83884-9 2
Vol:.(1234567890)www.nature.com/scientificreports/
Figure 2. Western blot analysis of FANCD2 protein expression. Non-small cell lung cancer cells H1299 and
A549 were transduced with FANCD2-specific shRNA-expressing or empty vector and puromycin-resistant
lentiviral particles. The transduced cells were selected in 4 ug/ml puromycin to create stably transduced cells
with reduced FANCD2 expression, the H1299D2D and A549D2D. H1299E and A549E were transduced with
empty lentiviral particles. FANCD2 protein expression was confirmed by western blot analysis.
Methods
Tissue samples and FA triple‑stain immunofluorescence analysis (FATSI). Human non-small cell
lung cancer (NSCLC) samples were obtained from the Tissue Procurement Shared Resources of the Ohio State
University Comprehensive Cancer Center and The Cooperative Human Tissue Network, Midwestern Division
at The Ohio State University, after institutional review board (IRB) approval. A total of 29 non-small cell lung
cancer samples, including 16 FANCD2 foci negative and 13 foci positive tumors, and matched non-tumor tissue
samples were analyzed.
FFPE tumor tissue was cut at 4 microns, placed on positively charged slides, and stained with hematoxy-
lin–eosin. Additional sections for immunofluorescence staining were processed as described p reviously8,9. Briefly,
slides were laced in a 60 °C oven for 1 h, cooled, deparaffinized, and rehydrated through xylenes and graded
ethanol solutions to water in standard fashion. The tissue sections were incubated with a primary antibody
cocktail of rabbit polyclonal FANC-D2 antibody (Novus Biologicals, Littleton, CO, Catalog #: NB100-182) at a
dilution of 1:1000 and a monoclonal anti-Ki67 mouse antibody (Dako, Carpenteria, CA, USA, Catalog #: M7240)
at a dilution of 1:150 for 1 h at room temperature. Sections then were co-incubated with a secondary antibody
fluorescein isothiocyanate (FITC) conjugated to anti-rabbit immunoglobulin (Ig)G (Novus Biologicals, Littleton,
CO, Catalog #: NBP2-30342F) and Alexa Fluor 594 donkey anti-mouse IgG (Invitrogen, Carlsbad, California,
Catalog #: A32744 ) at 1:1000 for 1 h at room temperature. All rinses were performed on the auto-stainer with
TBS-T. The sections were mounted on glass slides using a DAPI-containing embedding medium (Vysis Dapi
1, Abbott Laboratories, Downers Grove, Ill). The slides were analyzed under a Nikon (Tokyo, Japan) E-400
fluorescence microscope8.
FANCD2 defective cells. The FANCD2 foci defective cells, A549D2D and H1299D2D were created by
knocking down FancD2 expression as described previously9. Briefly, non-small cell lung cancer cells A549 and
H1299 were plated 24 h prior to transduction and when the cells reached 60% confluence, cells were transduced
with FANCD2-specific shRNA-lentiviral particles conferring resistance to puromycin. Control shRNA lentiviral
particles were also transduced into the cells (Santa Cruz Biotechnology Inc., Santa Cruz, CA, Catalog#: SC-
35356-V) according to the manufacturer’s protocol. One day after incubation in medium containing polybrene
agent, these transduced cells were transferred to a dish that contains normal growth medium. The transduced
cells were selected in 4ug/ml puromycin. To create stably transduced cells, 100–200 transduced cells were cul-
tured in a 100 mm dish, and medium was replaced with fresh puromycin-containing medium every 3 days, until
resistant colonies were identified. Twenty colonies were picked for each cell line, and then the colonies were
expanded. Successful FANCD2 knockdown was confirmed by western blot (Fig. 2). The FA effective cells, A549E
and H1299E were A549 and H1299 cells transfected with empty vectors. SV40 transformed empty retroviral vec-
tor transduced human FANCD2 defective fibroblasts PD20RV (FancD2 deletion) and their wild-type FANCD2
transduced counterparts PD20D2 (FANCD2 effective)37 were obtained from the Oregon Health and Science
University Fanconi Anemia Cell Repository using as control cells.
Western immunoblot analysis. Western immunoblot analysis was performed as described previously9.
Briefly, cells were digested with the cell lysis buffer (Cell Signaling Technology Inc., Danvers, MA, Catalog #:
9803). Protein concentrations were evaluated using the Bradford reagent (Bio-Rad, Hercules, CA, USA). One
hundred micrograms of total protein was loaded onto NuPAGE 4–12% Bis–Tris Gel (Invitrogen, Carlsbad, CA,
USA). Protein on the gels was electro-transferred onto nitrocellulose membranes and blocked with blocking
buffer (5% of non-fat milk, 500 mM of NaCl, 20 mM Tris, and 0.1% Tween 20). The membranes were incubated
with primary anti-bodies at 4 °C overnight. After washing with TBS-T (blocking buffer without milk) five times,
10 min each, the membranes were incubated with anti-mouse IgG (Amersham Pharmacia Biotech, Piscataway,
NJ, USA, Catalog #: NA931) or anti-rabbit IgG horse radish peroxidase linked to whole secondary antibodies
(Amersham Pharmacia Biotech, Piscataway, NJ, USA, Catalog #: NA934) at room temperature for 1 h. A chemi-
Scientific Reports | (2021) 11:4420 | https://doi.org/10.1038/s41598-021-83884-9 3
Vol.:(0123456789)www.nature.com/scientificreports/
luminescent detection system (ECLwestern blotting detection reagents, GE) was used to detect the secondary
antibody. Finally, the membranes were exposed to x-ray films. Antibodies used were rabbit polyclonal FANCD2
antibody (NovusBiologicals, Littleton, CO, USA, Catalog #: NB100-182) and anti-Actin monoclonal (Sigma, St.
Louis, MI, USA, Catalog #: A2228).
RNA extraction. Total RNA was extracted from cell and tissue samples via TRIzol Reagent isolation follow-
ing the protocol supplied by the manufacturer (Thermo Fisher Scientific, Waltham, MA, Catalog #:15,596,026).
RNA samples were treated with DNase to remove contaminating DNA and stored in –80 °C freezer.
NanoString nCounter miRNA expression. nCounter miRNA assays are highly sensitive and based on
direct molecular barcoding and digital detection of targeted RNA molecules of interest though target-specific
color-coded probe pairs and does not require conversion of RNA to cDNA by reverse transcription via PCR.
Probe pairs have a reporter probe carrying signals on 5′ end, and a capture probe with biotin ion at 3′. Hybridiza-
tion washes away access probes and allows for RNA probe complexed to be aligned and immobilized for data col-
lection of absolute miRNA e xpression38. Based on the miRNA Expression Assay User Manual from NanoString
Technologies, RNA samples were normalized to 33 ng/uL in DEPC water. An annealing master mix was created
(13µL Annealing Buffer, 26µL nCounter miRNA Tag Reagent, and 6.5 µL 1:500 miRNA Assay Controls dilu-
tion). 3.5 µL of the master mix was aliquoted to 12 × 0.2 mL strip tubes with 3µL (100 ng) RNA sample and cycled
with Annealing Protocol. 2.5 µL Ligation master mix (19.5 VL PEG, 13µL Ligation buffer) was added to each
tube at 48 °C in thermocycler and incubated for 5 min before adding 1.0uL ligase for ligation protocol. 1.0 µL of
Ligation Clean-Up Enzyme was added to each reaction and the tubes were removed from heat to be spun down
before returning to cycler for purification protocol. DEPC (40µL) was added to each sample for hybridization. 20
µL master mix (130 µL Reporter Code set, 130 µL hybridization buffer) were added to each clean tube with 5uL
aliquot of miRNA sample in DEPC. 5uL of Capture probe set was added to each tube before placing in preheated
65 °ºC thermocycler and incubated for 12 h. The samples where then placed in post-hybridization processing
with nCounter Prep Station immediately after removal from thermocycler. Background correction factors were
added to miRNAs, technical normalization using positive control, and biological normalization was performed
for absolute miRNA expression.
Quantitative real time PCR. Quantitation of miRNAs was carried out using TaqMan microRNA assays
(Applied Biosystems, Foster City, CA) as described previously39. MicroRNA-200C expression kit (catalog #
4,427,975, Assay ID: 002,286) and FANCD2 gene expression kit (Catalog # 4,331,182, Assay ID: Hs00276992_
m1) were purchased from the ThermoFisher Scientific (ThermoFisher Scientific /Applied Biosystems, Fos-
ter City, CA). Reverse transcription was performed by using TaqMan MicroRNA Reverse Transcription Kit
(Applied Biosystems, Foster City, CA). The PCR amplification was conducted in 25 μl reaction using the TaqMan
Universal PCR Master Mixture, No AmpErase UNG kit (Applied Biosystems, Foster City, CA) following the
protocol provided by the manufacturer. Real-time PCR was carried out in a 96-well plate using a Bio-Rad CFX96
system. Every sample was done in triplicate and each reaction was repeated at least once to ensure reproduc-
ibility. The PCR cycle number at threshold (CT) was used for the comparison. The relative quantitative method
was used for the quantitative analysis40. Resulting data was quantified and normalized using RNU48 as control.
Ion AmpliSeq RNA gene expression. Reverse transcription was performed on RNA samples with 1 µL
10X Superscript III Enzyme Mix, 5X VILO RT Reaction Mix, and Nuclease-free water to 10 µL for each sample
to obtain cDNA. Targets were amplified by adding 4uL 5X Ion AmploSqe HiFi Master Mix, 4 µL 5X Ion RNA
panel, Nuclease-free water, and cDNA for a total of 20 µL. The reaction was run according to AmplisSeq RNA
Library Kit User Guide from Thermofisher. Primer sequences were partially digested with addition of 2 µL FuPa
Reagent and cycle accordingly before ligation to the amplicons and purification. The Library was then amplified
and quantified for resulting gene expression results tissue derived RNA samples.
Cell viability analysis. The cell viability analysis was described previously9,39. Five thousand FA defective
and control lung cancer cells from each line (H1299E/H1299D2D, A549E/A549D2D), were seeded in each well
of a 96-well plate. Cells were cultured in RPMI 1640 medium with 10% fetal bovine serum and 1% penicillin/
streptomycin in a humidified incubator (37 °C, 5% of CO2) for 48 h. Dimethylthiazolyl-2-5-diphenyltetrazolium
bromide (MTT) dye solution (Sigma, St. Louis, MO, USA) was added into the 96-well plate for 4 h, and the
treatment terminated by adding stop solution (isopropanol with 0.04 N HCl). Absorbance at 570 nm wavelength
was recorded using a Bio-Rad micro plate reader (Bio-Rad Laboratories, Inc., Hercules, CA). Each cell line was
repeated in quadruplicate on same plate and each experiment was repeated at least once to ensure reproduc-
ibility. An averaged absorbance of blank values (containing all reagents except cells) was subtracted from all
absorbance to yield corrected absorbance. The relative absorbance of each sample was calculated by comparing
the average of corrected absorbance with an average of corrected c ontrol9,39.
Results
miRNAs expression by NanoString analysis. RNA samples isolated from the PD20RV, PD20D2,
A549E, A549D2D, H1299E and H1299D2D cells as well as two FANCD2 foci negative human non-small cell
lung cancers and matched non-tumor tissues, were used for miRNA expression analysis by NanoString nCoun-
ter count. After background correction and data normalization, 734 different miRNAs were detected, and fold
change was calculated based on FANCD2 deficiency over control samples. A cluster of 10 miRNAs were found
Scientific Reports | (2021) 11:4420 | https://doi.org/10.1038/s41598-021-83884-9 4
Vol:.(1234567890)www.nature.com/scientificreports/
Fold change in H1299 (deficient/ Fold change in A549 (deficient/ Fold change in PD20 (deficient/
Detector Sequence efficient) efficient) efficient)
uaaagugcuuauagugcagguag(20a)
hsa-miR-20a + hsa-miR-20b − 1.70 − 5.58 − 25.67
caaagugcucauagugcagguag(20b)
hsa-miR-129-3p aagcccuuaccccaaaaagcau 1.32 − 2.39 − 3.07
hsa-miR-626 agcugucugaaaaugucuu 2.02 − 2.33 − 2.20
hsa-miR-1288 gcagaucaggacuguaacucacc − 1.16 2.51 2.37
hsa-miR-26a uucaaguaauccaggauaggcu − 1.21 7.40 370.36
hsa-miR-143 ggugcagugcugcaucucuggu 2.38 − 1.01 2.52
hsa-miR-921 cuagugagggacagaaccaggauuc 2.52 − 1.44 2.16
hsa-miR-184 uggacggagaacugauaagggu 2.46 2.03 − 1.53
hsa-miR-567 aguauguucuuccaggacagaac 2.10 3.34 − 1.14
hsa-miR-873 gcaggaacuugugagucuccu 1.56 2.79 2.16
hsa-miR-1282 ucguuugccuuuuucugcuu 2.07 4.18 1.68
hsa-miR-933 ugugcgcagggagaccucuccc 2.21 2.23 1.44
hsa-miR-200c cgucuuacccagcaguguuugg 13.52 1.44 5.76
Table 1. miRNAs expression in Fanconi anemia pathway deficient cells.
Figure 3. Evaluation of miRNA-200C expression with TaqMan microRNA real time PCR analysis in the
FANCD2 defective and control cells. FANCD2 defective cells H1299D2D, A549D2D and PD20RV as well as
matched control cells H1299E, A549E and PD20D2 cells were cultured and total RNA samples were isolated.
Quantitation of miRNA expression was carried out using TaqMan real time polymerase chain reaction (PCR).
Primers and probes used for the real time PCR analysis were obtained from Applied Biosystems (Foster City,
CA). Real-time PCR was carried out in a 96-well plate using a Bio-Rad CFX96 system. Each sample was done in
triplicate and each reaction was repeated at least once to ensure reproducibility. Resulting data were quantified
and normalized using RNU48 as control.
to be consistently up-regulated by at least twofold in two of the three cell lines (A549, H1299 and PD20), and a
cluster of 3 miRNAs were found to be down regulated by at least twofold in two of the three groups in FANCD2
foci deficient samples as compared to their respective non deficient control samples (Table 1). Among all these
miRNAs, miRNA-200C had consistently higher expression (6.9 fold on average) in FANCD2 foci deficient cells
compared to matched control cells (Table 1). In addition, miRNA-200C expression was 22.02 folds higher in
average in two FANCD2 foci defective lung cancer tissues comparing to expression of this miRNA in matched
non-tumor tissues.
Quantitative real time PCR analysis of miRNA‑200C expression. To validate the results from
NanoString analysis, quantitative PCR was used with the same cell lines along with 29 tumor and non-tumor
pairs (13 FANCD2 foci positive, 16 FANCD2 foci negative). TaqMan miRNA-200C assay was employed along
with RNU48 as an internal control. As depicted in Fig. 3, FANCD2 knock-down A549 cells (A549D2D) showed
significant overexpression of miRNA-200C compared to the matching counterpart control A549E cell lines
(p = 1.068e−3). Similarly, H1299 FANCD2 knockdown (H1299D2D) cells showed significant (p = 7.984e−3)
overexpression of miRNA-200C as comparing to control cells H1299E. In PD20 (FANCD2 deficient) fibroblasts
cell lines, FANCD2 was transduced into the cells to generate PD20D2. Our results indicated that miRNA-200C
was also significantly overexpressed in the FANCD2 deficient PD20RV (empty vector) cell as compared to trans-
duced wild type FANCD2 PD20D2 cell (p = 3.325e−3).
In 13 FANCD2 foci positive tumor samples, miRNA-200C expression did not vary significantly between
tumors and adjacent non-tumor samples. In contrast on the 16 FANCD2 foci negative tumors, significant over-
expression was observed in tumors as comparing to non-tumor tissue. After normalization of the human tumors
Scientific Reports | (2021) 11:4420 | https://doi.org/10.1038/s41598-021-83884-9 5
Vol.:(0123456789)www.nature.com/scientificreports/
Figure 4. TaqMan real time PCR analysis of miRNA-200C expression in the FANCD2 foci defective and foci
positive lung tumor tissues. TaqMan real time PCR was employed for analyzing miRNA-200C in FANCD2
foci positive and foci negative tumor samples. Out of the 16 FANCD2 foci negative tumors, the miRNA-200C
was increased in 13 (81%) cases as compared to matched non-tumor lung tissue (A). Comparably, among 13
FANCD2 foci positive tumor samples, miRNA-200C was increased in 7(54%) cases (B). The average of fold
change on miRNA-200C in the foci negative samples was 2.7 indicating overexpression in the foci negative
tumors compared to matched non-tumor lung tissue. Comparably the averaged fold change in 13 foci positive
tumors was nearly 1 which indicates miRNA-200C expression does not vary significantly between tumor and
non-tumor counterpart for FANCD2 foci positive tumors (C).
with their respective non-tumor tissue, a significant overexpression (p = 1.848e−3) of miRNA-200C in foci nega-
tive tumors was observed compared to the FANCD2 foci positive tumors as depicted in Fig. 4A–C.
AmpliSeq analysis of miRNA‑200C target genes. Previous studies have demonstrated that endoge-
nous miRNA-200C suppresses EMT by regulating cell adhesion through targeting the E-cadherin transcriptional
repressors ZEB1 and ZEB241,42. AmpliSeq data from FANCD2 knockdown lung cancer cells and 10 FANCD2
Scientific Reports | (2021) 11:4420 | https://doi.org/10.1038/s41598-021-83884-9 6
Vol:.(1234567890)www.nature.com/scientificreports/
Figure 5. AmpliSeq analysis of ZEB1 and ZEB2 Gene RNA Expression. AmpliSeq analysis was used to analyze
FANCD2 knockdown lung cancer cells and 10 FANCD2 foci negative tumor samples and matched non-tumor
lung tissues in ZEB1, and ZEB2 expression levels. Both ZEB1 and ZEB2 are miRNA-200C downstream genes.
Increased miRNA-200C expression in FANCD2 deficient samples would impact on expression of its target
genes. A: FANCD2 knockdown lung cancer cells. B: Among the 10 FANCD2 foci negative tumor samples and
matched non-tumor lung tissues (non-tumor control value is 1), 100% showed downregulation of ZEB1 and
90% for ZEB2 compared to matched non-tumors.
foci negative tumor samples were used with a gene expression panel with specific interest in ZEB1, and ZEB2
expression levels. Both ZEB1 and ZEB2 mRNA expressions were reduced in FANCD2 knockdown lung cancer
cells (Fig. 5A). All 10 tumor samples (100%) showed reduced mRNA expression in ZEB1, and 9 out of 10 sam-
ples (90%) showed reduction in ZEB2 expression as compared to matched non-tumors (Fig. 5B).
Number of viable cells was reduced in the FANCD2 knockdown lung cancer cells A549D2D
and H1299D2D. To investigate the influence of FANCD2 knockdown in cell proliferation, we investigated
viability of the FANCD2 knockdown lung cancer cells (A549D2D and H1299D2D) using MTT assay. The num-
ber of viable cells was reduced in the FANCD2 knockdown cells, A549D2D and H1299D2D as comparing to
their counterparts the A549E and H1299E respectively (Fig. 6). There were 70% viable cells in the H1299D2D
comparing to H1299E, and 88% viable cells in the A549D2D comparing to A549E cell. These results indicate the
number of viable cells was reduced in the FANCD2 knockdown lung cancer A549D2D and H1299D2D cells.
Discussion
MiRNA-200C was found to have tumor-suppressive properties, including inhibition of the epithelial-mesenchy-
mal transition (EMT), and invasion and metastasis in several cancers35,42–46. Furthermore, miRNA-200C had also
been identified as a prognostic biomarker for NSCLC47. Ectopic overexpression of miRNA-200C down regulates
p-EGFR and p-AKT and increases radiosensitivity in several cancer cell l ines45.
Herein we report that miRNA-200C is an important FANCD2 downstream regulator of cell proliferation
and cancer cell metastasis. Based on our study, miRNA-200C was upregulated in the FANCD2 foci deficient
non-small cell lung cancer cells and tumor tissues. Both, NanoString nCounter data and real time PCR analysis
showed overexpression of miRNA-200C in FANCD2 deficient samples compared to their non-deficient counter
parts. This is the first study that shows correlation between the Fanconi Anemia pathway and miRNA expression
Scientific Reports | (2021) 11:4420 | https://doi.org/10.1038/s41598-021-83884-9 7
Vol.:(0123456789)www.nature.com/scientificreports/
Figure 6. Cell viability of the FANCD2 knockdown lung cancer A549D2D and H1299D2D cells. Cells were
cultured in RPMI 1640 medium with 10% fetal bovine serum and 1% penicillin/streptomycin in a humidified
incubator (37 °C, 5% of C O2) for 48 h. Each cell line was repeated in quadruplicate. Absorbance at 570 nm
wavelength was recorded using a micro plate reader. An averaged absorbance of blank values (containing all
reagents except cells) was subtracted from all absorbance to yield corrected absorbance. The relative absorbance
of each FANCD2 knockdown cell was calculated by comparing the average of corrected absorbance with an
average of corrected absorbance of control cell. Each value presented in this figure was an average value obtained
from 4 measurements. The error bars show standard deviation. (A) H1299D2D /H1299E, (B) A549D2D/A549E.
in lung cancer cells and tumor tissues. Furthermore, when using FANCD2 knockdown lung cancer cells and
tumor samples with high miRNA-200C expression, we found that the expression of ZEB1 and ZEB2 were dras-
tically down regulated. This inverse relationship correlates with previous studies showing that miRNA-200C
inhibits epithelial-mesenchymal transition, invasion, and migration of lung cancer by targeting ZEB1 and ZEB2
genes35,44–49.
A recent study showed expression levels of miR-200C was no significant change in human non-small cell lung
cancers (NSCLCs) as it is compared to normal adjacent tissues by real-time PCR50. In current study, the average
of fold change on miRNA-200C in the 16 FANCD2 foci negative non-small cell lung cancer was 2.7 indicating
overexpression in the foci negative tumors compared to matched non-tumor lung tissue. However, the averaged
fold change on miRNA-200C in 13 FANCVD2 foci positive non-small cell lung cancers was nearly 1 which
indicates miRNA-200C expression was no difference between tumor and non-tumor counterpart (Fig. 4A,B).
Since the lung cancers reported in the Nourmohammadi et al.50 were non-FA-associated NSCLC, the miRNA-
200C was no significant change. In contrast, the NSCLC samples in the FANCD2 foci negative cohort were FA
defective tumors in the current study. In these FANCD2 foci negative tumors, miRNA-200C was upregulated
compared to matched non-cancer tissues. Our results suggest that FA deficiency upregulates the miRNA-200C
expression in NSCLC.
In A459 cells overexpressing miR-200C resulted in downregulation of EMT through downregulating N-cad-
herin and upregulating E-cadherin. Furthermore miR-200C has also been shown to significantly reduce cell
invasion and migration through inhibition of ZEB2 e xpression44. It has also been reported that downregulation
of miR-200C resulted in decreased E-cadherin through upregulation of Z EB151. Reduction in E-cadherin through
ZEB1 leads to increase in cell motility; leading to epithelial mesenchymal transition (EMT). In addition, miR-
200C overexpression significantly accelerates cell cycle arrest at G0/G1 phase, inhibits cell proliferation, and
Scientific Reports | (2021) 11:4420 | https://doi.org/10.1038/s41598-021-83884-9 8
Vol:.(1234567890)www.nature.com/scientificreports/
athway35. Thus, the FANCD2 may regulate
induces apoptosis in A549 cells, possibly by activating the p53/p21 p
cell cycle and metastasis indirectly through the regulation of miRNA-200C expression.
We have also investigated the viability of the FANCD2 knockdown lung cancer cells (A549D2D and
H1299D2D) using MTT assay. We found the number of viable cells was reduced in the FANCD2 knockdown
cells A549D2D and H1299D2D as comparing their counterparts the A549E and H1299E respectively (Fig. 6).
This indicates FANCD2 knockdown results in a reduction in number of viable cells in lung cancer.
MicroRNAs are found in a variety of body fluids including blood, saliva and urine, where they are quantifi-
able and extremely stable. For these reasons, miRNAs are excellent candidates as non-invasive biomarkers for
early diagnosis of human disease, and for monitoring treatment response in cancer p atients52. In our current
research, the cells (A549 and H1299) and human tissues are from lung cancer patients. The miRNAs reported
in this study are related to DNA homologous recombination repair deficiency, thus miRNA-200C and other FA
related miRNAs are potential biomarkers of DNA repair deficiency in patients with lung cancer.
We noticed that the miRNA-200C expression was 1.44 folds higher in the A549D2D cell comparing to A549E
cell (Table 1). We think this may be associated the incomplete FANCD2 knocking down in the A549 cell. Our
knocking down strategy did not result in 100% ablation of FANCD2 expression. Therefore, it is possible that
the partial FANCD2 expression was remained in the A549D2D cell. A small amount of the monoubiquitinated
FANCD2 (the L-form of the FANCD2) remained in the A549D2D cells (Fig. 2), whereas the monoubiquitinated
FANCD2 was absent from the H1299 D2D cell. Therefor we think the insignificant up-regulation of miR-200C
in A549D2D cell may be caused by the incomplete knocking down of FANCD2 expression.
In addition to miR200C, other miRNAs (e.g. miRNA-26a, 143, 921, 184, 567, 873, 933, 1282 and 1288) were
also found to be up-regulated, and a cluster of miRNAs (e.g. miRNA-20a, 20b, 129-3p and 262) were found to be
downregulated in FANCD2 foci defective non-small cell lung cancer cells. It would be very interesting to study
the biological function of these miRNAs, in particular the miRNA-20 (a and b), in regulation of cell proliferation
in non-small cell lung cancers. In conclusion, the FA pathway regulates downstream genes through microRNAs
in lung cancer and that MiRNA-200C appears to play a very important role in this regulation.
Received: 28 December 2019; Accepted: 9 February 2021
References
1. Niraj, J., Färkkilä, A. & D’Andrea, A. D. The Fanconi anemia pathway in cancer. Annu. Rev. Cancer Biol. 3, 457–478 (2019).
2. Liu, W. et al. Fanconi anemia pathway as a prospective target for cancer intervention. Cell Biosci. 10, 39 (2020).
3. Virts, E. L. et al. AluY-mediated germline deletion, duplication and somatic stem cell reversion in UBE2T defines a new subtype
of Fanconi anemia. Hum. Mol. Genet. 24, 5093–5108 (2015).
4. Park, J. Y. Complementation of hypersensitivity to DNA interstrand crosslinking agents demonstrates that XRCC2 is a Fanconi
anaemia gene. J. Med. Genet. 53, 672–680 (2016).
5. Bluteau, D. et al. Biallelic inactivation of REV7 is associated with Fanconi anemia. J. Clin. Invest. 126, 3580–3584 (2016).
6. Knies, K. et al. Biallelic mutations in the ubiquitin ligase RFWD3 cause Fanconi anemia. J. Clin. Invest. 127, 3013–3027 (2017).
7. Wang, W. Emergence of a DNA-damage response network consisting of Fanconi anaemia and BRCA proteins. Nat. Rev. Genet. 8,
735–748 (2007).
8. Duan, W. et al. Assessment of FANCD2 nuclear foci formation in paraffin-embedded tumors: a potential patient-enrichment
strategy for treatment with DNA interstrand crosslinking agents. Transl. Res. 161, 156–164 (2013).
9. Duan, W. et al. Fanconi anemia repair pathway dysfunction, a potential therapeutic target in lung cancer. Front. Oncol. 4, 368
(2014).
10. Bhattacharjee, S. & Nandi, S. DNA damage response and cancer therapeutics through the lens of the Fanconi Anemia DNA repair
pathway. Cell Commun. Signal. 15, 41 (2017).
11. Bryant, H. E. et al. Specific killing of BRCA2-deficient tumours with inhibitors of poly(ADP-ribose) polymerase. Nature 434,
913–917 (2005).
12. Farmer, H. et al. Targeting the DNA repair defect in BRCA mutant cells as a therapeutic strategy. Nature 434, 917–921 (2005).
13. Villalona-Calero, M. A. et al. Veliparib alone or in combination with mitomycin C in patients with solid tumors with functional
deficiency in homologous recombination repair. J. Natl. Cancer Inst. 108, 437 (2016).
14. Ceccaldi, R., Sarangi, P. & D’Andrea, A. D. The Fanconi anaemia pathway: new players and new functions. Nat. Rev. Mol. Cell Biol.
17, 337–349 (2016).
15. Cheung, R. S. et al. Ubiquitination-linked phosphorylation of the FANCI S/TQ cluster contributes to activation of the Fanconi
anemia I/D2 complex. Cell Rep. 19, 2432–2440 (2017).
16. Smogorzewska, A. Identification of the FANCI protein, a monoubiquitinated FANCD2 paralog required for DNA repair. Cell 129,
289–301 (2007).
17. Machida, Y. J. et al. UBE2T is the E2 in the Fanconi anemia pathway and undergoes negative autoregulation. Mol. Cell. 23, 589–596
(2006).
18. Meetei, A. R., Yan, Z. & Wang, W. FANCL replaces BRCA1 as the likely ubiquitin ligase responsible for FANCD2 monoubiquitina-
tion. Cell Cycle 3, 179–181 (2004).
19. Meetei, A. R. et al. A novel ubiquitin ligase is deficient in Fanconi anemia. Nat. Genet. 35, 165–170 (2003).
20. Mamrak, N. E., Shimamura, A. & Howlett, N. G. Recent discoveries in the molecular pathogenesis of the inherited bone marrow
failure syndrome Fanconi anemia. Blood Rev. 31, 93–99 (2017).
21. Feeney, L. et al. RPA-mediated recruitment of the E3 Ligase RFWD3 is vital for interstrand crosslink repair and human health.
Mol. Cell. 66, 610–621 (2017).
22. Inano, S. et al. RFWD3-mediated ubiquitination promotes timely removal of both RPA and RAD51 from DNA damage sites to
facilitate homologous recombination. Mol. Cell. 66, 622–634 (2017).
23. Nijman, S. M. et al. The deubiquitinating enzyme USP1 regulates the Fanconi anemia pathway. Mol Cell. 17, 331–339 (2005).
24. Tulay, P. & Sengupta, S. B. MicroRNA expression and its association with DNA repair in preimplantation embryos. J. Reprod. Dev.
62, 225–234 (2016).
25. Kong, Y. W. et al. The mechanism of micro-RNA-mediated translation repression is determined by the promoter of the target gene.
Proc. Natl. Acad. Sci. USA 105, 8866–8871 (2008).
Scientific Reports | (2021) 11:4420 | https://doi.org/10.1038/s41598-021-83884-9 9
Vol.:(0123456789)www.nature.com/scientificreports/
26. Collins, A. L. et al. A differential microRNA profile distinguishes cholangiocarcinoma from pancreatic adenocarcinoma. Ann.
Surg. Oncol. 21, 133–138 (2014).
27. Kim, M. K. Expression of microRNA miR-126 and miR-200c is associated with prognosis in patients with non-small cell lung
cancer. Virchows Arch. 465, 463–471 (2014).
28. Jansson, M. D. & Lund, A. H. MicroRNA and cancer. Mol. Oncol. 6, 590–610 (2012).
29. Detassis, S., Grasso, M., Del Vescovo, V. & Denti, M. A. microRNAs make the call in cancer personalized medicine. Front Cell Dev
Biol. 5, 86 (2017).
30. Calin, G. A. & Croce, C. M. MicroRNA signatures in human cancers. Nat. Rev. Cancer 6, 857–866 (2016).
31. He, L. & Hannon, G. MicroRNAs: small RNAs with a big role in gene regulation. Nat. Rev. Genet. 5, 522–531 (2004).
32. Pacurari, M. et al. The microRNA-200 family targets multiple non-small cell lung cancer prognostic markers in H1299 cells and
BEAS-2B cells. Int. J. Oncol. 43, 548–560 (2013).
33. Suresh, B. et al. Regulation of Fanconi anemia protein FANCD2 monoubiquitination by miR-302. Biochem. Biophys. Res. Commun.
466, 180–185 (2015).
34. Drusco, A. & Croce, C. M. MicroRNAs and cancer: a long story for short RNAs. Adv Cancer Res. 135, 1–24 (2017).
35. Shan, W., Zhang, X., Li, M., Deng, F. & Zhang, J. Over expression of miR-200c suppresses invasion and restores methotrexate
sensitivity in lung cancer A549 cells. Gene S0378–1119(16), 30564–30569 (2016).
36. Ayers, D. & Vandesompele, J. Influence of microRNAs and Long Non-Coding RNAs in Cancer Chemoresistance. Genes (Basel).
8, E95 (2017).
37. Donahue, S. L. & Campbell, C. A DNA double strand break repair defect in Fanconi anemia fibroblasts. J. Biol. Chem. 277,
46243–46247 (2002).
38. Kulkarni, M. M. Digital multiplexed gene expression analysis using the NanoString nCounter system. Curr Protoc Mol Biol.
Chapter 25:Unit25B (2011).
39. Duan, W. et al. MicroRNA-34a is an important component of PRIMA-1-induced apoptotic network in human lung cancer cells.
Int. J. Cancer. 127, 313–320 (2010).
40. Koo, T. et al. MicroRNA-200c increases radiosensitivity of human cancer cells with activated EGFR-associated signaling. Oncotarget.
8, 65457–65468 (2017).
41. Park, S.-M., Gaur, A. B., Lengyel, E. & Peter, M. E. The miR-200 family determines the epithelial phenotype of cancer cells by
targeting the E-cadherin repressors ZEB1 and ZEB2. Genes Dev. 22, 894–907 (2008).
42. Adam, L. et al. miR-200 expression regulates epithelialto-mesenchymal transition in bladder cancer cells and reverses resistance
to epidermal growth factor receptor therapy. Clin. Cancer Res. 15, 5060–5072 (2009).
43. Li, J. et al. miRNA-200c inhibits invasion and metastasis of human non-small cell lung cancer by directly targeting ubiquitin specific
peptidase 25. Mol. Cancer. 13, 166 (2014).
44. Tejero, R. et al. miR-141 and miR-200c as markers of overall survival in early stage non-small cell lung cancer adenocarcinoma.
PLoS ONE 9, e101899 (2014).
45. Jiao, A. et al. MicroRNA-200c inhibits the metastasis of non-small cell lung cancer cells by targeting ZEB2, an epithelial-mesen-
chymal transition regulator. Mol. Med. Rep. 13, 3349–3355 (2016).
46. Liu, P. L. et al. MicroRNA-200c inhibits epithelial-mesenchymal transition, invasion, and migration of lung cancer by targeting
HMGB1. PLoS ONE 12, e0180844 (2017).
47. Kopp, F., Wagner, E. & Roidl, A. The proto-oncogene KRAS is targeted by miR-200c. Oncotarget. 5, 185–195 (2014).
48. Mutlu, M. et al. miR-200c: a versatile watchdog in cancer progression, EMT, and drug resistance. J. Mol. Med. 94, 629–644 (2016).
49. Zhou, X. et al. The downregulation of miR-200c/141 promotes ZEB1/2 expression and gastric cancer progression. Med. Oncol. 32,
428 (2015).
50. Nourmohammadi, B. et al. Expression of miR-9 and miR-200c, ZEB1, ZEB2 and E-cadherin in non-small cell lung cancers in Iran.
Asian Pac. J. Cancer Prev. 20(6), 1633–1639 (2019).
51. Kurata, A. et al. Expression level of microRNA-200c is associated with cell morphology in vitro and histological differentiation
through regulation of ZEB1/2 and E-cadherin in gastric carcinoma. Oncol. Rep. 39, 91–100 (2018).
52. Schwarzenbach, H., Nishida, N., Calin, G. A. & Pantel, K. Clinical relevance of circulating cell-free microRNAs in cancer. Nat.
Rev. Clin. Oncol. 11, 145–156 (2014).
Acknowledgements
We would like to thank the OSU CCC Nucleic acids shared resource for Real time PCR and NanoString
miRNA Expression analysis, and the OSU CCC Tissue procurement for providing tumor samples. This work
was supported by NCI R21CA181291, R01CA152101 and American Cancer Society Institutional Seed Grant
(IRG-67-003-44).
Author contributions
W.D., conceived, designed, performed experiments and wrote manuscript. S.T performed experiments and wrote
manuscript, L.G., K.D., A.F., A.K., B.A., performed experiments, Q.W. designed experiments, edited manuscript
and M.A.V. designed experiments and edited manuscript.
Competing interests
The authors declare no competing interests.
Additional information
Supplementary Information The online version contains supplementary material available at https://doi.
org/10.1038/s41598-021-83884-9.
Correspondence and requests for materials should be addressed to W.D. or M.A.V.-C.
Reprints and permissions information is available at www.nature.com/reprints.
Publisher’s note Springer Nature remains neutral with regard to jurisdictional claims in published maps and
institutional affiliations.
Scientific Reports | (2021) 11:4420 | https://doi.org/10.1038/s41598-021-83884-9 10
Vol:.(1234567890)www.nature.com/scientificreports/
Open Access This article is licensed under a Creative Commons Attribution 4.0 International
License, which permits use, sharing, adaptation, distribution and reproduction in any medium or
format, as long as you give appropriate credit to the original author(s) and the source, provide a link to the
Creative Commons licence, and indicate if changes were made. The images or other third party material in this
article are included in the article’s Creative Commons licence, unless indicated otherwise in a credit line to the
material. If material is not included in the article’s Creative Commons licence and your intended use is not
permitted by statutory regulation or exceeds the permitted use, you will need to obtain permission directly from
the copyright holder. To view a copy of this licence, visit http://creativecommons.org/licenses/by/4.0/.
© The Author(s) 2021
Scientific Reports | (2021) 11:4420 | https://doi.org/10.1038/s41598-021-83884-9 11
Vol.:(0123456789)You can also read