Genes Involved in Energy Metabolism Are Differentially Expressed During the Day-Night Cycle in Murine Retinal Pigment Epithelium - IOVS
←
→
Page content transcription
If your browser does not render page correctly, please read the page content below
Biochemistry and Molecular Biology

              Genes Involved in Energy Metabolism Are Differentially
              Expressed During the Day–Night Cycle in Murine Retinal
              Pigment Epithelium
              Elja M. M. Louer,1,2 Guoqiang Yi,3 Claudia Carmone,1 Joris Robben,1 Henk G. Stunnenberg,3
              Anneke I. den Hollander,2,4 and Peter M. T. Deen1
              1
                Department of Physiology, Radboud Institute for Molecular Life Sciences, Radboud University Medical Center, Nijmegen,
              The Netherlands
              2
                Department of Ophthalmology, Donders Institute of Brain, Cognition and Behaviour, Radboud University Medical Center,
              Nijmegen, The Netherlands
              3
                Department of Molecular Biology, Radboud Institute for Molecular Life Sciences, Radboud University Nijmegen, Nijmegen,
              The Netherlands
              4
                Department of Human Genetics, Donders Institute for Brain, Cognition and Behaviour, Radboud University Medical
              Center, Nijmegen, The Netherlands

              Correspondence: Anneke I. den             PURPOSE. The functional interaction between photoreceptors and retinal pigment epithe-
              Hollander, Department of                  lium (RPE) cells is essential for vision. Phagocytosis of photoreceptor outer segments
              Ophthalmology, Radboud University         (POSs) by the RPE follows a circadian pattern; however, it remains unknown whether
              Medical Center, P.O. Box 9101,            other RPE processes follow a daily rhythm. Therefore, our aim was to identify RPE
              6500 HB, Nijmegen, The Netherlands;       processes following a daily rhythm.
              anneke.denhollander@radboudumc.nl.
              Peter M.T. Deen, Radboud University       METHODS. Murine RPE was isolated at Zeitgeber time (ZT) 0, 2, 4, 9, 14, and 19 (n = 5 per
              Medical Center, P.O. Box 9101, 6500       time point), after which RNA was isolated and sequenced. Genes with a significant differ-
              HB, Nijmegen, The Netherlands;            ence in expression between time points (P < 0.05) were subjected to EnrichR pathway
              peterdeen11@gmail.com.                    analysis to identify daily rhythmic processes.
              Received: September 11, 2019              RESULTS. Pathway enrichment revealed 13 significantly enriched KEGG pathways (P <
              Accepted: February 15, 2020
                                                        0.01), including the metabolic pathway (P = 0.002821). Analysis of the metabolic pathway
              Published: May 27, 2020
                                                        differentially expressed genes revealed that genes involved in adenosine triphosphate
              Citation: Louer EMM, Yi G, Carmone        production, glycolysis, glycogenolysis, and glycerophospholipid were low at ZT0 (light
              C, et al. Genes involved in energy        onset) and high at ZT19 (night). Genes involved in fatty acid degradation and cholesterol
              metabolism are differentially             synthesis were high at light onset and low at night.
              expressed during the day–night
              cycle in murine retinal pigment           CONCLUSIONS. Our transcriptome data suggest that the highest energy demand of RPE
              epithelium. Invest Ophthalmol Vis         cells is at night, whereas POS phagocytosis and degradation take place in the morning.
              Sci. 2020;61(5):49.                       Furthermore, we identified genes involved in fatty acid and glycerophospholipid synthe-
              https://doi.org/10.1167/iovs.61.5.49      sis that are upregulated at night, possibly playing a role in generating building blocks
                                                        for membrane synthesis.
                                                        Keywords: retinal pigment epithelium, metabolism, RNA-sequencing, circadian rhythm,
                                                        day–night cycle

              V    ision is a complex process in which different cell layers
                   of the retina functionally interact. The retina consists
              of supporting cells, neuronal (bipolar and ganglion) cells,
                                                                                     that RPE cells degrade phagocytosed lipids to fatty acids
                                                                                     (FAs) and subsequently subject them to β-oxidation to be
                                                                                     used in the tricarboxylic acid (TCA) cycle to provide these
              photoreceptor (PR) cells, and retinal pigment epithelium               cells with adenosine triphosphate (ATP).10,11
              (RPE) cells. The RPE, which is a monolayer of hexagonal,                  The activity of many processes in PR cells and POS
              highly pigmented cells adjacent to the photoreceptor outer             binding and subsequent phagocytosis by the RPE follow
              segment (POS) side of PR cells, plays an important role in             a circadian rhythm, with a peak in phagocytic activity in
              the maintenance of the PR cells. This cell layer is responsible        the morning, around 2 hours after light onset, or Zeitge-
              for the removal of PR cell waste products,1,2 for phagocytosis         ber time 2 (ZT2).12–15 It is likely that several other RPE
              and degradation of shed POS membranes,3 and for regener-               processes follow a circadian rhythm, but these are yet
              ation of 11-cis-retinal from 11-trans-retinal and subsequent           unknown. In addition to the physiological value, knowl-
              recycling to PR cells.4,5 Phagocytosis of POSs provides RPE            edge of such pathways may also be of clinical relevance,
              cells with a high load of (lipo)proteins, (oxidized) lipids, and       because a dysfunctional RPE underlies age-related macular
              11-trans-retinal.6–9 In vitro cell culture studies have shown          degeneration (AMD). Of particular interest here is the

              Copyright 2020 The Authors
              iovs.arvojournals.org | ISSN: 1552-5783                                                                                          1

                   This work is licensed under a Creative Commons Attribution-NonCommercial-NoDerivatives 4.0 International License.

Downloaded from iovs.arvojournals.org on 12/22/2020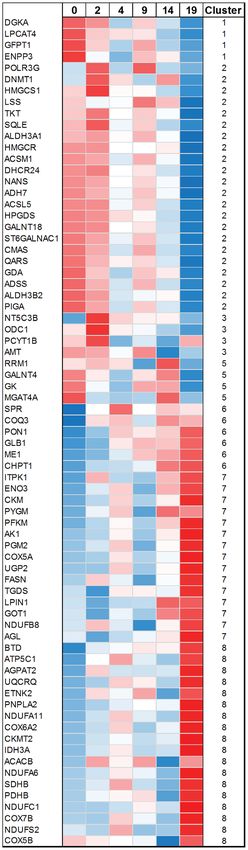
Day–Night Rhythm in Metabolism Genes in Murine RPE                            IOVS | May 2020 | Vol. 61 | No. 5 | Article 49 | 2

              metabolic pathway, because oxidative stress and the gener-      ENSEMBL database. The RNA-seq reads were aligned to
              ation of reactive oxygen species have been recognized           the mm10 genome using the two-pass mode of STAR, and
              as important factors contributing to aging and age-             the gene-based read counts were quantified at the same
              related disorders, including AMD.16,17 Therefore, the aim       time.
              of our study was to identify RPE processes that show               To evaluate the purity of cellular population and to
              a daily rhythm, with a particular focus on the metabolic        expose cell-type signature genes in our bulk samples, the
              pathway.                                                        CIBERSORT (Cell type Identification by Estimating Relative
                                                                              Subsets of Known RNA Transcripts) method19 was applied
                                                                              based on gene expression data. In order to generate a
              METHODS                                                         matrix of reference gene expression signatures, we down-
              Eye Isolation and Dissection                                    loaded expression values derived from 44k Agilent microar-
                                                                              rays (Santa Clara, CA, USA), under GSE66916 accession,20
              C57BL/6NCrl wild-type mice were housed under standard-          comprised of RPE, PR, and choriocapillaris cells isolated by
              ized conditions (12-hour dark/12-hour light cycle) and fed      laser dissection microscopy and excision from mouse eyes
              ad libitum. Animal experiments were approved by the             at high purity. Then, the fragments per kilobase per million
              animal ethics board of Radboud University, Nijmegen (RU         mapped reads (FPKM) value for each gene was used as input
              DEC 2016-0054) and by the Dutch Central Commission              for CIBERSORT with default parameters, except for the use
              for Animal Experiments (AVD103002016620). All animal            of 1000 permutation tests.
              handling and procedures were performed according to the
              ARVO Statement for the Use of Animals in Ophthalmic and
              Vision Research.                                                Analysis of RNA-Sequencing Data for
                 For RNA-sequencing (RNA-seq) analysis, 10- to 13-week-       Differentially Expressed Genes
              old male mice were randomly distributed over six time
                                                                              The DESeq2 package21 was used to detect differentially
              points (ZT0, ZT2, ZT4, ZT9, ZT14, and ZT19). At each
                                                                              expressed genes by performing pairwise comparisons
              time point, mice were sacrificed using cervical dislocation,
                                                                              among the six described time points. Only genes with
              and the eyes were collected via enucleation (n = 5 mice
                                                                              a Benjamini–Hochberg-adjusted P value < 0.05 and fold
              per time point). Anterior segments (cornea, iris, and lens)
                                                                              change > 1.5 were considered significantly differentially
              were removed to expose the posterior eyecup. The retina
                                                                              expressed. Cufflinks22 was employed to estimate gene-
              was carefully peeled off, and the eyecup containing the
                                                                              level abundance in FPKM values for ENSEMBL genes. To
              RPE, sclera, and choroid were stored in RNAlater solution
                                                                              group those differential genes with similar time-series-
              (Thermo Fisher Scientific, Waltham, MA, USA) within 10
                                                                              based expression patterns, the k-means clustering algorithm
              minutes after enucleation. The tissue was stored for 2 weeks
                                                                              was conducted based on z-score normalization and then
              at –20°C prior to RNA isolation.
                                                                              displayed as a heat map.

              RPE RNA Isolation
                                                                              Pathway Analysis of Differentially Expressed
              For RNA isolation, the RPE was removed gently from the          Genes
              choroidal layer using fine forceps. The brown clumps of RPE
              cells were dissolved in RLT Buffer from the RNeasy Micro        KEGG-2016 pathway analysis was performed using
              Kit (Qiagen, Hilden, Germany). RNA was extracted with the       the     EnrichR    software23,24  (http://amp.pharm.mssm.
              RNeasy Micro Kit according to the manufacturer’s protocol       edu/Enrichr/) and online DAVID (Database for Anno-
              using the on-column DNase treatment. The RNA concentra-         tation, Visualization and Integrated Discovery) v6.8
              tion and quality were measured using a NanoDrop 2000c           (https://david.ncifcrf.gov/). The EnrichR pathway clus-
              spectrophotometer (Thermo Fisher Scientific).                   tering option was used to identify the overlap between the
                                                                              significantly enriched pathways. WikiPathways were used
                                                                              to generate pathways shown in Figures 4 and 6A using
              RNA-Sequencing                                                  PathVisio software.25–28
              RNA samples of one eye per mouse, five mice per time
              point, were sent to ServiceXS (GenomeScan, Leiden, The          Data Availability
              Netherlands) for sequencing. The RNA concentrations and
              RNA quality number scores (Supplementary Table S1) were         The RNA-seq data used in this paper have been deposited in
              assessed using the Advanced Analytical Fragment Analyzer        the Gene Expression Omnibus database29 with the accession
              (Agilent Technologies, Santa Clara, CA, USA) prior to library   number GSE137005.
              construction. Library preparation was performed using the
              NEBNext Ultra Directional RNA Library Prep Kit for Illu-        RNA-Sequencing Validation Using Quantitative
              mina (New England Biolabs, Ipswich, MA, USA). We used
                                                                              Real-Time Polymerase Chain Reaction
              1.6 pM of cDNA for input samples in the Illumina NextSeq
              500 sequencer (San Diego, CA, USA) for 1 × 75-bp single-        The RNA-seq dataset was validated using quantitative
              read sequencing, sequencing an average of 20 million reads      real-time PCR (qRT-PCR) (Supplementary Fig. S1). Thirteen
              per sample.                                                     genes with a fold change above 1.5 were selected for valida-
                                                                              tion and represented seven of the eight expression clusters.
              Quality Control of RNA-Sequencing Data                          Reverse transcription was performed using Moloney murine
                                                                              leukemia virus reverse transcriptase (Invitrogen, Carlsbad,
              The mm10 reference assembly was first indexed by                CA, USA) according to the manufacturer’s protocol. qRT-
              STAR mapper18 with a gene annotation model from the             PCR was performed with the iTAQ Universal SYBR Green

Downloaded from iovs.arvojournals.org on 12/22/2020
Day–Night Rhythm in Metabolism Genes in Murine RPE                                IOVS | May 2020 | Vol. 61 | No. 5 | Article 49 | 3

              Supermix (Bio-Rad, Hercules, CA, USA) using the CFX                and choroidal endothelial cells (Supplementary Fig. S2). This
              Connect Real-Time System (Bio-Rad). Gusb expression was            allowed us to use our RNA-seq data to study the physiology
              used as housekeeping gene. Real-time PCR primers are               of RPE cells.
              listed in Supplementary Table S2.
                                                                                 Identification of Genes Expressed Differentially
              Immunoblot Analysis                                                Over Time
              Male C57BL/6NCrl wild-type mice 11 weeks old were arbi-            Pairwise comparison of the six ZT points resulted in a total
              trarily distributed over four ZT points (ZT0, ZT4, ZT9,            of 756 unique differentially expressed genes (DEGs) with
              and ZT19) at which the eyes were isolated. Three animals           a Benjamini–Hochberg-adjusted P < 0.05 (Fig. 1B). Limited
              were sacrificed per time point. Mice were sacrificed using         or no differences were observed among ZT0, ZT2, and ZT4,
              CO2 , and the eyes were collected via enucleation. Anterior        indicating that the mRNA expression patterns of these ZT
              segments were removed, after which each retina was care-           points were highly similar to each other. The highest number
              fully peeled off. The RPE was subsequently mechanically            of transcriptome differences was observed between ZT0 and
              detached and dissolved in lysis buffer, comprised of 10-mM         ZT19, which yielded 618 DEGs. Overall, the highest number
              Tris, 150-mM NaCl, 0.5% Triton X-100 (Sigma-Aldrich, St.           of DEGs was observed comparing ZT19 to all other ZT
              Louis, MO, USA), and 0.1% sodium dodecyl sulfate (SDS),            points, except for ZT4. This comparison resulted in only nine
              and cOmplete EDTA-Free Protease Inhibitors (Roche Group,           DEGs. Thirteen DEGs were selected to validate our RNA-seq
              Basel, Switzerland).                                               dataset using qRT-PCR (Supplementary Fig. S1). A detailed
                  The protein concentrations of lysates were determined          list of DEGs identified in each pairwise comparison of ZT
              using a bicinchoninic acid protein assay reagent (Pierce           points is provided in Supplementary Table S3. To study the
              Biotechnology, Rockford, IL, USA) and quantified with a            expression pattern of the identified DEGs over time, DEGs
              plate reader (Tecan Group AG, Männedorf, Switzerland).             with similar expression patterns were clustered using a k-
              Protein lysates were mixed with Laemmli buffer, denatured          means algorithm. In total, eight different clusters were iden-
              at 95°C for 5 minutes, separated on precast SDS polyacry-          tified, each showing a unique expression pattern over time
              lamide gels (4%–20% gradient; Bio-Rad), and blotted onto a         (Fig. 1C).
              polyvinylidene difluoride membrane (PerkinElmer, Boston,
              MA, USA). The oxidative phosphorylation system (OXPHOS)
              proteins of interest were detected using the Abcam                 Pathway Analysis of Identified DEGs
              OXPHOS antibody cocktail for immunoblot (ab110413, dilu-
              tion 1:250; Cambridge, United Kingdom) and peroxidase-             Subsequent analysis of the 756 DEGs using the EnrichR path-
              conjugated anti-mouse secondary antibody (1:10,000; Jack-          way software revealed 13 significantly enriched KEGG path-
              son ImmunoResearch Laboratories, West Grove, PA, USA).             ways (adjusted P < 0.01) (Table). Similar pathways were
              Proteins were visualized using enhanced chemilumines-              identified using the DAVID pathway analysis tool (Supple-
              cence (Pierce Biotechnology). Following Coomassie Brilliant        mentary Table S4). More detailed cluster analysis of the top
              blue staining of the blot, the signals of the proteins of inter-   10 KEGG pathways using the cluster option from EnrichR
              est and the Coomassie signals were subjected to densitro-          resulted in three main groups of pathways having multi-
              metric analyses using Bio-Rad quantification equipment             ple genes in common: (1) circadian rhythm, (2) Alzheimer’s
              (Bio-Rad 690c Densitometer; Chemidoc XRS) and Image                disease and metabolic pathways, and (3) a diverse set of
              Studio software (LI-COR Biosciences, Lincoln, NE, USA).            remaining processes (Table). The circadian rhythm group
              Coomassie blue was used to normalize for protein load-             contained nine genes, the Alzheimer’s disease and metabolic
              ing differences. Statistical analyses were performed using         pathways group contained 81 genes, and the third group
              GraphPad Prism 5 software. One-way ANOVA with repeated             contained 55 genes (Fig. 1D). Among these groups, only
              measures, followed by Bonferroni post hoc tests, were used.        one gene overlapped between groups 1 and 3 (Prkab2) and
              P < 0.05 was considered significant.                               one gene overlapped between groups 2 and 3 (Cacna1s).
                                                                                 Identification of the circadian rhythm pathway (Fig. 2)
                                                                                 confirms proper isolation of the material at the different time
              RESULTS                                                            points. The expression pattern and timing of these genes at
                                                                                 different ZTs are similar to those previously described for
              Generation of a Diurnal Transcriptome of Murine                    several organs such as the hypothalamus, liver, kidney, and
              RPE                                                                heart.30
              To identify daily rhythms in gene expression in RPE cells,
              mouse eyes were dissected at six ZT points (ZT0, ZT2, ZT4,         Day–Night Rhythm of Metabolic Pathway Genes
              ZT9, ZT14, and ZT19) (Fig. 1A). Because the peak time
              point in the phagocytosis of POSs by RPE cells was known           Next, a more detailed analysis was performed for the 73
              to occur around ZT212 (Fig. 1A, indicated with an arrow),          DEGs overlapping with the metabolic pathway (Table).
              we selected three time points (ZT0, ZT2, and ZT4) around           Figure 3 shows the z-score transformed expression data for
              this peak and distributed the other three time points evenly       each gene. We examined in detail the metabolic pathways
              over the remaining 20 hours. To determine the purity of our        to which each gene belonged and determined whether the
              RPE preparations, we compared our RNA-seq data to the              genes in these pathways had similar expression patterns.
              data of RPE, PR, and choriocapillaris cells isolated by laser         Nine genes encoding for building blocks of the mito-
              dissection microscopy and excision in a previous study.20          chondrial electron transport chain (ETC) were found to
              Based on the RNA-seq data, all of our samples appeared             be highly expressed at ZT19 (Ndufa6, Ndufc1, Ndufs2,
              highly enriched for RPE, as 70% of the reads were of RPE           Sdhb, Uqcrq, Cox5a, Cox5b, Cox7b, and Atp5c1) (Fig. 4A).
              origin with only limited contamination of neighboring PR           In addition, seven other genes (mt-Nd1, mt-Nd2, mt-Nd4,

Downloaded from iovs.arvojournals.org on 12/22/2020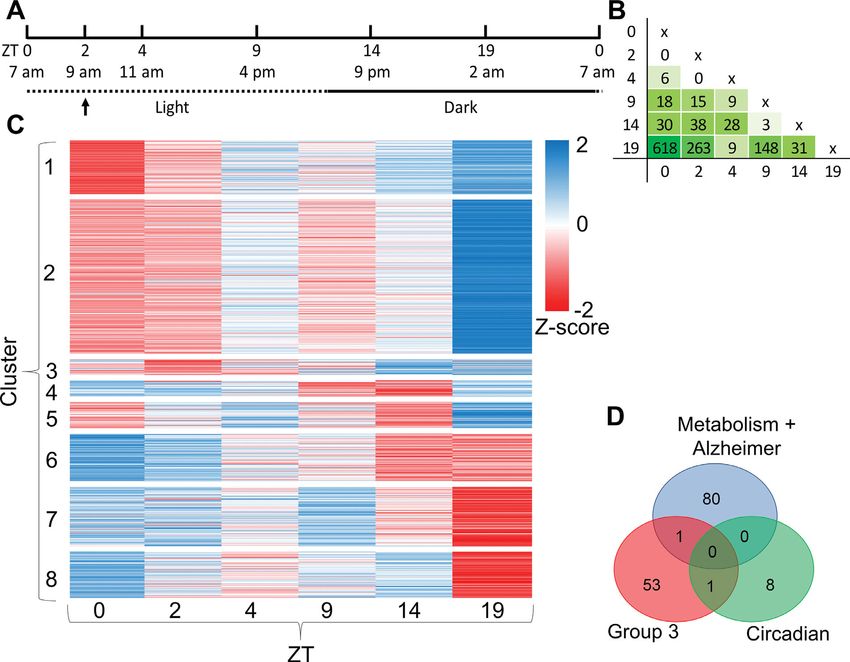
Day–Night Rhythm in Metabolism Genes in Murine RPE                                     IOVS | May 2020 | Vol. 61 | No. 5 | Article 49 | 4

              FIGURE 1. Circadian expression of RPE genes. (A) The experimental setup showing the time points chosen for tissue harvesting indicated
              in both real and Zeitgeber time (ZT). The arrow indicates peak phagocytic activity. (B) Number of DEGs identified among the different time
              points, which are indicated in ZT. (C) Heat map of DEGs. To group the DEGs with similar time-based expression patterns, k-means clustering
              was conducted based on z-score normalization. The intensity scale of the standardized expression values ranges from low expression (dark
              blue) to high expression (dark red). (D) Venn diagrams showing the number of DEGs overlapping among groups, as identified by EnrichR
              string analysis.

              TABLE. Significant KEGG Pathway Enrichment Using EnrichR Pathway Analysis
              Term                                                              DEGs, n      Adjusted P Value (P < 0.01)        String Analysis Group

              Tight junction (hsa04530)                                            22                     3E-06                         Group   3
              Circadian rhythm (hsa04710)                                           9                   0.000125                        Group   1
              Alzheimer’s disease (hsa05010)                                       21                   0.000125                        Group   2
              Arrhythmogenic right ventricular cardiomyopathy (hsa05412)           13                   0.00022                         Group   3
              Leukocyte transendothelial migration (hsa04670)                      15                   0.00189                         Group   3
              Regulation of actin cytoskeleton (hsa04810)                          21                   0.002273                        Group   3
              Hypertrophic cardiomyopathy (hsa05410)                               12                   0.002273                        Group   3
              Metabolic pathways (hsa01100)                                        73                   0.002821                        Group   2
              Adherens junction (hsa04520)                                         11                   0.002821                        Group   3
              Dilated cardiomyopathy (hsa05414)                                    12                   0.003489                        Group   3
              Cardiac muscle contraction (hsa04260)                                11                   0.003592                          —
              Parkinson’s disease (hsa05012)                                       15                   0.006463                          —
              Calcium signaling pathway (hsa04020)                                 17                   0.009249                          —
                 The number of DEGs found in our dataset that overlap with the reference pathways and P values are indicated. The P values indicate
              the significance of enrichment and were Benjamini corrected. Groups identified using EnrichR string analysis are indicated.

Downloaded from iovs.arvojournals.org on 12/22/2020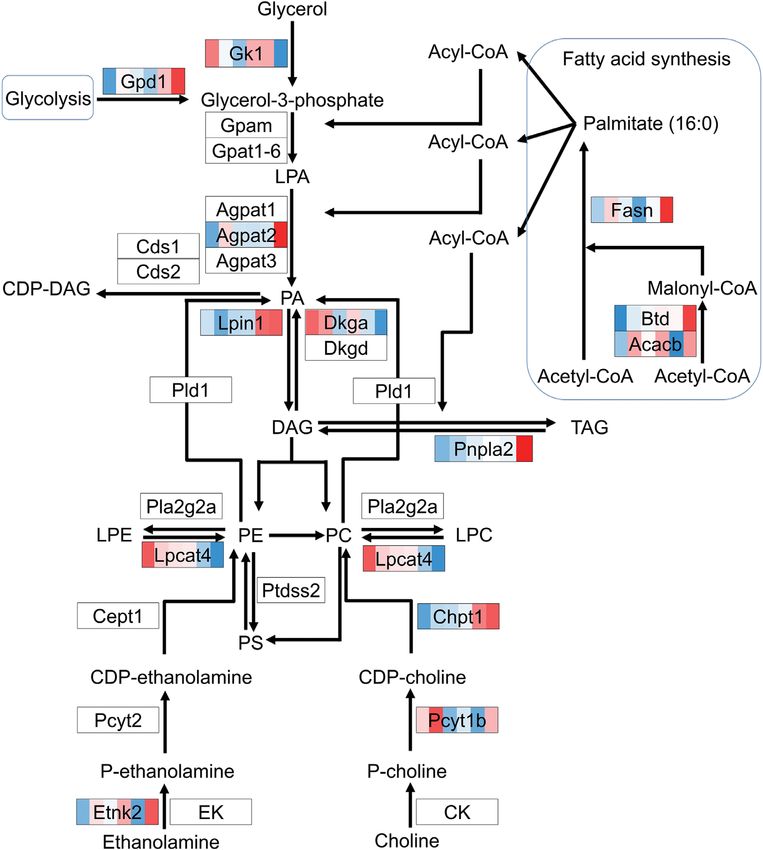
Day–Night Rhythm in Metabolism Genes in Murine RPE IOVS | May 2020 | Vol. 61 | No. 5 | Article 49 | 5
FIGURE 2. DEGs in RPE cells of the circadian rhythm pathway.
Genes that are differentially expressed over time are indicated by
various colors, with an intensity scale of the standardized expression
values ranging from low expression (dark blue) to high expression
(dark red). ZT points are ranked from left to right for each differen-
tially expressed gene, the most left color corresponding to ZT0 and
the most right color corresponding to ZT19.
Cytb, mt-Co1, Cox7a1, and Slc25a4) encoding components
of the mitochondrial ETC were identified as DEGs in our
RNA-seq dataset and were also expressed highly at ZT19
(Fig. 4A). Furthermore, we identified two genes (Ckm and
Ak1) involved in facilitating transport of ATP among the
DEGs in the metabolic pathway and two additional ATP
transport genes (Ckmt1 and Ckmt2) in the entire list of
DEGs.
To verify whether protein levels corresponded to changes
in the RNA levels, we subjected proteins of isolated RPE
to immunoblot analysis for the OXPHOS proteins Ndufb8,
Sdhb, Uqcrc2, mt-Co1, and Atp5a, which are subunits of
mitochondrial ETC complexes I to V, respectively. Of these
OXPHOS proteins, Ndufb8, Sdhb, and mt-Co1 represent
DEGs. A trend for increased expression at ZT19 and ZT0 was
observed for all complexes, except for complex V subunit
Atp5a, which did not have increased expression at ZT19
(Fig. 5).
Among the DEGs in the metabolic pathway, three genes
of the TCA cycle (Idh3a, Sdhb, and Pdhb) were identified, all
showing a high expression at ZT19 (Fig. 4B). Idh3a encodes
the isocitrate dehydrogenase α-subunit of the mitochondrial
Idh3 complex, which catalyzes the rate-limiting step in the
TCA cycle.31
The production of ATP requires an energy source, typi-
cally in the form of carbohydrates or FAs.32 Three genes
involved in glucose metabolism (Pfkm, Eno3, and Got1)
were identified among the DEGs in the metabolic path-
way, and further analysis identified Slc2a4 as an additional
DEG in our RNA-seq dataset, all having high expression
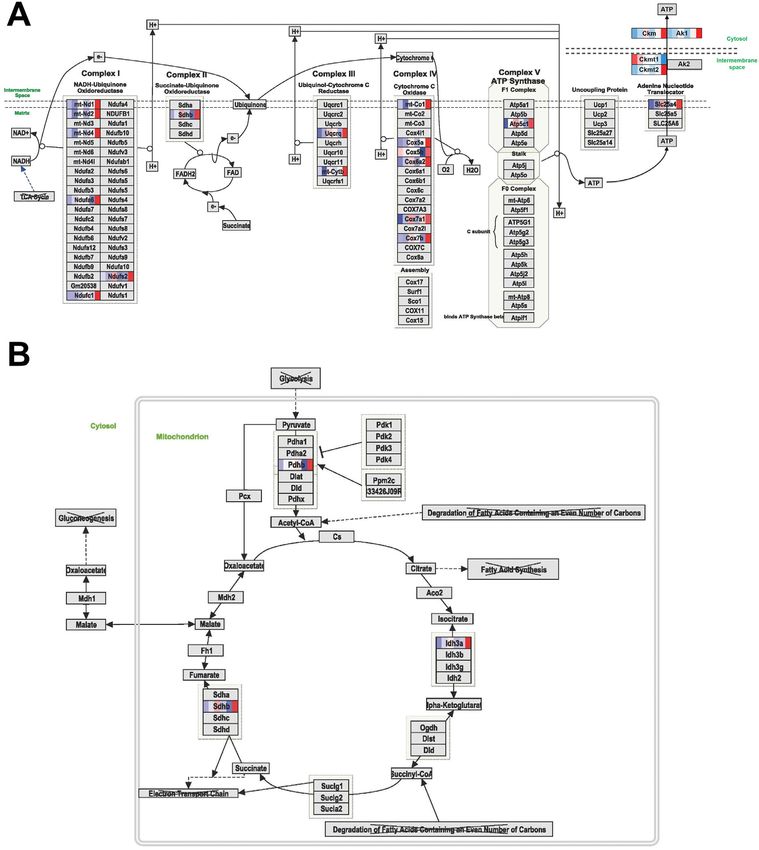
at ZT19 (Fig. 6A). Pfkm encodes 6-phosphofructrokinase, FIGURE 3. Heat map of differentially expressed genes overlapping
muscle type, which has unidirectional activity as it drives with the metabolic pathway. The normalized expression data were
converted to heat map colors using a z-score transformation for
glycolysis instead of gluconeogenesis. Furthermore, Pdhb
each gene. The intensity scale of the standardized expression values
codes for pyruvate dehydrogenase, which links glycolysis to ranges from low expression (dark blue) to high expression (dark
the TCA cycle as it catalyzes the irreversible conversion of red). Gene names, ZT points, and clusters are indicated.
Downloaded from iovs.arvojournals.org on 12/22/2020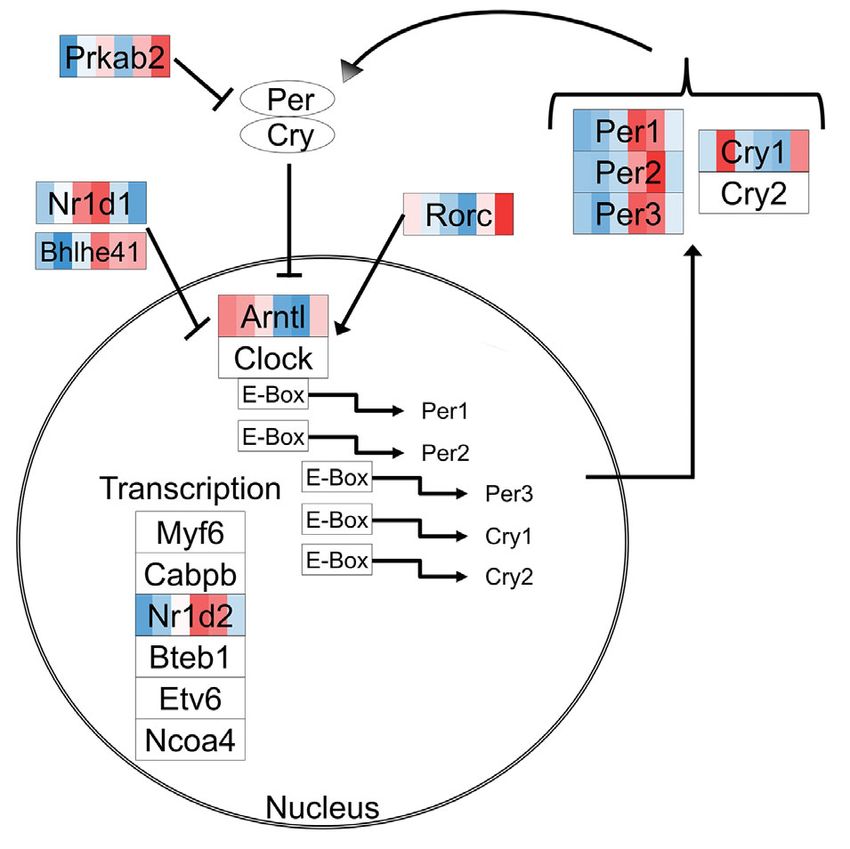
Day–Night Rhythm in Metabolism Genes in Murine RPE                                      IOVS | May 2020 | Vol. 61 | No. 5 | Article 49 | 6

              FIGURE 4. DEGs in RPE cells of ATP-producing pathways. Shown are the detailed WikiPathways of the protein (complexes) involved in the
              mitochondrial ETC (A) and glycolysis (B). Genes differentially expressed over time are indicated with colors, with an intensity scale of the
              standardized expression values ranging from low expression (dark blue) to high expression (dark red). ZT points are ranked from left to
              right for each DEG, the most left color corresponding to ZT0 and the most right color corresponding to ZT19. Links to other pathways are
              indicated by the name of the pathway with a cross.

              pyruvate to acetyl-CoA.33 Pdhb also showed high expression                 Glycerophospholipid metabolism genes were also repre-
              at ZT19 (Fig. 4B).                                                      sented in the list of DEGs overlapping with the metabolic
                 Additionally, four genes involved in glycogen metabolism             pathway (Gk1, Agpat2, Lpin1, Dgka, Pnpla2, Lpcat4, Chpt,
              were identified in the metabolic pathway (Agl, Pygm,                    Pcyt1b, Etnk2, Acacb, and Fasn), and additional analysis
              Pgm2, and Ugp2), and detailed analysis of DEGs in our                   revealed that Gpd1 and Btb were also identified as DEGs
              RNA-seq dataset identified three additional genes (Gys1,                (Fig. 7). The expression of these genes varies over time, but
              Phka1, and Phkg1) involved in glycogen metabolism. Again,               genes involved in FA synthesis (Acacb, Btd, and Fasn) were
              all DEGs showed a high expression at ZT19, suggest-                     found to be high at ZT19.
              ing conversion of glycogen to glucose at this time point                   Four genes involved in FA degradation were found among
              (Fig. 6B).                                                              the DEGs in the metabolic pathway (Aldh3b2, Acsl5, Acsm1,

Downloaded from iovs.arvojournals.org on 12/22/2020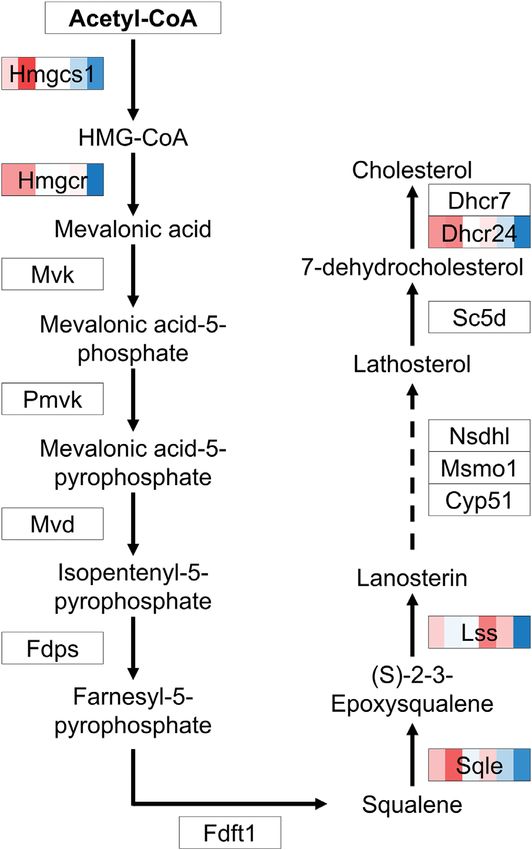
Day–Night Rhythm in Metabolism Genes in Murine RPE                                       IOVS | May 2020 | Vol. 61 | No. 5 | Article 49 | 7

              FIGURE 5. Protein abundance of mitochondrial ETC complexes during the day–night cycle. (A) The RPE of each of three mice per time point
              (ZT0, ZT4, ZT9, and ZT19) was isolated, dissolved, and subjected to immunoblotting for the indicated subunits of the five mitochondrial
              ETC complexes. Coomassie (CM) staining was used as the loading control and to normalize the signals of the proteins of interest. (B–F)
              Normalized protein quantification for each of the five complexes.

              FIGURE 6. DEGs in RPE cells of the sugar metabolizing pathway. Shown are detailed WikiPathways for glycolysis (A) and glycogen
              metabolism (B). Genes differentially expressed over time are indicated by various colors, with an intensity scale of the standardized expres-
              sion values ranging from low expression (dark blue) to high expression (dark red). ZT points are ranked from left to right for each DEG,
              the most left color corresponding to ZT0 and the most right color corresponding to ZT19.

Downloaded from iovs.arvojournals.org on 12/22/2020
Day–Night Rhythm in Metabolism Genes in Murine RPE IOVS | May 2020 | Vol. 61 | No. 5 | Article 49 | 8
FIGURE 7. DEGs in RPE cells of the glycerophospholipid metabolism pathway. Genes that are differentially expressed over time are indicated
by various colors, with an intensity scale of the standardized expression values ranging from low expression (dark blue) to high expression
(dark red). ZT points are ranked from left to right for each differentially expressed gene, the most left color corresponding to ZT0 and
the most right color corresponding to ZT19. DAG, diacylglycerol; LPC, lysophosphatidyl choline; LPE, lysophosphatidyl ethanolamine; PA,
phosphatidic acid; PC, phosphatidyl choline; PE, phosphatidyl ethanolamine; TAG, triacylglycerol.
and Aldh3a1), as well as five genes involved in cholesterol ing a greater need for energy production at this time point.
biosynthesis (Hmgcs1, Hmgcr, Sqle, Lss, and Dhcr24) (Fig. 8). Additionally, genes were identified in the glycerophospho-
Of these genes, Hmgcr encodes the rate-limiting enzyme for lipid metabolism pathway, suggesting the generation of glyc-
cholesterol synthesis. These genes were all highly expressed erophospholipids at ZT19. Finally, genes involved in FA
at ZT0 and ZT2. degradation and cholesterol synthesis were observed to be
high at light onset and low at night.
DISCUSSION In total, we identified 16 genes encoding for building
blocks of the mitochondrial ETC, which is involved in ATP
In this study, we identified 756 significant DEGs in murine production, that were differentially expressed over time
RPE when comparing six different ZT points. Pathway anal- but all showed a high expression at ZT19. Furthermore,
ysis of the DEGs resulted in 13 significantly enriched KEGG we identified the main players in the transport of ATP
pathways, including circadian rhythm and the metabolic throughout the cell to make it available for ATP-consuming
pathway. In-depth analysis of the DEGs in the metabolic proteins. Maintaining low mitochondrial ATP/adenosine
pathway revealed high expression in the middle of the diphosphate (ADP) levels stimulates oxidative phos-
night (ZT19) of genes involved in the mitochondrial ETC, phorylation and allows high ATP/ADP levels at sites of
TCA cycle, glycolysis, and glycogen metabolism, suggest- utilization.34 Taken together, these observations suggest an
Downloaded from iovs.arvojournals.org on 12/22/2020Day–Night Rhythm in Metabolism Genes in Murine RPE IOVS | May 2020 | Vol. 61 | No. 5 | Article 49 | 9
in glycolysis, as it has been reported that RPE cells transport
the majority of the glucose they take up from the blood-
stream toward the PR cells.36 However, the increased expres-
sion of genes involved in glycogenolysis at night suggests
that glucose molecules are generated from glycogen stored
in RPE cells at this time point. In previous studies, glycogen
was detected in rat and human RPE in vivo, was shown to
accumulate in diabetic RPE of rats and humans, and has been
shown to be utilized for energy storage in human RPE cells
cultured in vitro.37–39 Our data suggest that glycogen usage
shows a daily rhythm and that stored glycogen is metab-
olized and used as an energy source at night. It remains
unclear what process requires this elevation in ATP produc-
tion. Furthermore, future in vivo metabolic labeling studies
on RPE layers must be performed to reveal whether our tran-
scriptomic data are supported by functional metabolic data.
The changes in expression of genes involved in FA
synthesis and glycerophospholipid metabolism suggest that
the produced FAs are converted to phosphatidyl choline,
phosphatidyl ethanolamine, and their lysophosphatidic
counterparts at night. The increased expression of Gpd1 at
this time point further suggests that the required glycerol-
3-phosphate is derived from the glycolysis pathway, thereby
linking the glycolysis pathway to the glycerophospholipid
pathway. Glycerophospholipids are building blocks for the
generation of biological membranes, and an increase in the
synthesis of glycerophospholipids has been associated with
phagocytic cells.40 Because the RPE phagocytoses POSs at
the onset of light, the suggested upregulation of phospho-
lipid generation at night could play an important role in this
process. Alternatively, the membrane building blocks could
be transported to the PR cells for the formation of new POSs.
In addition to genes involved in FA synthesis, we also
identified genes involved in FA degradation. These genes
FIGURE 8. DEGs in RPE cells of the cholesterol synthesis pathway. had low expression at night (ZT19) but high in the morning
Genes differentially expressed over time are indicated by various (ZT0–ZT2), and they play a role in performing the first steps
colors, with an intensity scale of the standardized expression values in targeting FAs for mitochondrial β-oxidation. This suggests
ranging from low expression (dark blue) to high expression (dark reduced energy generation from FAs at night but increased
red). ZT points are ranked from left to right for each differentially energy generation from FAs in the morning. In the RPE,
expressed gene, the most left color corresponding to ZT0 and the
most right color corresponding to ZT19.
lipids are degraded and FAs are oxidized by β-oxidation,
as shown by in vitro studies.10,11 β-Oxidation is an impor-
tant part of FA degradation and takes place in mitochon-
dria, where FAs are processed and acyl-CoA is degraded into
elevation in the production of ATP in the middle of the acetyl-CoA,41 after which it can be utilized in the TCA cycle
night. to fuel the mitochondrial ETC. In vitro studies previously
Furthermore, we observed a trend in protein abundance demonstrated that RPE cells can use the lipids ingested after
of the OXPHOS complexes I to IV, which showed higher POS phagocytosis as an energy source,42,43 and it has been
levels at ZT0 and ZT19. The RNA expression levels of the suggested that they even provide intermediates of the lipid
corresponding DEGs did not reflect the protein abundance degradation products as building blocks or energy sources
at ZT0, which can be explained by the stability of proteins in for the PR cells.44,45 Because the ETC is fueled both at night
the RPE and therefore a delay in translation of RNA levels to (by TCA and glycolysis) and in the morning (by β-oxidation),
protein levels. Because complexes I to IV are responsible for this could explain why gene expression levels at ZT4 and
generating the proton gradient driving ATP production by ZT19 are relatively similar to each other.
complex V,35 we hypothesize that ATP production increases Finally, we identified an increased expression of genes
at night. involved in the cholesterol synthesis pathway at light onset.
In addition, we identified higher expression at night of Cholesterol synthesis most likely plays a role during POS
genes encoding components of the TCA cycle. This pathway phagocytosis in the morning. The PR cells shed their POSs,
not only generates ATP but is also linked to the ETC in the which are engulfed by the RPE. A fluidic membrane for the
cellular respiration pathway generating metabolites utilized engulfment of these POSs is necessary, and the composition
in the ETC.32 Our data suggest that the TCA cycle fuels the of cholesterol and unsaturated free FAs in the membrane
ETC specifically in the middle of the night. is important for membrane fluidity and stability.46 On the
Although TCA energy can in principle be obtained from other hand, our study demonstrated that genes involved in
carbohydrates, FAs, and amino acids, our data suggest FA degradation are upregulated in the morning. The forma-
increased glucose and glycogen usage at night. It was tion of acetyl-CoA from FA degradation can be utilized for
surprising to find an elevated expression of genes involved the initiation of cholesterol synthesis in the RPE cells. Thus,
Downloaded from iovs.arvojournals.org on 12/22/2020Day–Night Rhythm in Metabolism Genes in Murine RPE IOVS | May 2020 | Vol. 61 | No. 5 | Article 49 | 10
cholesterol synthesis and FA degradation are associated with 4. Palczewski K, Baehr W. The retinoid cycle and retinal
each other, and these pathways most likely work together to diseases. eLS. 2001;doi: 10.1038/npg.els.0004067.
facilitate the phagocytosis and breakdown of POSs by the 5. Strauss O. The retinal pigment epithelium in visual function.
RPE. Physiol Rev. 2005;85:845–881.
The function of the retina, particularly the RPE cells, 6. Gordon WC, Bazan NG. Visualization of [3H] docosahex-
declines with age.47 The phagocytosis of POSs contributes aenoic acid trafficking through photoreceptors and retinal
to an oxidative environment in the RPE cells,48 which is pigment epithelium by electron microscopic autoradiogra-
believed to contribute to the development of age-related eye phy. Invest Ophthalmol Vis Sci. 1993;34:2402–2411.
disorders such as diabetic retinopathy and AMD.49 Further- 7. Adler AJ, Southwick RE. Distribution of glucose and
lactate in the interphotoreceptor matrix. Ophthalmic Res.
more, a 30% decrease in intracellular ATP levels was found
1992;24:243–252.
in aged RPE cells in vitro, mainly due to diminished activ-
8. Young RW. The renewal of photoreceptor cell outer
ity of the ETC.50,51 This reduced metabolic capacity of aged segments. J Cell Biol. 1967;33:61–72.
RPE cells correlates with a high susceptibility to oxidative
9. Chen H, Anderson RE. Metabolism in frog retinal pigment
stress,52 and reduced mitochondrial function is a hallmark epithelium of docosahexaenoic and arachidonic acids
of AMD.38 Our data suggest that the aged RPE cells might derived from rod outer segment membranes. Exp Eye Res.
be exposed to high levels of oxidative stress at night due to 1993;57:369–377.
reduced ATP levels but are exposed to an oxidative environ- 10. Tyni T, Johnson M, Eaton S, et al. Mitochondrial fatty acid
ment during POS phagocytosis in the morning. Because RPE β-oxidation in the retinal pigment epithelium. Pediatr Res.
cells have many physiological functions, reduced metabolic 2002;52:595–600.
capacity and increased oxidative stress could lead to cellular 11. Tyni T, Paetau A, Strauss AW, Middleton B, Kivelä T. Mito-
dysfunction and, in turn, to retinal pathologies. chondrial fatty acid β-oxidation in the human eye and
In conclusion, our study demonstrates that genes brain: implications for the retinopathy of long-chain 3-
involved in or linked to the ETC (ATP generation) have high hydroxyacyl-CoA dehydrogenase deficiency. Pediatr Res.
expression at ZT19, whereas genes involved in lipid degra- 2004;56:744–750.
dation (β-oxidation) show high expression at ZT0 and ZT2 12. LaVail MM. Rod outer segment disc shedding in relation to
in RPE cells. These data suggest that the highest energy cyclic lighting. Exp Eye Res. 1976;23:277–280.
demand of RPE cells is at night, when they use glycogen and 13. LaVail M. Circadian nature of rod outer segment disc shed-
glucose but not FAs as an energy source. Additionally, our ding in the rat. Invest Ophthalmol Vis Sci. 1980;19:407–411.
data suggest that POS phagocytosis might be facilitated by 14. Ruggiero L, Connor MP, Chen J, Langen R, Finnemann SC.
Diurnal, localized exposure of phosphatidylserine by rod
cholesterol synthesis in the morning. Moreover, it has been
outer segment tips in wild-type but not Itgb5–/– or Mfge8–
suggested that the degradation of POSs is facilitated by FA /– mouse retina. Proc Natl Acad Sci U S A. 2012;109:8145–
degradation, which also takes place in the morning. Further- 8148.
more, we identified genes involved in lipid synthesis that 15. Nandrot EF, Anand M, Sircar M, Finnemann SC. Novel role
are upregulated at night, possibly playing a role in generat- for alphavbeta5-integrin in retinal adhesion and its diurnal
ing building blocks for membrane synthesis. Although recy- peak. Am J Physiol Cell Physiol. 2006;290:C1256–C1262.
cling of FAs from the RPE to PR cells has been identified 16. Handa JT. How does the macula protect itself from oxidative
previously,53 future research is needed to determine whether stress? Mol Aspects Med. 2012;33:418–435.
these building blocks are used by the RPE itself or trans- 17. Nowak JZ. Oxidative stress, polyunsaturated fatty acids-
ported to the PR cells to generate POSs. derived oxidation products and bisretinoids as potential
inducers of CNS diseases: focus on age-related macular
degeneration. Pharmacol Rep. 2013;65:288–304.
Acknowledgments 18. Dobin A, Davis CA, Schlesinger F, et al. STAR: ultrafast
The authors thank Niky Thijssen for her expert technical assis- universal RNA-seq aligner. Bioinformatics. 2013;29:15–21.
tance and Andries Kalsbeek of the Netherlands Institute for 19. Newman AM, Liu CL, Green MR, et al. Robust enumeration
Neuroscience for critically reviewing our manuscript. of cell subsets from tissue expression profiles. Nat Methods.
2015;12:453–457.
Supported by a junior researcher grant from the Radboud Insti- 20. Bennis A, Gorgels TG, Ten Brink JB, et al. Comparison of
tute for Molecular Life Sciences and Radboud University Medical mouse and human retinal pigment epithelium gene expres-
Center, The Netherlands. sion profiles: potential implications for age-related macular
degeneration. PLoS One. 2015;10:e0141597.
Disclosure: E.M.M. Louer, None; G. Yi, None; C. Carmone, 21. Love MI, Huber W, Anders S. Moderated estimation of
None; J. Robben, None; H.G. Stunnenberg, None; A.I. den fold change and dispersion for RNA-seq data with DESeq2.
Hollander, None; P.M.T. Deen, None Genome Biol. 2014;15:550.
22. Trapnell C, Williams BA, Pertea G, et al. Transcript assem-
bly and quantification by RNA-Seq reveals unannotated tran-
References scripts and isoform switching during cell differentiation. Nat
Biotechnol. 2010;28:511–515.
1. Kenyon E, Yu K, La Cour M, Miller SS. Lactate transport
23. Kuleshov MV, Jones MR, Rouillard AD, et al. Enrichr: a
mechanisms at apical and basolateral membranes of bovine
comprehensive gene set enrichment analysis web server
retinal pigment epithelium. Am J Physiol. 1994;267:C1561–
2016 update. Nucleic Acids Res. 2016;44:W90–W97.
C1573.
24. Chen EY, Tan CM, Kou Y, et al. Enrichr: interactive and
2. la Cour M, Lin H, Kenyon E, Miller SS. Lactate transport
collaborative HTML5 gene list enrichment analysis tool.
in freshly isolated human fetal retinal pigment epithelium.
BMC Bioinformatics. 2013;14:128.
Invest Ophthalmol Vis Sci. 1994;35:434–442.
25. Kelder T, van Iersel MP, Hanspers K, et al. WikiPath-
3. Young RW, Bok D. Participation of the retinal pigment
ways: building research communities on biological path-
epithelium in the rod outer segment renewal process. J Cell
ways. Nucleic Acids Res. 2012;40:D1301–D1307.
Biol. 1969;42:392–403.
Downloaded from iovs.arvojournals.org on 12/22/2020Day–Night Rhythm in Metabolism Genes in Murine RPE IOVS | May 2020 | Vol. 61 | No. 5 | Article 49 | 11
26. Kutmon M, Riutta A, Nunes N, et al. WikiPathways: capturing 41. Goepfert S, Poirier Y. Beta-oxidation in fatty acid degra-
the full diversity of pathway knowledge. Nucleic Acids Res. dation and beyond. Curr Opin Plant Biol. 2007;10:245–
2016;44:D488–D494. 251.
27. van Iersel MP, Kelder T, Pico AR, et al. Presenting and 42. Adijanto J, Du J, Moffat C, et al. The retinal pigment
exploring biological pathways with PathVisio. BMC Bioin- epithelium utilizes fatty acids for ketogenesis. J Biol Chem.
formatics. 2008;9:399. 2014;289:20570–20582.
28. Kutmon M, van Iersel MP, Bohler A, et al. PathVisio 3: an 43. Reyes-Reveles J, Dhingra A, Alexander D, et al.
extendable pathway analysis toolbox. PLoS Comput Biol. Phagocytosis-dependent ketogenesis in retinal pigment
2015;11:e1004085. epithelium. J Biol Chem. 2017;292:8038–8047.
29. Edgar R, Domrachev M, Lash AE. Gene Expression 44. Chao JR, Knight K, Engel AL, et al. Human retinal pigment
Omnibus: NCBI gene expression and hybridization array epithelial cells prefer proline as a nutrient and transport
data repository. Nucleic Acids Res. 2002;30:207–210. metabolic intermediates to the retinal side. J Biol Chem.
30. Zhang R, Lahens NF, Ballance HI, Hughes ME, Hogenesch 2017;292:12895–12905.
JB. A circadian gene expression atlas in mammals: impli- 45. Storti F, Raphael G, Griesser V, et al. Regulated efflux of
cations for biology and medicine. Proc Natl Acad Sci USA. photoreceptor outer segment-derived cholesterol by human
2014;111:16219–16224. RPE cells. Exp Eye Res. 2017;165:65–77.
31. Gabriel JL, Zervos PR, Plaut GWE. Activity of purified 46. Kusumi A, Tsuda M, Akino T, Ohnishi S, Terayama Y.
NAD-specific isocitrate dehydrogenase at modulator and Protein-phospholipid-cholesterol interaction in the photol-
substrate concentrations approximating conditions in mito- ysis of invertebrate rhodopsin. Biochemistry. 1983;22:1165–
chondria. Metabolism. 1986;35:661–667. 1170.
32. Bonora M, Patergnani S, Rimessi A, et al. ATP synthesis and 47. Dorey CK, Wu G, Ebenstein D, Garsd A, Weiter JJ. Cell loss
storage. Purinergic Signal. 2012;8:343–357. in the aging retina. Relationship to lipofuscin accumula-
33. Berg JM, Tymoczko JL, Stryer L. Biochemistry. 5th ed. New tion and macular degeneration. Invest Ophthalmol Vis Sci.
York, NY: W.H. Freeman; 2002. 1989;30:1691–1699.
34. Dzeja PP, Terzic A. Phosphotransfer networks and cellular 48. Miceli MV, Liles MR, Newsome DA. Evaluation of oxida-
energetics. J Exp Biol. 2003;206:2039–2047. tive processes in human pigment epithelial cells associ-
35. Sazanov LA. A giant molecular proton pump: structure and ated with retinal outer segment phagocytosis. Exp Cell Res.
mechanism of respiratory complex I. Nat Rev Mol Cell Biol. 1994;214:242–249.
2015;16:375–388. 49. Jarrett SG, Lewin AS, Boulton ME. The importance of
36. Swarup A, Samuels IS, Bell BA, et al. Modulating GLUT1 mitochondria in age-related and inherited eye disorders.
expression in the RPE decreases glucose levels in the retina: Ophthalmic Res. 2010;44:179–190.
impact on photoreceptors and Müller glial cells. Am J Phys- 50. Schutt F, Aretz S, Auffarth GU, Kopitz J. Moderately
iol Cell Physiol. 2018;316:C121–C133. reduced ATP levels promote oxidative stress and debilitate
37. Coffe V, Carbajal RC, Salceda R. Glucose metabolism in rat autophagic and phagocytic capacities in human RPE cells.
retinal pigment epithelium. Neurochem Res. 2006;31:103– Invest Ophthalmol Vis Sci. 2012;53:5354–5361.
108. 51. He Y, Tombran-Tink J. Mitochondrial decay and impairment
38. Golestaneh N, Chu Y, Xiao YY, Stoleru GL, Theos AC. of antioxidant defenses in aging RPE cells. Adv Exp Med Biol.
Dysfunctional autophagy in RPE, a contributing factor 2010;664:165–183.
in age-related macular degeneration. Cell Death Dis. 52. Rohrer B, Bandyopadhyay M, Beeson C. Reduced metabolic
2017;8:e2537. capacity in aged primary retinal pigment epithelium (RPE)
39. Hernandez C, Garcia-Ramirez M, Garcia-Rocha M, et al. is correlated with increased susceptibility to oxidative stress.
Glycogen storage in the human retinal pigment epithelium: Adv Exp Med Biol. 2016;854:793–798.
a comparative study of diabetic and non-diabetic donors. 53. Chen H, Wiegand RD, Koutz CA, Anderson RE. Docosa-
Acta Diabetol. 2014;51:543–552. hexaenoic acid increases in frog retinal pigment epithe-
40. Elsbach P, Levy S. Increased synthesis of phospholipid lium following rod photoreceptor shedding. Exp Eye Res.
during phagocytosis. J Clin Invest. 1968;47:2217–2229. 1992;55:93–100.
Downloaded from iovs.arvojournals.org on 12/22/2020You can also read