Transcriptome landscape of the developing olive fruit fly embryo delineated by Oxford Nanopore long-read RNA-Seq - bioRxiv
←
→
Page content transcription
If your browser does not render page correctly, please read the page content below
bioRxiv preprint first posted online Nov. 24, 2018; doi: http://dx.doi.org/10.1101/478172. The copyright holder for this preprint
 (which was not peer-reviewed) is the author/funder, who has granted bioRxiv a license to display the preprint in perpetuity.
                              It is made available under a CC-BY-NC-ND 4.0 International license.

     Transcriptome landscape of the developing olive fruit fly embryo delineated
                     by Oxford Nanopore long-read RNA-Seq

      Anthony Bayega1, Spyros Oikonomopoulos1, Eleftherios Zorbas2, Yu Chang Wang1, Maria-
      Eleni Gregoriou2, Konstantina T Tsoumani2, Kostas D Mathiopoulos2, Jiannis Ragoussis1,3

   1. McGill University and Genome Quebec Innovation Centre, Department of Human Genetics,
   740 Dr. Penfield Avenue, McGill University, Montréal, Québec, Canada
   2. Laboratory of Genomics and Molecular Biology, Department of Biochemistry &
   Biotechnology, University of Thessaly, Thessaly, Greece
   3. Department of Bioengineering, McGill University, Montréal, Québec, Canada
   Correspondence should be addressed to JR (ioannis.ragoussis@mcgill.ca)

   Abstract
   The olive fruit fly or olive fly (Bactrocera oleae) is the most important pest of cultivated olive
   trees. Like all insects the olive fly undergoes complete metamorphosis. However, the transcription
   dynamics that occur during early embryonic development have not been explored, while detailed
   transcriptomic analysis in the absence of a fully annotated genome is challenging. We collected
   olive fly embryos at hourly intervals for the first 6 hours of development and performed full-length
   cDNA-Seq using a purpose designed SMARTer cDNA synthesis protocol followed by sequencing
   on the MinION (Oxford Nanopore Technologies). We generated 31 million total reads across the
   timepoints (median yield 4.2 million per timepoint). The reads showed 98 % alignment rate to the
   olive fly genome and 91 % alignment rate to the NBCI predicted B. oleae gene models. Over 50
   % of the expressed genes had at least one read covering its entire length validating our full-length
   RNA-Seq procedure. Expression of 68 % of the predicted B. oleae genes was detected in the first
   six hours of development. We generated a de novo transcriptome assembly of the olive fly and
   identified 3553 novel genes and a total of 79,810 transcripts; a fourfold increase in transcriptome
   diversity compared to the NCBI predicted transcriptome. On a global scale, the first six hours of
   embryo development were characterized by dramatic transcriptome changes with the total number
   of transcripts per embryo dropping to half from the first hour to the second hour of embryo
   development. Clustering of genes based on temporal co-expression followed by gene-set
   enrichment analysiss of genes expressed in the first six hours of embryo development showed that
   genes involved in transcription and translation, macro-molecule biosynthesis, and
   neurodevelopment were highly enriched. These data provide the first insight into the transcriptome
   landscape of the developing olive fly embryo. The data also reveal transcript signatures of sex
   development. Overall, full-length sequencing of the cDNA molecules permitted a detailed

                                                                                                                                    1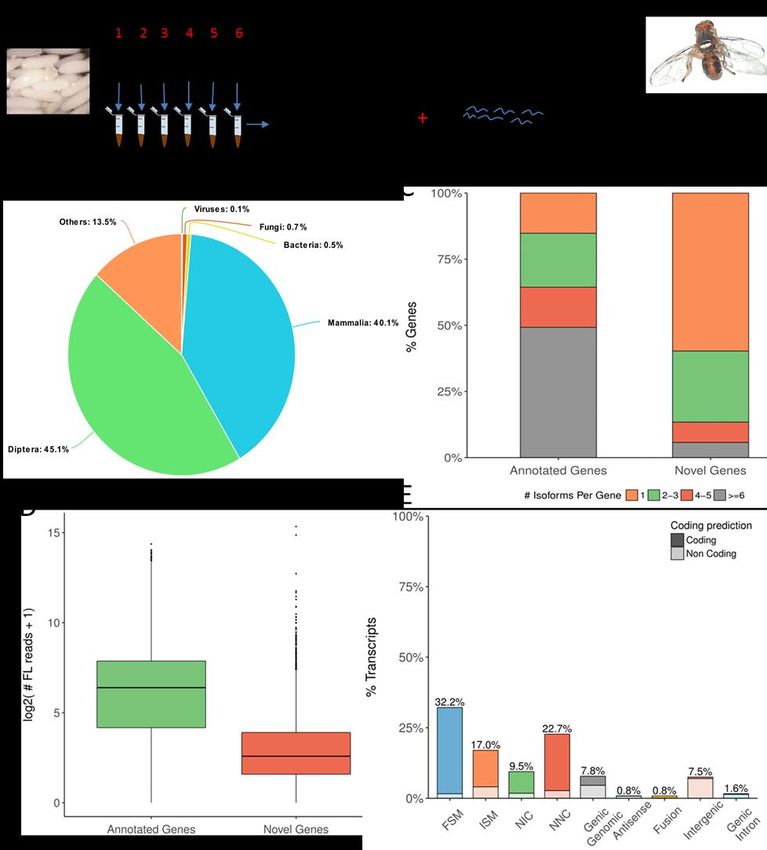
bioRxiv preprint first posted online Nov. 24, 2018; doi: http://dx.doi.org/10.1101/478172. The copyright holder for this preprint
 (which was not peer-reviewed) is the author/funder, who has granted bioRxiv a license to display the preprint in perpetuity.
                              It is made available under a CC-BY-NC-ND 4.0 International license.

   characterization of the isoform complexity and the transcriptional dynamics of the first embryonic
   stages of the B. oleae.

   Key words: long-read RNA-Seq, embryo development, olive fruit fly, Bactrocera oleae

                                                                                                                                    2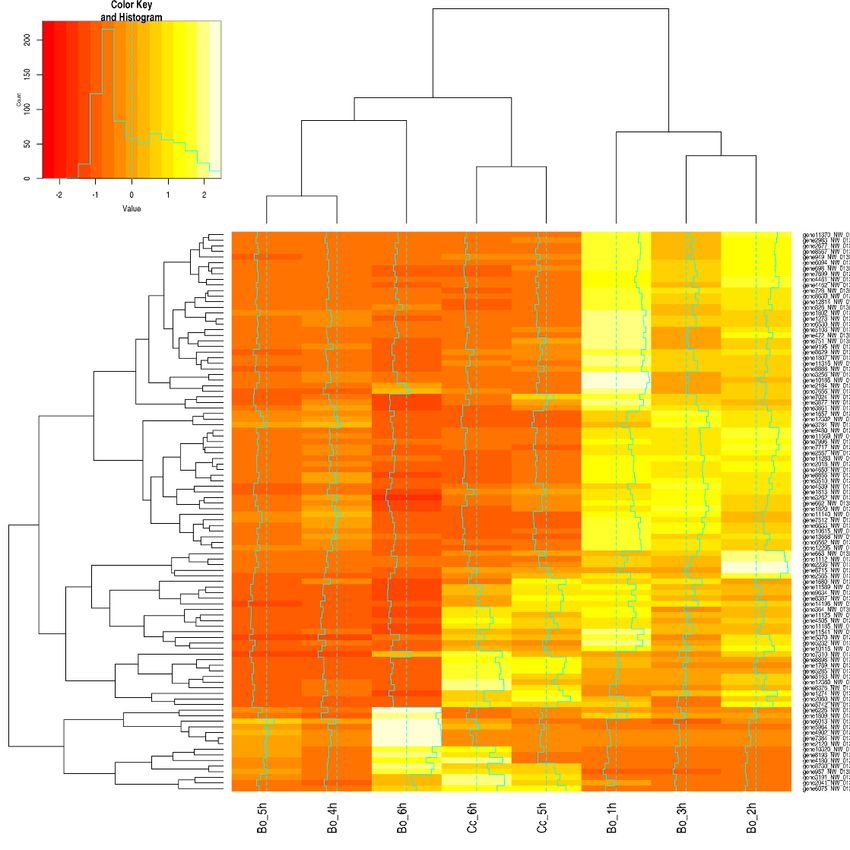
bioRxiv preprint first posted online Nov. 24, 2018; doi: http://dx.doi.org/10.1101/478172. The copyright holder for this preprint
 (which was not peer-reviewed) is the author/funder, who has granted bioRxiv a license to display the preprint in perpetuity.
                              It is made available under a CC-BY-NC-ND 4.0 International license.

   Introduction

   The olive fruit fly or olive fly (Bactrocera oleae), is an insect of huge economic importance in the
   olive agribusiness industry costing an estimated 800 million US dollars annually[1]. Adult female
   flies lay eggs in the olive fruits where the eggs hatch and develop into larvae. The larvae feed on
   the olive sap causing serious qualitative and quantitative damages to the fruits, making olive flies
   the most important pest for both wild and cultivated olive fruits.

   Olive flies are Dipteran insects belonging to the Tephritidae family. Although olive flies are
   holometabolous transcriptional events that occur during early embryo development have not been
   studied. Delineating the transcriptional dynamics in the first few hours of embryo development is
   important to determine the mechanisms of tissue development and the genes required in the early
   life of the embryo. These transcriptional dynamics can also be used to determine the mechanism
   of sexual commitment in the olive fly, a process known to be initiated within the first 6 hours of
   embryo development[2] and indeed, a fundamental question that has been at the center of olive fly
   research for decades[2].

   Gene expression is dynamic and tightly regulated. In rapidly changing systems like developing
   embryos precise and coordinated dramatic shifts in transcriptome kinetics occur in quick
   succession. Although relative normalization is a common method of measuring and comparing
   transcriptional changes, direct absolute normalization has been shown to perform superiorly to
   relative normalization in capturing transcriptional dynamics[3]. Coupled with time-course
   experimentation, absolute normalization enables direct measurement of transcript kinetics thus
   providing a quantitative understanding of the rate of change of transcript copy numbers with time.
   Such a quantitative understanding of the transcriptome during embryogenesis can greatly improve
   our understanding of the impact of different transcript regulation strategies on gene expression.

   cDNA sequencing using short-read technologies such as sequence-by-synthesis (Illumina Inc.,
   USA) is currently the standard in high throughput transcriptional exploration. Due to their short-
   read nature however, these technologies are inefficient in delineating the full depth of
   transcriptome landscape particularly regarding isoform diversity[4, 5]. We and others have shown
   that long-read technologies provide full-length transcript resolution[6, 7] and enable identification
   of hitherto unknown genes and isoforms [8-11]. This can be particularly useful for organisms that
   are not well characterized at a genomics level. Among long-read technologies, the Oxford
   Nanopore Technologies (ONT, UK) protein nanopore sequencing is particularly attractive due to
   higher throughput, simpler library preparation workflow, and gene expression quantification that
   is comparable to current standards [8-11].

   Here we used the ONT sequencing technology and the MinION sequencer to explore the
   transcriptome of olive fly embryos collected at hourly intervals for the first 6 hours post oviposition
   (hpo). We refine the B. oleae current NCBI predicted gene models by providing a rich set of
                                                                                                                                    3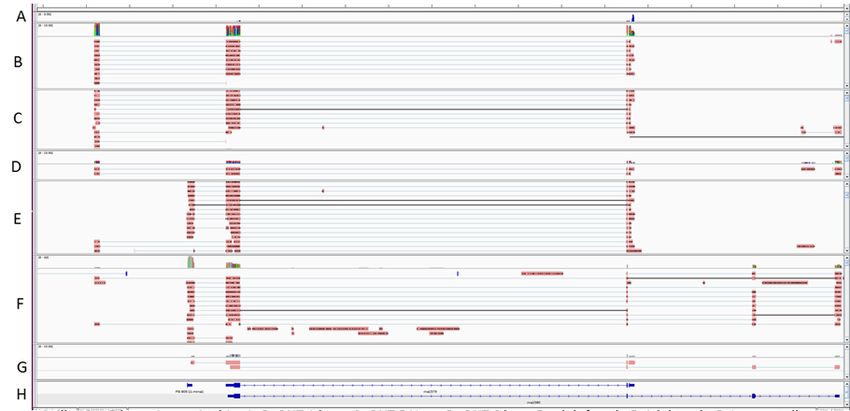
bioRxiv preprint first posted online Nov. 24, 2018; doi: http://dx.doi.org/10.1101/478172. The copyright holder for this preprint
 (which was not peer-reviewed) is the author/funder, who has granted bioRxiv a license to display the preprint in perpetuity.
                              It is made available under a CC-BY-NC-ND 4.0 International license.

   isoform models found in the first six hours of embryonic development and identify mis-annotations
   in the currently available NCBI gene model annotations. We also measured transcript kinetics,
   which can be linked to biological processes occurring during embryogenesis. We provide a set of
   co-regulatory genes across the different time points that can help to understand the sequence of
   events during early development. We also explored a range of data analysis tools currently
   available for long-read technologies.

   Results

   The current B. oleae genome assembly and genome annotation

   The olive fly has six pairs of chromosomes which include a pair of heterochromatic sex
   chromosomes with the male being the heterogametic sex[12]. The B. oleae genome size was
   initially estimated by qPCR to be in the range of 322 Mb[13]. We previously submitted to NCBI a
   B. oleae genome assembled from short-reads and long-read scaffolding. This assembly (GeneBank
   accession GCA_001188975.2) has a total size of 471,780,370 bases and is contained in 36,198
   scaffolds, with a contig N50 of 135,231 bases. This genome was annotated using the NCBI
   Eukaryotic Genome Annotation Pipeline yielding the Bactrocera oleae Annotation Release 100.
   This annotation contains a total of 13936 genes and pseudogenes of which 13198, 392, 346 are
   predicted to be protein-coding, non-coding, and pseudogenes, respectively. Further, 2,759 genes
   are predicted to have variants (isoforms). In total, the B. oleae genome was predicted to contain
   19,694 transcripts of which 18702, 411, 393, 188 are mRNA (with CDSs), tRNA, lncRNAs, and
   miscellaneous RNAs, respectively. Whereas the mean length of the genes and transcripts is 9,597
   bp and 2,259 bp, respectively, the longest gene is 497,921 bp while the longest transcript is 59,475
   bp. All alignments and genes reported in this article refer to these references: genome
   GCA_001188975.2 and annotation NCBI Bactrocera oleae Annotation Release 100, unless
   otherwise stated.

   Because only 14,555 mRNA (with CDSs) out of the 18,702 in the NCBI annotation (77.8%) were
   assigned a gene product corresponding to their respective Drosophila melanogaster homolog, we
   obtained the NCBI predicted proteins and re-determined the Uniprot homologues to D.
   melanogaster (see Materials and Methods). Of the 13198 protein coding genes 12494 (95%) were
   assigned a D. melanogaster homologue (E-value ≤ 1e-3). Of these, 57% were identified in the
   UniProtKB/Swiss-prot database, which comprises high quality manually annotated and
   nonredundant proteins while the remaining 43% were identified in the UniProtKB/TrEMBL
   database which contains high quality computationally annotated and classified proteins.

                                                                                                                                    4
bioRxiv preprint first posted online Nov. 24, 2018; doi: http://dx.doi.org/10.1101/478172. The copyright holder for this preprint
(which was not peer-reviewed) is the author/funder, who has granted bioRxiv a license to display the preprint in perpetuity.
It is made available under a CC-BY-NC-ND 4.0 International license.
De novo genome-guided transcriptome assembly of the olive fly identifies new genes and
isoforms
We performed cDNA synthesis for mixed sex B. oleae embryos collected at one-hour intervals for
the first six hours of development using an optimized and customized SMARTer protocol[14]
aimed at capturing poly(A)+ RNA(Figure 1A, See Supplementary protocol, Supplementary Table
1). cDNA sequencing libraries were generated following the SQK-LSK108 protocol (ONT) and
sequenced on the MinION using 1D R9.4 flow cells (see Supplementary Table 2 and 3 for
sequencing statistics). We also included 2 cDNA libraries separately generated from the heads of
adult male and female flies.
We developed a computational pipeline (Supplementary Figure 1) to perform de novo
transcriptome assembly. We generated 31 million reads of which 22 million reads (71 %) were
error-corrected using Canu[15]. We then focused only on full-length reads identified as those that
possessed both 5’ adapters and both poly(A) and 3’ adapter (Supplementary Figure 1). These were
then pre-processed to orient the strands, trim adapters, and correct errors using short-reads. First,
we used 3 million reads generated from the 5-hour timepoint to compare three genome-guided de
novo transcriptome assembly tools; TAMA (https://github.com/GenomeRIK/tama), Cupcake
ToFU (https://github.com/Magdoll/cDNA_Cupcake/wiki/Cupcake-ToFU%3A-supporting-
scripts-for-Iso-Seq-after-clustering-step), and TAPIS[16]. We opted for Cupckae ToFU due to its
computational efficiency, high sensitivity and precision (see Supplementary Materials for details).
Of the 31 million reads, 14.7 million reads passed pre-processing and were aligned to the B. oleae
genome using GMAP[17]. Because the ToFU software of our assembly workflow was set to
consider reads that were aligned at least 99 % in length and with at least 95 % identity, out of the
total 14.7 million reads, 3.9 million were used to derive the transcriptome assembly. The de novo
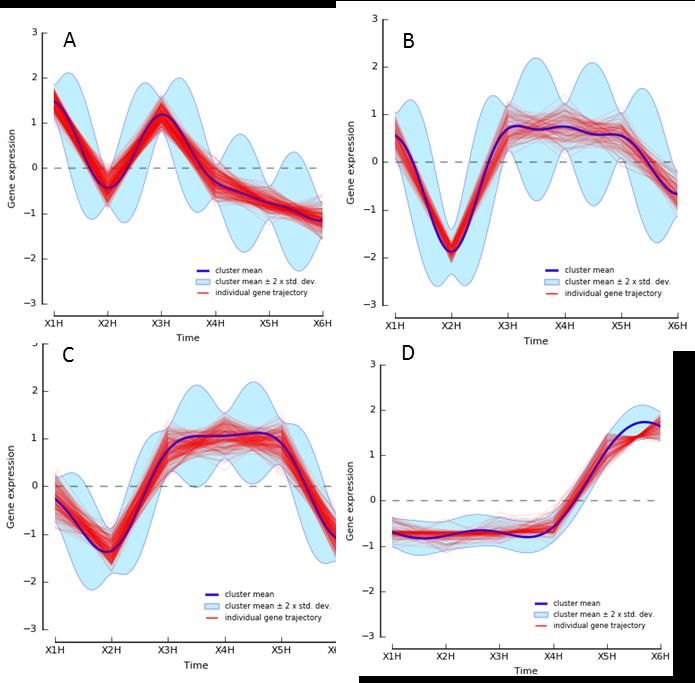
assembled transcriptome was analyzed using SQANTI[18] and PRAPI[19]. The ToFU
transcriptome assembly contained a total of 11,883 genes and 79,810 isoforms (Table 1) of which
8330 genes matched the NCBI annotated genes while 3553 genes were novel. All these correspond
to a four-fold expansion of the olive fly transcriptome at the isoform level over the current NCBI
annotation. A blast search of the predicted protein sequences against Uniprot Swiss-prot database
showed the top hits were of the order Diptera (45.1%, Figure 1B), followed by class Mammalia
(40.1%). Further analsysis, revealed that 99% of the hits to Mammalia also had hits to Diptera.
Hits to Viruses, Fungi, and Bacteria accounted for only 1.3%.
Surprisingly, although 3553 novel genes were identified, only 269 were predicted to contain open
reading frames. Over 50% of novel genes were mono-exon compared to annotated genes where
over 80% of the genes were multi-exon and also contained much higher percentage of mono-
isoform genes (>50% compared to 86% among annotated genes, Figure 1B). Novel genes also
5bioRxiv preprint first posted online Nov. 24, 2018; doi: http://dx.doi.org/10.1101/478172. The copyright holder for this preprint
(which was not peer-reviewed) is the author/funder, who has granted bioRxiv a license to display the preprint in perpetuity.
It is made available under a CC-BY-NC-ND 4.0 International license.
showed lower expression compared to annotated genes (Figure 1D). Structurally, SQANTI
categorizes the transcripts into 9 groups depending on their splice junction and genomic
coordinate. These include; full splice match (FSM), incomplete splice match (ISM), novel in
catalogue (NIC), novel not in catalogue (NNC), genic genomic, antisense, fusion, intergenic, genic
intron. Most of the ToFU collapsed transcripts were a FSM (32.2%), followed by transcripts
containing alternatively spliced junctions (22.7%, Table 1, Figure 1E). A more detailed exploration
of the transcriptome is shown in Extended material.
Using PRAPI, we identified 63 genes that were miss-annotated as two or more separate genes, but
we could find single transcript reads covering the two genes (see Supplementary Figure 2).
Direct Absolute Normalization of RNA-Seq Data outperforms relative normalization
The method and justification for absolute normalization have been previously reported by Owens
et al.[3]. To obtain absolute transcript numbers we added ERCC internal spike-in RNA standards
in our cDNA synthesis step at a constant ratio per number of embryos used in each timepoint.
Following sequencing and alignment, absolute normalization was achieved following 2 steps; 1)
relative normalization for sequencing depth using Mandalorion[8], resulting in transcript
abundances in number of reads per gene per 10000 mapped reads (RP10K). We noted that the
relative normalized abundances of our RNA standards varied with time most likely due to changes
in the amount of poly(A) RNA in the embryo (Figure 2A). In the second step, we used the standard
curve generated from ERCC standards to transform our relative counts to absolute counts per
embryo. Here we noted that the ERCC standards did not vary significantly across timepoints
(Figure 2B, Supplementary Figure 3).
Interestingly, in contrast to the relative expression, when the absolute number of transcript per
embryo for all genes were summed and plotted across timepoints (Figure 2 C and D), the profile
mirrored that of cDNA generated per embryo (Supplementary Figure 4A), thus validating the
absolute normalization approach. Further, as we had anticipated, the neighboring timepoints
showed higher gene expression correlation than distant timepoints (Supplementary Figure 5) with
Spearman correlation for successive samples consistently equal or above 0.96. This suggests that
our sampling was close enough to capture transcriptional dynamics across the sampling time. We
also calculated the lower limit detection limit setting our sensitivity to RPG10K of 0.01 which
corresponds to ~2 mapped reads. Averaged over the 6 samples, the detection limit was 1038
transcripts per embryo.
6bioRxiv preprint first posted online Nov. 24, 2018; doi: http://dx.doi.org/10.1101/478172. The copyright holder for this preprint
(which was not peer-reviewed) is the author/funder, who has granted bioRxiv a license to display the preprint in perpetuity.
It is made available under a CC-BY-NC-ND 4.0 International license.
Total mRNA Content of the Embryo and Biological replication validate absolute
quantification
During the cDNA synthesis step of our protocol we added an equal amount of internal RNA
standards (ERCCs) per number of embryos in order to calibrate read counts and obtain absolute
numbers of transcripts per embryo. We computed the total mRNA per embryo by summing all
transcripts per gene per embryo and calculating the equivalent in nanograms (Figure 3 A). The total
mRNA dropped from 1.26 ng/embryo at 1 hpo to 0.61 ng/embryo at 2 hpo and then increased to
1.49 ng/embryo at 3 hpo before dropping to 0.93 ng/embryo at the end of our sampling at 6 hpo.
The pattern mirrors the total transcripts per embryo (Figure 2 D). The mRNA levels agree with the
total RNA yields we obtained per embryo (~33 ng/embryo at 1 hpo and 53 ng/embryo at 6 hpo,
Supplementary Table 1) assuming 2-5% of total RNA is polyadenylated. We also compared the
volume of B. oleae embryos to Xenopus tropicalis (0.025 mm3 versus 0.268 mm3, respectively,
giving a volume ratio of 10.7). X. tropicalis embryos contain 10 – 15 ng of mRNA/embryo at
fertilization[3] which closely matches the B. oleae 13.5 ng mRNA/embryo at 1 hpo, after account
for the volume ratio.
We further sought to determine whether the expression patterns observed could be replicated in a
different set of biological samples and using real-time quantitative PCR (qPCR) which is the
current standard method for quantifying gene expression. However, the relative method of qPCR
gene expression requires identification of a reference gene set whose expression remains stable
across samples. Sagri et al.[20] evaluated several commonly used reference genes and identified
14-3-3zeta and RPL19 B. oleae D. melanogaster homologues to be optimal reference genes in B.
oleae eggs collected at 15 minutes following oviposition. We used our data to determine the
variation in expression levels of these common reference genes as well as GAPDH (Supplementary
Figure 6). In agreement with Sagri et al., 14-3-3zeta had minimal variability in expression and
could be used as reference genes for qPCR. We then evaluated the qPCR expression of 3 genes;
SRY, HID, and LINGERER, in a different set of biological replicate samples (skipping 6-hour
timepoint) using RPL19 and 14-3-3zeta as reference genes. We observed similar trends of gene
expression (particularly with 14-3-3zeta compared with RPL19 (Figure 3 C and D).
We then, sought to find other genes that could be used as reference genes. We found 66 genes in
poly(A)+ (1–6 hpf) that had less than a 0.4-fold change.
To further explore the expression profiles, we performed principal component analysis (PCA) and
hierarchical clustering using the most differentially expressed genes. Projection of the expression
onto the first two principle components showed temporal correlation of expression across the
different timepoints. The first principle component separated the first 3 timepoints from the last 3
7bioRxiv preprint first posted online Nov. 24, 2018; doi: http://dx.doi.org/10.1101/478172. The copyright holder for this preprint
(which was not peer-reviewed) is the author/funder, who has granted bioRxiv a license to display the preprint in perpetuity.
It is made available under a CC-BY-NC-ND 4.0 International license.
timepoints (Figure 4). Hierarchical clustering further showed that the first 3 and last 3 timepoints
were separately co-clustered (Figure 5).
We also downloaded Drosophila melanogaster RNA-Seq data from Flybase database[21] and
projected them together our B. oleae data using. Projecting the expressions onto the first principle
component showed that D. melanogaster embryos at 2 hours post fertilization (hpf) clustered with
B. oleae 1- 3 hpo timepoints. Similarly, the first principle component co-clustered D. melanogaster
2-8 hpf and B. oleae 4-6 hpo (Figure 4 ). This suggested close similarity in gene expression patterns
between the closely related D. melanogaster and B. oleae Dipteran insects.
The Maternal-to-Zygotic Transition shows dramatic shift in embryo mRNA content
The developing embryos of many metazoans including echinoderms, nematodes, insects, fish,
amphibians, and mammals, are characterized by dramatic transcriptional changes one of which is
the change of embryo dependence from maternal to zygotic transcripts; the maternal-to-zygotic
transition (MZT, reviewed in Tadros and Lipshitz[22] and Langley et al., [23]). MZT involves 2
main stages; first is the clearance of a large proportion of maternal transcripts and proteins
originally loaded into the oocyte during oogenesis, and then initiation of zygotic transcription[22].
In Drosophila melanogaster where MZT has been extensively studied, the embryo is dependent
on maternal transcripts and proteins up to cell cycle 14 (2 – 3 hours post fertilization, hpf).
However, during MZT up to 20% of maternally supplied transcripts are destabilized by maternally
encoded proteins by the end of 2 hpf and another 15% of maternal transcripts are destabilized by
zygotically encoded protein by 3 hpf[22]. The D. melanogaster maternally destabilized genes are
enriched in cell cycle functions while maternally stable genes are enriched in house-keeping
functions like metabolism, translation.
In D. melanogaster still, the timing of the zygotic genome transcription activation depends on
absolute time or developmental stage, the main wave of which starts at 2 hpf. Gene ontology search
among strictly zygotic genes has shown them to be enriched in transcriptional factors which are
probably needed to guide the development of the embryo.
We used our time-course data to elucidate the mechanism of MZT in B. oleae, a process that has
not been studied before to the best of our knowledge. We identified an interesting phenomenon
when examining the total mRNA content per embryo during development across timepoints (Figure
3 A). The total mRNA per embryo dropped 51% at 2 hpo compared to levels at 1 hpo and increased
143% at 3 hpo compared to levels at 2 hpo. Interestingly, the distribution of the number of
transcripts per gene at different timepoints (Supplementary Figure 7 A) followed a trend similar
to the total number of transcripts per embryo suggesting that the clearance of maternal transcripts
seen at 2 hpo and the subsequent activation of zygotic gene expression seen at 3 hpo were global
events as opposed to targeting specific genes. Indeed, the number of expressed genes was similar
8bioRxiv preprint first posted online Nov. 24, 2018; doi: http://dx.doi.org/10.1101/478172. The copyright holder for this preprint
(which was not peer-reviewed) is the author/funder, who has granted bioRxiv a license to display the preprint in perpetuity.
It is made available under a CC-BY-NC-ND 4.0 International license.
between 1,2 and 3 hpo (11043, 10542, and 10713, respectively). We then hypothesized that cleared
genes would be enriched with highly expressed genes. Using our time-course data, we performed
differential expression between successive timepoints using GFOLD[24] which is designed for
samples without biological replicates. GFOLD log2 fold change has been shown to correlate well
with qPCR-determined fold change[25]. Genes were coded as upregulated or downregulated using
a Gfold cutoff of ±0.5. We identified 1496 genes that were downregulated at 2 hpo compared to 1
hpo. These genes are enriched in maternal-degraded transcripts and are here referred to as
maternal-degraded genes. Indeed, at 1 hpo the expression level of maternal-degraded genes was
higher than that of the other genes (Supplementary Figure 7 B). The same genes showed similar
expression levels at 2 hpo compared to other genes suggesting that these genes were destabilized
down to basal levels of other genes (Supplementary Figure 7 C).
We also identified a group of 215 genes enriched in zygotic transcripts (here referred to as zygotic
genes). These genes were not detectable at 1 hpo but detectable at any of the other timepoints
suggesting that their transcription was from zygotic genome. Since the mRNA content per embryo
at 3 hpo had increased 143% compared to 2 hpo, we sought to determine if there was a set of genes
that could explain this increase. Maternal-degraded genes, and purely zygotic genes (215 genes
whose expression was at 2 or 3 hpo but not at 1 hpo) could not explain this increase as their
expression was either similar or much lower than the other genes, respectively (Extended
materials).
We performed gene-set enrichment analysis across 3 categories; maternal-degraded genes, zygotic
genes, and maternal stable/upregulated genes. The maternal-degraded genes, which were also
among the most highly expressed at 1 hpo were enriched in cellular processes, development, and
metabolism (Figure 6). The maternal-degraded genes were also enriched in transcription factors for
example DREF, BEAF-32A, PNR which are the corresponding Drosophila homologues (Figure 6).
More like the maternal-degraded genes, the maternal-stable/upregulated genes were enriched in
translation, biosynthesis process, gene expression, metabolic processes among others which
reflects the high metabolic activity of the rapidly growing embryo (Figure 6). DREF transcription
factor was also enriched in these genes (Figure 6).
Strikingly, zygotic genes were enriched in specific tissue formation and developing processes
including; hindgut development, pattern specification, digestive tract morphogenesis (Figure 6).
Clustering of genes based on temporal expression dynamics
Gene expression is a tightly regulated process. In developing embryos regulation of spatio-
temporal dynamics in gene expression is critical for proper organ development. Clustering of genes
depending on their temporal expression dynamics not only reduces the complexity of the
expression matrix into simple gene groups but can also identify genes with similar biological
9bioRxiv preprint first posted online Nov. 24, 2018; doi: http://dx.doi.org/10.1101/478172. The copyright holder for this preprint
(which was not peer-reviewed) is the author/funder, who has granted bioRxiv a license to display the preprint in perpetuity.
It is made available under a CC-BY-NC-ND 4.0 International license.
function as previously shown[26, 27]. Temporal gene expressions have been suggested to follow
Guassian distribution[3]. We thus clustered our data using DPGP[28] which jointly models data
clusters with a Dirichlet process and temporal dependencies with Gaussian processes. Indeed, we
identified genes whose expression peaks at different timepoints, demonstrating transcript kinetics
that are highly dynamic and suggesting specific roles for these genes during defined developmental
periods (Figure 7, Extended material). We further grouped the clusters into 3 groups; 1) genes
which peaked at 3 hpo and generally decreased over time, termed early genes (Figure 7A), 2) genes
whose expression was maintained through 3-5 hpo, termed middle genes (Figure 7 B and C), and
3) genes whose expression only increased at 5 and/or 6 hpo, termed late genes (Figure 7 D). Gene-
set enrichment showed that indeed, as observed previously under maternal categories of gene,
early genes and middle genes were enriched in cellular processes and metabolic process while late
genes were enriched in specialized development processes.
Long-read RNA-Seq improves annotation of genes in the sex determination pathway
Dipteran insects share a large part of their sex determination mechanism. In Drosophila
melanogaster where the sex determination mechanism has been extensively studied (reviewed
in[29]), the sex lethal gene (sxl) acts as the master regulator, mediating sex-specific alternative
splicing of both itself and the transformer gene (tra) depending on ratio of sex chromosomes to
autosomes. tra in turn mediates sex-specific alternative splicing of double sex (dsx), the last
member of the cascade and the mediator of differential sex development. B. oleae homologues of
sxl, tra, and dsx have all been identified[30, 31]. However, the master regulator has remained
elusive. Sex determination in the olive fly has been suggested to occur within the first 6 hours of
embryo development, and to be orchestrated by alternative splicing of tra and dsx akin to the sex
determination mechanism in D. melanogaster. In our data, we were able to observe a wide range
of alternative splicing for tra and dsx. We used long-reads from adult male and female heads to
identify sex specific isoforms.
In the case of the dsx the isoform complexity was significantly different in the early developmental
stages compared to the adult ones. In our data we saw isoforms with a different transcription start-
site and with a longer length as the prominent isoform present in the early embryonic stages of
development (Figure 8). These isoforms in the adult head tissue shift to shorter ones with a exon 4
being present in the female but absent from the male (Figure 8). Lagos et al [5] have shown that
these distinct shorter isoforms are involved in the production of sex-specific proteins important for
the sex determination pathway. As we were not able to detect these sex-specific isoforms in the
early embryonic stages we argue that their expression starts later during development.
Nevertheless, their accumulation at later stages is representative of the sex specification system
activated in the early stages of development.
10bioRxiv preprint first posted online Nov. 24, 2018; doi: http://dx.doi.org/10.1101/478172. The copyright holder for this preprint
(which was not peer-reviewed) is the author/funder, who has granted bioRxiv a license to display the preprint in perpetuity.
It is made available under a CC-BY-NC-ND 4.0 International license.
Discussion
Embryonic development has been widely studied in model organisms because of the interest and
puzzling nature of the fertilized egg. In insects, embryogenesis has been and continues to be
extensively studied in the fruit fly Drosophila melanogaster. However, in organisms that are not
well characterized long-read RNA-seq has the potential to reveal hitherto unknown genes, correct
mis-annotations, and expand isoform diversity. Here, we pooled mixed-sex olive fruit fly
(Bactrocera oleae) embryos collected at hourly intervals following oviposition for the first six
hours of development. This period is interesting to study since previous studies in relatives of B.
oleae have indicated that the mechanism of sex determination which is mediated by alternative
splicing of genes is initiated during this period[2]. Further, evidence from Ceratitis capitata
suggests that establishment of pole cells, the primordial germ cells, occurs during this period[32].
It is therefore, important to elucidate the transcriptional status during this period. We however,
included male and female heads in the generation of the transcriptome (because these were the
tissues available to us) in order to expand the transcriptome. cDNA was generated separately from
each of the samples using our custom cDNA preparation protocol that enables identification of 5’
and 3’ ends, and addition of ERCC molecular standards to enable absolute quantification of gene
expression (see Supplementary material).
We sequenced the cDNA on the MinION (Oxford Nanopore Technologies) using R9.4 1D
sequencing chemistry. Details of read yields, alignment statistics, our custom transcriptome
assembly workflow, are provided in Extended materials. The de novo transcriptome assembly
contained 11,883 genes of which 8330 were previously annotated while 3553 are novel genes. Our
transcriptomic data provide a rich source of splice variants observed in developing embryos and
mature insects, enhancing by 4-fold the isoform models of the current genome assembly. We also
provide corrections for 38 genes currently wrongly modelled in the current NCBI annotation. The
current B. oleae NCBI estimation of 13198 genes is comparable to the number of the closely
related Ceratitis capitata (14,652[33]). The C. capitata genes were however, computationally
predicted and thus could face similar limitations as the B. oleae predicted gene. The well-studied
D. melanogaster contains ~17,000 genes. We thus argue that the current B. oleae number of genes
is underestimated, and our transcriptome provides over 3000 novel genes towards completing the
annotation of the genome. Pavlidi et al., [34] previously generated a transcriptome assembly of the
olive fly and assembled a total of 14,204 contigs. However, they used a short-read sequencing
technology (454 pyrosequencing) and the average contig length was 421 bp compared to an
average of 9000 bp in our transcriptome and 9,597 in the NCBI predicted gene models.
Calibration of our gene expression quantification using internal standards enabled absolute
quantification of the transcripts per gene. Although the ERCC internal standards exhibit
sequencing biases which ultimately affects quantification[3] they have been used successfully to
quantify gene expressions. We observed that the total mRNA content of the embryo calculated
with absolute normalisation was similar to total yield of cDNA generated per embryo. The
11bioRxiv preprint first posted online Nov. 24, 2018; doi: http://dx.doi.org/10.1101/478172. The copyright holder for this preprint
(which was not peer-reviewed) is the author/funder, who has granted bioRxiv a license to display the preprint in perpetuity.
It is made available under a CC-BY-NC-ND 4.0 International license.
remarkable similarity between B. oleae total mRNA content and X. tropicalis after accounting for
embryo volume differences provided further validation of our quantification. Further, the total
RNA content of the embryo calculated from absolute normalisation agreed with the actual yield
we obtained, thus validating the absolute normalisation method. Further validation of gene
expression using qPCR and biological replicates yielded comparable results with our absolute
quantified expressions. Furthermore, through the absolute quantification approach we have
identified 14-3-3 zeta gene as a suitable normalization controls for qRT-PCR in early embryo
samples as previously determined by Sagri et al.
The maternal-to-zygotic transition is a key process in development of many organisms. This
process has been extensively studied in D. melanogaster. For example, in chromosome ablation
and microarray experiments, De Renzis et al.[35], performed a deep characterization the
transcriptome of D. melanogaster embryos at 0-1 and 2-3 hour post fertilization and provided a
rich catalogue of maternal and zygotic genes. However, MZT has not been well studied in other
insects. Our sampling captures this period as it covers the events beginning at oviposition (1 hpo)
up to the beginning of blastoderm cellularization (6 hpo) when pole cells are already established
at the posterior end of the embryo[36]. We show that in B. oleae, the MZT is characterized by a
dramatic reduction in poly(A) content of embryos, dropping 51% from 1.2 ng/embryo at 1 hpo to
0.6 ng/embryo at 2 hpo and increases 143% to 1.4 ng/embryo at 3 hpo. The distribution of the
number of transcripts per gene across timepoints suggested that clearance of poly(A) transcripts
and subsequent replenishment are global events as opposed to targeted. Indeed, genes identified
as downregulated between 1 and 2 hpo had higher expression at 1 hpo and the same genes had
similar expression levels at 2 hpo.
The enrichment of maternal transcripts with translation, cellular process genes, metabolic process
genes, and transcription factors like DBREF agrees with the notion that the embryo is dependent
on this rich medium for the first 2 hours of development where rapid cell division and expansion
occurs [22]. Zygotic genes on the other hand were enriched in developmental process.
However, our approach cannot differentiate between genes directly transcribed from zygotic
genome and maternal transcripts which undergo post-transcription modification (for example
polyadenylation) and thus making them appear in our quantification. Indeed, in Drosophila, the
cytoplasmic poly(A) polymerase encoded by wispy promotes poly(A)-tail lengthening during both
oocyte maturation and egg activation[37-39]. Therefore, expression profiling methods that do not
rely on oligo dT priming or genetic manipulations as for example in De Renzis et al.,[35] who
used chromosomal deletion would need to be performed to identify purely zygotic genes in B.
oleae.
Successful creation of transgenic flies capable of passing on the mutation requires injection of
preblastoderm syncytium embryos before establishment of pole cells which eventually become
12bioRxiv preprint first posted online Nov. 24, 2018; doi: http://dx.doi.org/10.1101/478172. The copyright holder for this preprint
(which was not peer-reviewed) is the author/funder, who has granted bioRxiv a license to display the preprint in perpetuity.
It is made available under a CC-BY-NC-ND 4.0 International license.
germ cells, typically 20 minutes to 2 hours following oviposition [40-42]. Although the precise
timing of pole cell formation has not been reported in olive fly, in the closely related medfly pole
cells are established 3-3.5 hours following oviposition[43]. Understanding the structure of genes
involved in sex determination at this stage is important as it might reveal avenues of genetic
control. Indeed, using a CRISPR-Cas gene drive targeting exon 5 of doublesex gene (dsx) in
Anopheles gambiae enabled near complete suppression of mosquito populations in the lab[42]. dsx
in B. oleae females carries exon 4 which is absent in males and is thus a potential target for genetic
control.
We used the full-length reads to improve the annotation of genes in the sex determination pathway.
Earlier work by Lagos et al.[30, 31] had identified the most important genes in the sex
determination cascade, key components of which rely on alternative splicing. We not only confirm,
but also expand the number of isoforms detected, while also being able to characterize them as
single molecules rather than as collections of individual PCR products. More importantly, the Y-
chromosome localized male determining factor that should be expressed at the early embryonic
stages remains elusive. Based on downstream splicing effects we can detect male specific
alternative splicing of tra from the 5-hour timepoint, which indicates that the sex determining
factor must be present in our data. Future efforts will concentrate in its identification and
characterization by combining this transcription profiling effort with improved genome assemblies
and in particular Y-chromosome assemblies. Overall, our transcription profiling effort provides a
rich resource to identify early development genes and transcript isoforms and an extensive set of
alternative splicing variants.
13bioRxiv preprint first posted online Nov. 24, 2018; doi: http://dx.doi.org/10.1101/478172. The copyright holder for this preprint
(which was not peer-reviewed) is the author/funder, who has granted bioRxiv a license to display the preprint in perpetuity.
It is made available under a CC-BY-NC-ND 4.0 International license.
References
1. Daane, K.M. and M.W. Johnson, Olive fruit fly: managing an ancient pest in modern times. Annu
Rev Entomol, 2010. 55: p. 151-69.
2. Morrow, J.L., et al., Expression patterns of sex-determination genes in single male and female
embryos of two Bactrocera fruit fly species during early development. Insect Molecular Biology,
2014. 23(6): p. 754-767.
3. Owens, N.D.L., et al., Measuring Absolute RNA Copy Numbers at High Temporal Resolution
Reveals Transcriptome Kinetics in Development. Cell Rep, 2016. 14(3): p. 632-647.
4. Angelini, C., D. De Canditiis, and I. De Feis, Computational approaches for isoform detection and
estimation: good and bad news. BMC Bioinformatics, 2014. 15: p. 135.
5. Steijger, T., et al., Assessment of transcript reconstruction methods for RNA-seq. Nat Methods,
2013. 10(12): p. 1177-84.
6. Oikonomopoulos, S., et al., Benchmarking of the Oxford Nanopore MinION sequencing for
quantitative and qualitative assessment of cDNA populations. Sci Rep, 2016. 6: p. 31602.
7. Weirather, J.L., et al., Comprehensive comparison of Pacific Biosciences and Oxford Nanopore
Technologies and their applications to transcriptome analysis. F1000Res, 2017. 6: p. 100.
8. Byrne, A., et al., Nanopore long-read RNAseq reveals widespread transcriptional variation
among the surface receptors of individual B cells. Nature Communications, 2017. 8: p. 16027.
9. Clark, M., et al., Long-read sequencing reveals the splicing profile of the calcium channel gene
CACNA1C in human brain. bioRxiv, 2018.
10. Liu, H., et al., A high-quality annotated transcriptome of swine peripheral blood. BMC Genomics,
2017. 18(1): p. 479.
11. Singh, N., et al., IsoSeq analysis and functional annotation of the infratentorial ependymoma
tumor tissue on PacBio RSII platform. Meta Gene, 2016. 7: p. 70-5.
12. Mavragani-Tsipidou, P., et al., Mitotic and polytene chromosome analysis in Dacus oleae
(Diptera: Tephritidae). Genome, 1992. 35(3): p. 373-8.
13. Tsoumani, K.T. and K.D. Mathiopoulos, Genome size estimation with quantitative real-time PCR
in two Tephritidae species: Ceratitis capitata and Bactrocera oleae. Journal of Applied
Entomology, 2011. 136(8): p. 626-631.
14. Bayega, A., et al., Transcript Profiling Using Long-Read Sequencing Technologies. Methods Mol
Biol, 2018. 1783: p. 121-147.
15. Koren, S., et al., Canu: scalable and accurate long-read assembly via adaptive k-mer weighting
and repeat separation. Genome Res, 2017. 27(5): p. 722-736.
16. Abdel-Ghany, S.E., et al., A survey of the sorghum transcriptome using single-molecule long
reads. Nat Commun, 2016. 7: p. 11706.
17. Wu, T.D. and C.K. Watanabe, GMAP: a genomic mapping and alignment program for mRNA and
EST sequences. Bioinformatics, 2005. 21(9): p. 1859-75.
18. Tardaguila, M., et al., SQANTI: extensive characterization of long-read transcript sequences for
quality control in full-length transcriptome identification and quantification. Genome Res, 2018.
19. Gao, Y., et al., PRAPI: post-transcriptional regulation analysis pipeline for Iso-Seq. Bioinformatics,
2018. 34(9): p. 1580-1582.
20. Sagri, E., et al., Housekeeping in Tephritid insects: the best gene choice for expression analyses in
the medfly and the olive fly. Sci Rep, 2017. 7: p. 45634.
21. FlyBase--the Drosophila database. The FlyBase Consortium. Nucleic Acids Res, 1994. 22(17): p.
3456-8.
22. Tadros, W. and H.D. Lipshitz, The maternal-to-zygotic transition: a play in two acts.
Development, 2009. 136(18): p. 3033.
14bioRxiv preprint first posted online Nov. 24, 2018; doi: http://dx.doi.org/10.1101/478172. The copyright holder for this preprint
(which was not peer-reviewed) is the author/funder, who has granted bioRxiv a license to display the preprint in perpetuity.
It is made available under a CC-BY-NC-ND 4.0 International license.
23. Langley, A.R., et al., New insights into the maternal to zygotic transition. Development, 2014.
141(20): p. 3834-41.
24. Feng, J., et al., GFOLD: a generalized fold change for ranking differentially expressed genes from
RNA-seq data. Bioinformatics, 2012. 28(21): p. 2782-8.
25. Fu, S., et al., Transcriptome analysis of sweet orange trees infected with 'Candidatus Liberibacter
asiaticus' and two strains of Citrus Tristeza Virus. BMC Genomics, 2016. 17: p. 349.
26. Eisen, M.B., et al., Cluster analysis and display of genome-wide expression patterns. Proc Natl
Acad Sci U S A, 1998. 95(25): p. 14863-8.
27. Walker, M.G., et al., Prediction of gene function by genome-scale expression analysis: prostate
cancer-associated genes. Genome Res, 1999. 9(12): p. 1198-203.
28. McDowell, I.C., et al., Clustering gene expression time series data using an infinite Gaussian
process mixture model. PLoS Comput Biol, 2018. 14(1): p. e1005896.
29. Penalva, L.O. and L. Sanchez, RNA binding protein sex-lethal (Sxl) and control of Drosophila sex
determination and dosage compensation. Microbiol Mol Biol Rev, 2003. 67(3): p. 343-59, table
of contents.
30. Lagos, D., et al., The transformer gene in Bactrocera oleae: the genetic switch that determines its
sex fate. Insect Mol Biol, 2007. 16(2): p. 221-30.
31. Lagos, D., et al., Isolation and characterization of the Bactrocera oleae genes orthologous to the
sex determining Sex-lethal and doublesex genes of Drosophila melanogaster. Gene, 2005. 348: p.
111-21.
32. Stenpani R. N. D., S.D., and Perondini A. L. P, Early developmental stages of Ceratitis capitata
embryos, in Proceedings of the 6th International symposium on fruit flies of economic
importance 6-10 May 2002, B.B. N., Editor. 2004, Isteg Scientific Publications, Irene, South
Africa: Stellenbosch, South Africa. p. 55-58.
33. Papanicolaou, A., et al., The whole genome sequence of the Mediterranean fruit fly, Ceratitis
capitata (Wiedemann), reveals insights into the biology and adaptive evolution of a highly
invasive pest species. Genome Biology, 2016. 17(1): p. 192.
34. Pavlidi, N., et al., Analysis of the Olive Fruit Fly Bactrocera oleae Transcriptome and Phylogenetic
Classification of the Major Detoxification Gene Families. PLoS One, 2013. 8(6): p. e66533.
35. De Renzis, S., et al., Unmasking activation of the zygotic genome using chromosomal deletions in
the Drosophila embryo. PLoS Biol, 2007. 5(5): p. e117.
36. GENÇ, H., Embryonic development of the olive fruit fly, Bactrocera oleae Rossi (Diptera:
Tephritidae), in vivo. Turkish Journal of Zoology, 2014. 38: p. 598-602.
37. Benoit, P., et al., PAP- and GLD-2-type poly(A) polymerases are required sequentially in
cytoplasmic polyadenylation and oogenesis in Drosophila. Development, 2008. 135(11): p. 1969-
79.
38. Cui, J., et al., Wispy, the Drosophila homolog of GLD-2, is required during oogenesis and egg
activation. Genetics, 2008. 178(4): p. 2017-29.
39. Cui, J., et al., Cytoplasmic polyadenylation is a major mRNA regulator during oogenesis and egg
activation in Drosophila. Dev Biol, 2013. 383(1): p. 121-31.
40. Handler, A.M., A current perspective on insect gene transformation. Insect Biochem Mol Biol,
2001. 31(2): p. 111-28.
41. Fuchs, S., T. Nolan, and A. Crisanti, Mosquito Transgenic Technologies to Reduce Plasmodium
Transmission.
42. Kyrou, K., et al., A CRISPR-Cas9 gene drive targeting doublesex causes complete population
suppression in caged Anopheles gambiae mosquitoes. Nat Biotechnol, 2018.
43. Riparbelli, M.G., G. Callaini, and R. Dallai, Primordial germ cell migration in the Ceratitis capitata
embryo. Tissue Cell, 1996. 28(1): p. 99-105.
15bioRxiv preprint first posted online Nov. 24, 2018; doi: http://dx.doi.org/10.1101/478172. The copyright holder for this preprint
(which was not peer-reviewed) is the author/funder, who has granted bioRxiv a license to display the preprint in perpetuity.
It is made available under a CC-BY-NC-ND 4.0 International license.
44. Salmela, L. and E. Rivals, LoRDEC: accurate and efficient long read error correction.
Bioinformatics, 2014. 30(24): p. 3506-14.
45. Kirschneck, C., et al., Valid gene expression normalization by RT-qPCR in studies on hPDL
fibroblasts with focus on orthodontic tooth movement and periodontitis. Sci Rep, 2017. 7(1): p.
14751.
Tables and Figures
Table 1: Summary of the long-read genome guided de novo transcriptome assembly generated.
The assembly was generated from full-length Canu[15] consensus corrected and Lordec[44] short-
read corrected reads using Cupcake ToFU* tool. The full-length reads used included embryo and
adult male and female heads. The transcriptome assembly was analyzed using SQANTI[18].
Gene Classification
Total
Genes 11,883 Annotated 8,330
Total
Isoforms 79,810 Novel Genes 3,553
Genic Genic
FSM ISM NIC NNC Genomic Antisense Fusion Intergenic intron
No.
Isoforms 25,680 13,569 7,547 18,146 6,236 671 662 6,004 1,295
Isoform categories FSM; full splice match, ISM; incomplete splice match, NIC; novel in catalogue, NNC;
novel not in catalogue (see Supplementary Table 6 for explanation).
*(https://github.com/Magdoll/cDNA_Cupcake/wiki/Cupcake-ToFU%3A-supporting-scripts-for-
Iso-Seq-after-clustering-step)
16bioRxiv preprint first posted online Nov. 24, 2018; doi: http://dx.doi.org/10.1101/478172. The copyright holder for this preprint
(which was not peer-reviewed) is the author/funder, who has granted bioRxiv a license to display the preprint in perpetuity.
It is made available under a CC-BY-NC-ND 4.0 International license.
Figure 1: Exploration of the transcriptome assembly. A) Schematic of cDNA library generation
and sequencing. Embryos were collected at hourly point post oviposition (hpo), counted and total
RNA extracted using the Trizol method. At cDNA synthesis step, external RNA standards (ERCC)
were added to each sample commensurate to the number of embryos that were used. The Smart-
Seq2 protocol was used to generate full length cDNA, followed by PCR amplification of the
cDNA. The Oxford Nanopore Technologies (ONT) SQK-LSK108 protocol for library preparation
was then followed, albeit with some custom changes. The library was then sequenced on the ONT
MinION, followed by basecalling using ONT Albacore basecaller. B) Distribution of top blastp
17bioRxiv preprint first posted online Nov. 24, 2018; doi: http://dx.doi.org/10.1101/478172. The copyright holder for this preprint
(which was not peer-reviewed) is the author/funder, who has granted bioRxiv a license to display the preprint in perpetuity.
It is made available under a CC-BY-NC-ND 4.0 International license.
hits to Uniprot-Swiss prot database. C) Distribution of isoform among NCBI annotated genes and
Novel genes D) Gene expression levels of annotated and novel genes using long-read counts. C)
Transcript length distribution by structural classification. E) Distribution of transcripts among
structural categories (SQANTI[18]). FSM; full splice match, ISM; incomplete splice match, NIC;
novel in catalogue, NNC; novel not in catalogue (see Supplementary Table 6 for explanation).
Figure 2: Comparison of relative and absolute normalization. A) Relative gene expression of
ERCC 00130 (blue) and gene8461 (red) as obtained from Mandalorion software[8]. For each gene
Mandalorion reports its quantification as reads per gene per 10000 mapped reads (RPG10K). B)
Same as ‘A’ but showing absolute gene expression levels per embryo. C) Summed RPG10K for
each timepoint D) Same as C but showing total number of transcripts per embryo across the six
timepoints following absolute normalization.
18bioRxiv preprint first posted online Nov. 24, 2018; doi: http://dx.doi.org/10.1101/478172. The copyright holder for this preprint
(which was not peer-reviewed) is the author/funder, who has granted bioRxiv a license to display the preprint in perpetuity.
It is made available under a CC-BY-NC-ND 4.0 International license.
Figure 3: Validation of absolute normalisation. A) Total mRNA (ng) of the embryo across
timepoints derived from conversion of transcript molecules to nanograms. B) Absolute gene
expression of 3 genes proposed by Sagri et al.[20] as candidate housekeeping genes (14.3.3.zeta,
GAPDH, RPL19). C) Absolute expression (blue) and qPCR expression (red) of HID. qPCR
expression values were multiplied by a scaling factor. D) Same as C but for SRY.
19bioRxiv preprint first posted online Nov. 24, 2018; doi: http://dx.doi.org/10.1101/478172. The copyright holder for this preprint
(which was not peer-reviewed) is the author/funder, who has granted bioRxiv a license to display the preprint in perpetuity.
It is made available under a CC-BY-NC-ND 4.0 International license.
Figure 4: Principal component analysis (PCA) analysis of early embryo development of B.
oleae (red), D. melanogaster (green), and C. capitata (blue). PCA was performed using the 100
most variable genes. For each organism the individual points are labelled with the corresponding
scientific name initials and the hours post oviposition (Bo_1h for example refers to B. oleae 1 hour
post oviposition). Data for D. melanogaster was downloaded from the FlyBase.
20bioRxiv preprint first posted online Nov. 24, 2018; doi: http://dx.doi.org/10.1101/478172. The copyright holder for this preprint
(which was not peer-reviewed) is the author/funder, who has granted bioRxiv a license to display the preprint in perpetuity.
It is made available under a CC-BY-NC-ND 4.0 International license.
Figure 5: Hierarchical clustering of B. oleae embryo timepoints. Clustering was done based on
the 100 most variable genes from the 6 different experimental time points. For comparison the
gene expression data from the C. capitata at 5 hpo and 6 hpo developmental time points were also
included in the hierarchical clustering analysis.
21bioRxiv preprint first posted online Nov. 24, 2018; doi: http://dx.doi.org/10.1101/478172. The copyright holder for this preprint
(which was not peer-reviewed) is the author/funder, who has granted bioRxiv a license to display the preprint in perpetuity.
It is made available under a CC-BY-NC-ND 4.0 International license.
Figure 6: Gene set enrichment analysis of B. oleae gene in 3 categories. Gfold[24] was used to
perform differential gene expression across the 6 timepoints. A Gfold value of 0.5 was used to
identify 2 categories: Maternal degraded (Gfold >0.5 for 1 hpo versus 2 hpo) and Maternal stable
(-0.50.5 for all timepoints). For Zygotic, we identified genes whose expression was
detectable at any other timepoint except 1 hpo hpo: hours post oviposition. A) Schematic
representation of expression profiles for each of the categories. B) Clustering of gene-set
enrichment categories based on the most p-value.
22bioRxiv preprint first posted online Nov. 24, 2018; doi: http://dx.doi.org/10.1101/478172. The copyright holder for this preprint
(which was not peer-reviewed) is the author/funder, who has granted bioRxiv a license to display the preprint in perpetuity.
It is made available under a CC-BY-NC-ND 4.0 International license.
Figure 7: Clustered trajectories of expressed genes across the early embryonic development
of B. oleae. We used DPGP software[45] to cluster genes according to their temporal expression
profile. Out of the 87 clusters returned by DPGP we identified 3 groups of general profiles; early
expressed genes (A), stably expressed genes (B and C), and late expressed genes (D). The figures
shown here are only samples to show the pattern of expression among the categories we identified.
See Supplementary materials for all the clusters.
23bioRxiv preprint first posted online Nov. 24, 2018; doi: http://dx.doi.org/10.1101/478172. The copyright holder for this preprint
(which was not peer-reviewed) is the author/funder, who has granted bioRxiv a license to display the preprint in perpetuity.
It is made available under a CC-BY-NC-ND 4.0 International license.
Figure 8: IGV screenshot showing either read alignments to double sex (DSX) gene or
isoform models for the DSX gene. Panel A: Short-read Illumina coverage of the 5-hour time
point. Panel B - D: ONT sequencing of bulk embryos at 1, 5, 6 hours post oviposition, respectively.
Panel E and F: ONT sequencing of female and male adult heads, respectively. Panel G: Male and
female specific DSX cDNA as generated by Lagos et al.[30], showing uniform splicing between
male and female. H: NCBI predicted gene model for DSX.
24You can also read