What do large-scale patterns teach us about extreme precipitation over the Mediterranean at medium- and extended-range forecasts?
←
→
Page content transcription
If your browser does not render page correctly, please read the page content below
What do large-scale patterns teach us about extreme precipitation
over the Mediterranean at medium- and extended-range forecasts?
Nikolaos Mastrantonas (1, 2), Linus Magnusson (1), Florian Pappenberger (1), and Jörg Matschullat (2)
(1) European Centre for Medium-Range Weather Forecast (ECMWF), United Kingdom; (2) Technische
Universität Bergakademie Freiberg (TUBAF), Germany

Corresponding author: Nikolaos.Mastrantonas@ecmwf.int

THIS WORK HAS BEEN SUBMITTED TO THE QUARTERLY JOURNAL OF ROYAL METEOROLOGICAL SOCIETY.
THE WORK HAS NOT YET BEEN PEER-REVIEWED AND IS PROVIDED BY THE CONTRIBUTING AUTHOR(S) AS
A MEANS TO ENSURE TIMELY DISSEMINATION OF SCHOLARLY AND TECHNICAL WORK ON A
NONCOMMERCIAL BASIS. COPYRIGHT IN THIS WORK MAY BE TRANSFERRED WITHOUT FURTHER NOTICE.

Abstract
Extreme Precipitation Events (EPEs) can have devastating consequences such as floods and landslides,
posing a great threat to society and economy. Predicting such events long in advance can support the
mitigation of negative impacts. Here, we focus on EPEs over the Mediterranean, a region that is
frequently affected by such hazards. Previous work identified strong connections between localised
EPEs and large-scale atmospheric flow patterns, affecting weather over the entire Mediterranean. We
analyse the predictive skill of these patterns in the ECMWF extended range forecasts and assess if and
where these patterns can be used for indirect predictions of EPEs, using the Brier Skill Score.
The results show that the ECMWF model provides skilful predictions of the Mediterranean patterns
up to 2 weeks in advance. Moreover, using the forecasted patterns for indirect predictability of EPEs
outperforms the reference score up to ~10 days lead time for many locations. Especially for high
orography locations or coastal areas, like parts of western Turkey, western Balkans, Iberian Peninsula
and Morocco this limit extends to 11–14 days lead time.
This study demonstrates that connections between localised EPEs and large-scale patterns over the
Mediterranean extends the forecasting horizon of the model by over 3 days in many locations, in
comparison to forecasting based on the predicted precipitation. Thus, it is beneficial to use the
predicted patterns rather than the predicted precipitation at longer lead times for EPEs forecasting.
The model’s performance is also assessed from a user perspective, showing that the EPEs forecasting
based on the patterns increases the economic benefits at medium/extended range lead times. Such
information could support higher confidence in the decision-making of various users, e.g., the
agricultural sector and (re)insurance companies.

Key words: Mediterranean, extreme precipitation, weather regimes, large-scale/circulation patterns,
forecasting, sub-seasonal
1. Introduction
Extreme Precipitation Events (EPEs) pose a great threat to society, economy, and the environment,
with consequences like landslides and floods (Jonkman, 2005). Especially for locations in the
Mediterranean, this threat is one of the most crucial and frequent natural hazards, resulting in high
economic losses, injuries, and casualties (Llasat et al., 2013, 2010). Being able to better predict when
and where such events are expected to occur can support the mitigation of their negative impacts.
This is becoming more crucial in the light of non-stationary climate (e.g. Hannaford et al., 2021) and
ongoing climate change, resulting in the intensification of frequency and magnitude of such extremes
in many locations (e.g. Alexander et al., 2006; Cardell et al., 2020; Kostopoulou and Jones, 2005;
Papalexiou and Montanari, 2019; Toreti et al., 2013). An outcome that can be attributed to the
increased temperatures of the planet, which lead, in agreement with the Clausius-Clapeyron
relationship, to increased water vapour (Douville and John, 2020) and therefore to increased
precipitation.

Recently, there is an ever increasing scientific and operational interest on sub-seasonal predictability
of atmospheric variability and weather extremes, meaning from 10–15 days up to 2–3 months in
advance. Such interest is driven not only by the needs of various sectors and users (e.g. agriculture,
(re)insurance companies, emergency response units; White et al., 2017), but also by advancing
Numerical Weather Prediction (NWP) models and related research (Magnusson and Källén, 2013),
providing skilful information about atmospheric variability at longer lead times. An example is the skill
of models in predicting atmospheric variability in the middle troposphere over the northern
hemisphere, which has increased by about 1 day per decade (Bauer et al., 2015). The ECMWF model,
for example, is now predicting weather variability 10 days in advance as well as it was predicting this
variability 7 days in advance 30 years ago (relevant plot available at
https://www.ecmwf.int/en/forecasts/charts/catalogue/plwww_m_hr_ccaf_adrian_ts).

Nevertheless, challenges remain at the sub-seasonal predictability of weather conditions, especially
for surface extremes at fine spatiotemporal resolutions. Thus, there is ongoing interest in assessing
and quantifying if and how other variables of higher forecasting reliability, can be used for indirectly
informing about extremes at medium- and extended-range forecasts (Magnusson, 2019). Such a
variable of reliable forecasting skill at the sub-seasonal scale, is the atmospheric flow variability at the
lower and middle troposphere, usually depicted by large-scale patterns over extended domains
(Lavaysse et al., 2018; Vitart, 2014). Many recent studies have analysed these interactions between
surface conditions and such atmospheric variables (e.g. cold spells and geopotential height at 500 hPa:
Ferranti et al., 2018; wind power and geopotential height at 500 hPa: Grams et al., 2017; wind
extremes and geopotential height at 500 hPa: Thomas et al., 2021; precipitation and weather patterns
generated from multiple variables: Hoy et al., 2014).

One of the most challenging variables is precipitation; not only regarding its accurate forecasting
(Sukovich et al., 2014), but also in terms of correct spatial representation of the observational data
(e.g. Khairul et al., 2018; Mastrantonas et al., 2019). This variable is of immense importance for many
applications and users. In this regard, previous studies demonstrate the strong association of large-
scale atmospheric flow patterns to precipitation and localized EPEs. Such diagnostic studies are, for
example, conducted for locations in the Mediterranean, India and the UK (Grazzini et al., 2020; Merino
et al., 2016; Neal et al., 2020; Richardson et al., 2018; Toreti et al., 2016, 2010; Xoplaki et al., 2012,
2004). These patterns can be used as prognostic tool for extremes and provide skilful predictions of
surface weather variability at longer lead times. In a recent study, it was shown that UK-specific large-
scale patterns can support the predictability of extreme rainfall at medium-range forecasts
(Richardson et al., 2020b). The same patterns have also been used to infer information about the
likelihood of coastal flooding (Neal et al., 2018) and of droughts (Richardson et al., 2020a) at medium-
and extended-range lead times. Similar analysis is also implemented for other locations and domains,
e.g., for Europe. For the latter, weather analogues of atmospheric variability over Europe have been
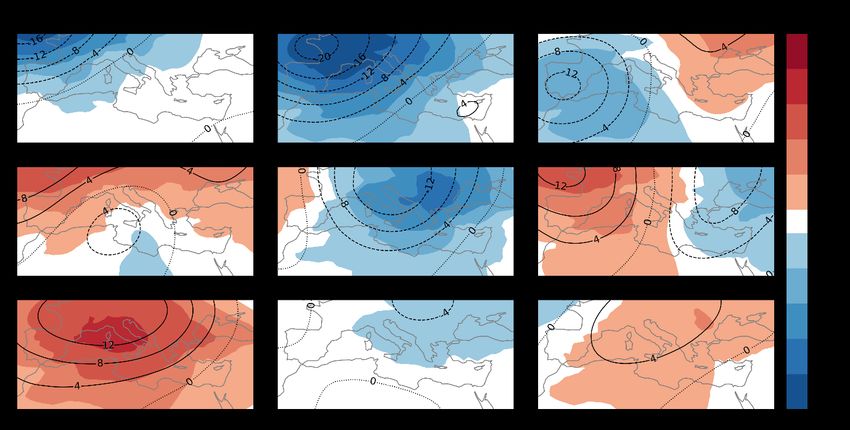
used to infer information about precipitation (and temperature) at sub-seasonal scales (Krouma et al.,
2021; Yiou and Déandréis, 2019).

We build upon previous research that quantified the EPE connections over the Mediterranean to
large-scale atmospheric flow patterns, specifically designed over the domain (Mastrantonas et al.,
2021). These patterns, presented in Figure 1, are significantly associated with localised EPEs, with each
of them being the preferential EPE pattern at different regional subdomains. The patterns represent
distinct atmospheric variability over the domain. They indicate negative anomalies over the western
Mediterranean (Atlantic/Biscay/Iberian Low), and the eastern Mediterranean (Balkan/Black Sea Low),
positive anomalies over the whole domain (Mediterranean High), or, finally, non-anomalous
conditions over the entire domain (Minor High, Minor Low). That study showed that the preferential
pattern at each location has a conditional EPE probability that is over 3 times higher than the nominal
EPE probability for most locations; a connection that is even stronger for coastal areas and high
orography locations.

Figure 1 The 9 Mediterranean patterns (Mastrantonas et al., 2021). The figure presents the composites of clusters derived
with K-means clustering on the principal components’ projections of SLP and Z500 anomalies. Colour shading refers to SLP
anomalies (hPa), and contours to Z500 anomalies (dam). Percentages indicate the climatological frequencies of each cluster.
This figure incorporates the modifications introduced in the current study (methodology section). The differences from the
original patterns and their frequencies (Fig. 5 in Mastrantonas et al., 2021), are negligible.

Based on these previous findings, this study aims at analysing the predictability of these patterns and
at quantifying, if and where the predicted patterns can be used to indirectly infer useful information
about EPEs. The key research questions that this study addresses are:

 • What is the skill of ECMWF state-of-the-art NWP model at predicting large-scale variability
 over the Mediterranean at medium- and extended-range forecast scales?
 • Are there systematic biases for different lead-times, seasons and patterns?
 • Can forecasting of these patterns provide useful information about the indirect predictability
 of EPEs over the Mediterranean at medium- and extended-range forecasts?

The remaining part of this study is organized as follows: Data and methods used are described in
sections 2 and 3, respectively. Section 4 presents the results and discusses the findings, and section 5
summarizes the main conclusions and suggests possible pathways for future research.

2. Data
As reference dataset, we used ERA5 (Hersbach et al., 2020), the latest reanalysis dataset of ECMWF
for the years 1979–2020, with complete data record. ERA5 provides data at hourly resolution in a
horizontal grid of roughly 30 km x 30 km, using 137 vertical levels from the surface up to 80 km height
to resolve the atmosphere. The atmospheric variables used in this study are: Total precipitation, sea
level pressure (SLP), and geopotential height at 500 hPa (Z500). We aggregated the data to daily
resolution by summing the hourly data of the extensive variables (precipitation) and averaging the
hourly data of the intensive variables (SLP, Z500).

Total precipitation was analysed at a horizontal resolution of 0.25o x 0.25o to derive statistical
information of EPEs at fine spatial scales, with the selected domain covering the area 27o/48oN and
10o/41oE, referred to as Mediterranean from now on. Although reanalysis data have challenges in
accurately representing EPE magnitudes, previous analysis has shown that ERA5 is reliable in
representing EPE timing over the Mediterranean (Mastrantonas et al., 2021). Thus, given its high
spatial coverage and consistency throughout the domain, it can be considered an informative source
for this study. For SLP and Z500, the selected horizontal resolution was 1o x 1o; the domain covered
the area 26o/50oN and -11o/41oE, so that the analysis captures the influence of adjacent areas to the
Mediterranean, e.g., Atlantic Ocean and Alps.

The forecasting product used is the ECMWF extended range product (Owens and Hewson, 2018),
which is run twice/week (Mondays and Thursdays) and provides information from 0 up to 46 days lead
time. We used all available data produced with cycle 46r1, with the initiation dates extending between
11 June 2019 and 30 June 2020 (110 dates in total), to provide consistency in model physics and
parametrization schemes. As we were interested in long-term statistical analysis, we made use of the
reforecasts of these dates. Each reforecast provides ensemble data of 1 control and 10 perturbed
members, for the same day-month as the actual forecasts but from 1 up to 20 years in the past. Thus,
the total dataset used, consisted of 2,200 initiation dates per lead-time (20 years of reforecasts X 110
dates), with each date having 11 ensemble members. The terms “reforecasts” and “forecasts” are
used interchangeably for the remaining sections and refer to the ECMWF reforecasts. The selected
horizontal resolutions and domains of the three variables are the same as with ERA5. The daily values
used for the analysis were derived by considering two timesteps, the 00:00 UTC of the date of interest,
and 00:00 UTC of the following date.

3. Methodology
a. Large-scale patterns
The large-scale patterns in this study were derived by Mastrantonas et al. (2021), using the ERA5 data
between 1979–2019. The analysis was based on Empirical Orthogonal Function (EOF) and subsequent
K-means clustering of the daily SLP and Z500 anomalies. The necessary number of modes (principal
components) from EOF analysis that explain at least 90% of the total variance was kept, meaning 7
and 6 for SLP and Z500, respectively. Each day was allocated to one of nine clusters, whose composites
represent the nine Mediterranean patterns. Domain and variables used for generating the patterns,
as well as the number of clusters, were selected so that the derived patterns have a strong association
with localized EPEs over the Mediterranean and exhibit distinct synoptic-scale features over the
domain. More information about the exact methodology is available at the relevant paper.

Here, we introduced a small refinement compared to Mastrantonas et al. (2021), so that the patterns
can be used for operational purposes. Each day is allocated to the pattern with the minimum
aggregated Euclidian distance from the 9 composites, considering the distances of both SLP and Z500.
For each day, there are 9 Euclidian distances from the composites based on SLP, and 9 distances based
on Z500. The timeseries of these distances for all ERA5 daily data between 1979–2019 were
normalized for each variable by dividing with the mean distance of each variable from the whole
dataset. Then, the aggregated Euclidian distance was calculated for each day by averaging the
normalized Euclidian distances from SLP and Z500 composites. It should be noted that similar methods
for allocating daily forecasts to predefined patterns based on minimum Euclidian distance is a practice
implemented for other weather regimes, too, especially operationally, e.g., the 4 EuroAtlantic regimes
at ECMWF (Ferranti et al., 2015), and the 30 regimes used by the Met Office (MO30; Neal et al., 2016).
This method gave an initial overlap of 97% with the allocations based on the K-means clustering,
indicating that both methods provide almost identical results.

b. Connections of large-scale patterns to extreme precipitation
The connection between patterns and EPEs was quantified with the conditional probability of
observing EPEs at each grid cell given each of the nine patterns. We analysed the conditional
probabilities of 90th, 95th, and 99th percentile extremes (P90, P95, P99 respectively) considering full-
year statistics for the period 1979–2020. Due to the high seasonal variation of the pattern frequencies,
we also apply half-year statistics, with summer-halves referring to 16 April – 15 October (including
both dates), and winter-halves the remaining dates, respecting the patterns’ climatology (Fig. 2). Note
that EPEs are always derived based on full-year statistics; the only difference is that the conditional
probabilities are refined to winter- and summer-halves in addition to the pattern conditioning. Finer
subsetting (e.g., seasonal) was not implemented, as the sample size for some patterns became too
small, and conditional probabilities had high fluctuations (a conclusion derived after implementing
bootstrapping).

Figure 2 91-day running mean calendar day climatological relative frequency of the 9 Mediterranean patterns. The dates of
the summer-half (16 April – 15 October, inclusive of both dates) and winter-half (remaining days) periods were selected, so
that the patterns’ climatology is respected.

To assess the discriminatory skill of inferring information about EPEs given the allocated pattern, the
Brier Score (BS; Bouallègue et al., 2019; Wilks, 2011) was used. Each day was assigned an EPE
probability at each grid cell equal to the conditional probability of the relevant pattern. The analysis
was implemented for both full-year and winter-/summer-half statistics. This score was compared
(Brier Skill Score; BSS) with a reference score of inferring information about EPEs based on the
climatological EPE occurrence. More specifically, we used a seasonal climatology and a 31-days
moving-window (centered at the date of interested) climatological occurrence of EPEs. We considered
the minimum of both as the reference score. This discriminatory skill informs about if, in which
locations, and how much, the use of large-scale patterns for informing about EPEs can outperform the
reference score if we had a perfect forecast of the Mediterranean patterns.

c. Skill of the ECMWF model
Initially, the model anomalies were derived after subtracting the lead-time dependent model
climatology. These anomalies were used for allocating each day to one of the nine Mediterranean
patterns, based on the minimum aggregated Euclidian distance, as in ERA5. The SLP and Z500 Euclidian
distances of the reforecasts were normalized by dividing with the previously calculated ERA5 1979–
2019 mean distance of each variable. As each reforecast day is allocated to one of the nine patterns,
the BS was used to assess the performance of the model in predicting the patterns. The results were
compared with the minimum of two reference scores; the BS based on 91-days moving window
climatology (centered at the date of interest), and the BS based on half-year transition probabilities
(Markov chain). Moreover, the long-term frequencies of the patterns for each lead time were
compared with the frequencies of these dates based on ERA5 data for assessing possible biases in
pattern allocations of the ECMWF model. To assess the results’ significance, we used bootstrapping
of 1,000 resamples with replacement, each of them having 2,200 dates (as the size of actual sample).
We considered 90% two-tailed confidence interval for the frequencies, and 90% one-tailed confidence
interval for BSS. We also performed the analysis independently for winter- and summer-halves. Block-
bootstrapping was not used, although it is of importance due to the high temporal correlation of the
atmospheric variables. This is because the ECMWF extended-range reforecasts are not produced daily,
but twice per week.

The skill of the model in predicting EPEs (P90, P95, P99) was assessed also based on BS. We calculated
the direct BS for EPEs when considering the model-predicted precipitation, and the indirect BS when
addressing the model-predicted patterns and their connections to EPEs. The latter was derived by
substituting each predicted pattern with the relevant conditional probabilities for EPEs at each grid
cell. As each reforecast has 11 members, the final conditional probabilities used for the indirect BS
were the average of all 11 members at each grid cell. Thus, the maximum forecast probability that can
be provided with the indirect method is the maximum conditional probability of EPEs, which occurs
when all ensemble members indicate the most preferential pattern for EPEs at a specific grid cell. Note
that the conditional probabilities of EPEs given the patterns (and the climatological occurrences) were
derived based on the overall 1979–2020 ERA5 data. To assess the significance of the results (BSS>0),
we used bootstrapping of 1,000 resamples with replacement and considered 90% one-tailed
confidence interval. To obtain a larger sample of data at each bootstrap (the actual set had 2,200 at
each lead time), and to respect the full-year statistics that EPEs are based on, each resample had 3,000
dates, with climatologically stable number of winter, spring, summer, and autumn days (741, 756, 756,
747 days respectively). For each resample, we finally calculated the BS for EPEs, given a perfect
forecast of the patterns, so we could assess the statistical significance of the discriminatory skill
presented in the previous section of the methodology.

d. Relative economic value of forecasts
One way to look at the forecasts’ skill from a user perspective, is to calculate the relative Economic
Value (EV) of the forecasts. This indicator informs users about the economic benefits that could be
obtained by basing the decision on the outputs of a forecasting system rather than climatological
information. The EV is calculated for all possible cost-loss ratios of a preventing action, ranging from
0 to 1, so that any user can assess the usefulness of the system for their operational needs and
constraints. It is a function of the frequency of the studied event, its cost-loss ratio and the false-alarm
rate and hit rate, with the latter two referring to the skill of the forecasting model. For an ensemble
model, this value is in fact the maximum possible, when making optimal use of the model and selecting
the most appropriate probability threshold for converting the probabilistic forecast to dichotomous.
This threshold depends on the cost-loss ratio. Richardson (2000) provides a comprehensive analysis
about the complete sets of formulas and explanations for deriving this indicator. Here, we present the
main formula:
 −
 =
 −

EV follows the logic of a skill score with positive values indicating that the forecast brings larger
economic benefits compared to climatology. The upper limit is 1 and is achieved with a perfect
knowledge of the future. This formula was used for understanding the economic benefits of EPE
forecasting based on the ECMWF model; either direct forecasts, when considering the forecasted
precipitation, or indirect forecasts, when considering the forecasted patterns and their connections
to EPEs.
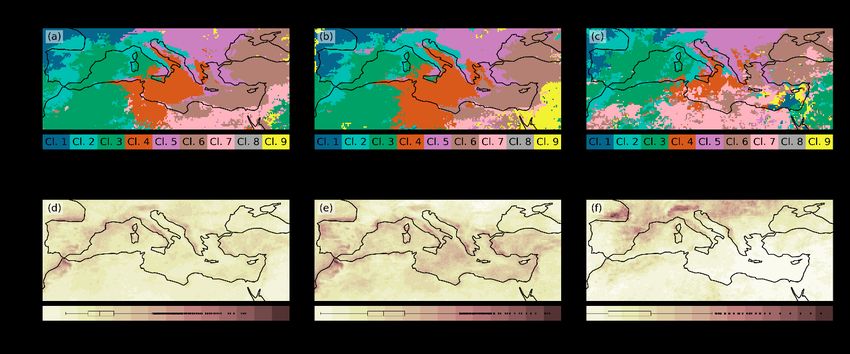
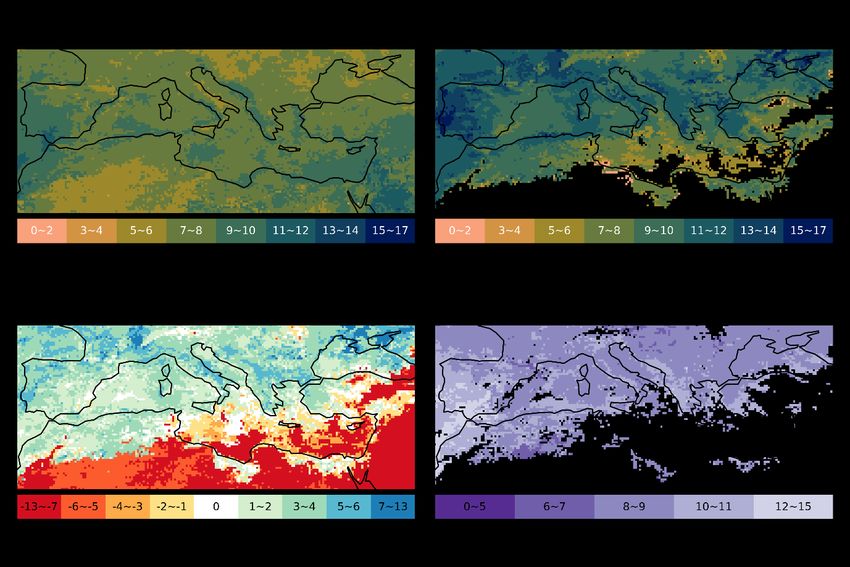
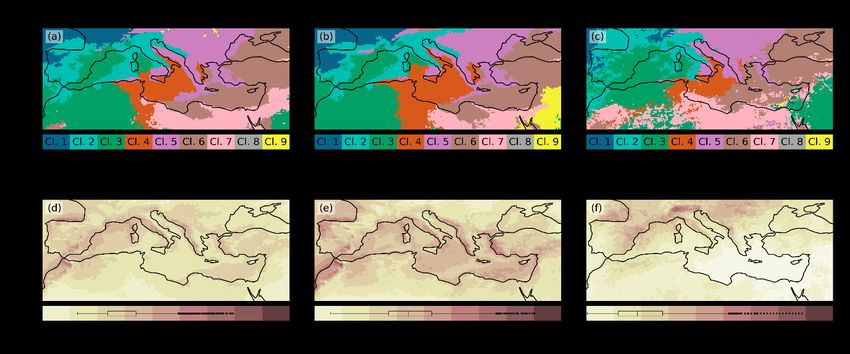
4. Results
Here, the results of P95 EPEs are presented, as they correspond to a good trade-off between extremity
and sample size. See the supplementary data for results on P90 and P99 EPEs.

Figure 3 presents the pattern that corresponds to the highest conditional probability of P95 EPEs for
each grid cell of the studied area. Results refer to the full-year statistics (1st column), and winter- and
summer-half subsetting (2nd and 3rd column respectively). As mentioned in the methodology, EPEs are
always derived based on full-year statistics; the only difference is that the conditional probabilities are
refined to winter- and summer-halves in addition to the pattern conditioning for the two latter
columns. This temporal subsetting is in fact supported by previous studies demonstrating that there
are different precipitation processes active in summer versus winter (e.g. Grazzini et al., 2021). In
general, each pattern is preferentially associated with EPEs at different subdomains. For example, the
Biscay Low is the main EPE pattern in parts of Morocco, Iberian Peninsula, France, Italy and western
Balkans, while the Black Sea Low mainly affects locations in Turkey. These results can be explained by
the air- and subsequent moisture-flow associated with each of the patterns’ composites (Fig. 1).
Results between the 3 temporal subsets do not vary much; the main differences are identified in the
Middle East. These differences are not that crucial for EPEs, as the associated probabilities are very
low for these locations and temporal subsets (Fig. 3, 2nd row), meaning that EPEs are generally not
expected in these periods and grid cells (in fact most EPEs over the domain occur in winter-halves;
Mastrantonas et al., 2021). In general, the conditional probabilities of EPEs, given the most
preferential pattern at each grid cell, are about 3 times higher compared to the climatological ones
(5 % for P95 EPEs). Especially for locations of high orography and coastal areas, this ratio is even higher
(~ 5 times). The half-year subsetting drives an increase of the conditional probabilities, as it takes the
temporal occurrence of EPEs into consideration. For most of the domain, the majority of EPEs occurs
in winter half years. Thus, the conditional probabilities are higher for this period. Summer half is the
preferential period for EPEs in north Balkans and Alps; thus, the conditional probabilities are higher
for that period for these two regions. Similar conclusions can be extracted for P90 and P99 EPEs (Figs.
S1, S2).

Figure 3 Connection of P95 EPEs and Mediterranean patterns. The 1st row presents the pattern of Maximum Conditional
Probability (MCP) at each grid cell; the 2nd row presents associated probabilities. The 1st column is based on full-year
conditional probabilities; the 2nd and 3rd are based on the half-year periods (winter- and summer-half years). Note that the
EPEs are always derived based on annual analysis. The boxplots at subplots (d)–(f) present the distribution of the conditional
probabilities for all grid cells, indicating the median value and extending from the lower to upper quartile. The whiskers extend
to the further available value up to 1.5*IQR from the lower and upper quartile; all other values outside this range are
presented as outliers.

Figure 3 presented the conditional probabilities for the preferential cluster. When using these 9
patterns for inferring information about EPEs, the discriminatory skill that can be derived for long-
term EPEs analysis is most interesting (Fig. 4 for the P95 EPEs). The left plot presents the BSS when
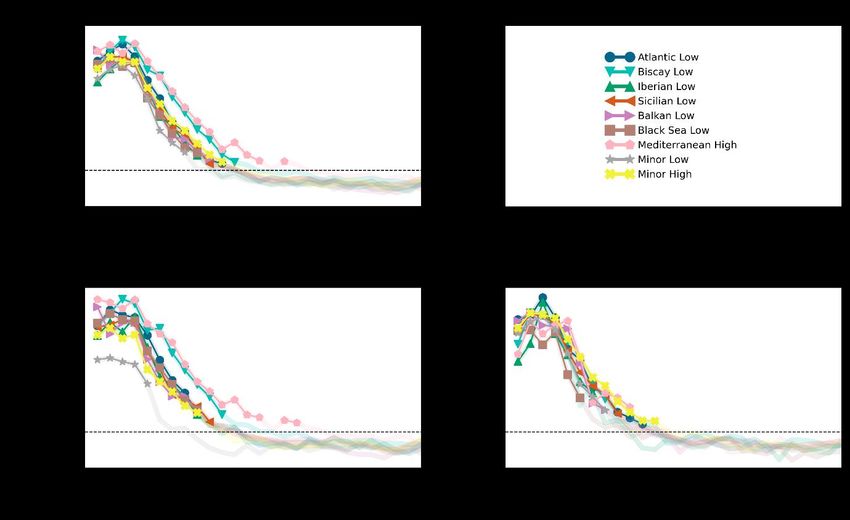
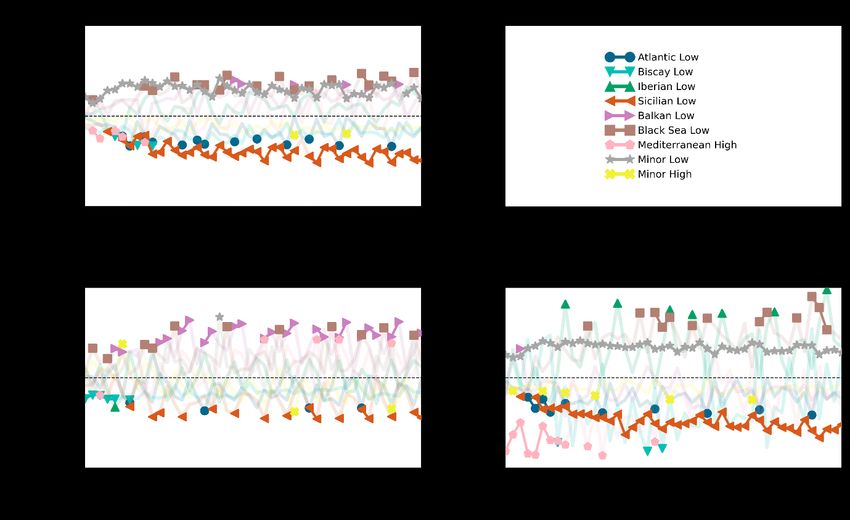
using full-year conditional probabilities. Results are masked and only present locations where the
discriminatory skill outperforms the reference score. In general, conditioning based on the patterns
beats the reference score in most locations except for the south-eastern Mediterranean, where EPEs
are very seasonal. When further refining the conditional probabilities, based on half-year temporal
subsetting (right subplot), the use of patterns outperforms reference score almost everywhere; for
most locations there is more than 2.5% increase in BSS. This is the best possible improvement given a
perfect knowledge (forecast) of the Mediterranean patterns. As with Figure 3, locations of high
orography and coastal areas have increased performance (over 7% skill increase). This can be
explained by the strong influence of topography in the EPE generation. A topography that can be
considered a “passive mechanism of forced convection”. The latter makes it more common to observe
EPEs under specific patterns and large-scale flows that direct air and moisture perpendicular to
orography. This is not true for locations over the sea and northern Africa, where topography is
generally smooth over large areas (except for Atlas Mountains). Northern Africa, moreover, lies under
the sinking air masses of the Hadley cell, which largely minimizes the formation of large-scale unstable
conditions. Thus, EPEs in these regions mostly show more localized drivers compared to the northern
Mediterranean. For the Middle East, the conditioning does not bring many benefits, as none of the 9
patterns is strongly related with EPEs over that domain. One reason is the Cyprus Low circulation that
drives many of the EPEs in that region (Toreti et al., 2010), and which is not identified by the 9 patterns,
due to its lower spatial extent on the studied domain (Mastrantonas et al., 2021). Similar conclusions
can be extracted for P90 and P99 EPEs (Figs. S3, S4). These figures show that the discriminatory skill
decreases with lower thresholds, which can be explained as follows: convective EPEs, which can be of
high magnitude and are thus very rare, are mainly driven by localized characteristics, meaning that
the association with large-scale patterns is not very strong.

Figure 4 Discriminatory skill (Brier Skill Score; BSS) to infer P95 EPEs, given the 9 Mediterranean patterns. Subplot (a) presents
the results when using annual conditional probabilities, and subplot (b) shows the results based on the patterns and
considering the half-year conditional probabilities (meaning 18 conditional probabilities in total: 9 patterns x 2 seasons;
winter-/summer-half). The subplots are masked and only present the areas where the discriminatory skill outperforms the
reference score (minimum of 31-day moving window climatological occurrence, and seasonal occurrence of EPEs). Boxplots
as in Figure 3, but only for non-masked grid cells.

So far, we presented the analysis of connecting EPEs and large-scale patterns based on reanalysis data.
The main interest of this work is the usefulness of these connections for medium- and extended-range
forecasts. Initially, Figure 5 presents the performance of the ECMWF model (BSS) in predicting the
nine patterns (median value of the bootstraps). The points, connected with bold lines, indicate that
the model significantly outperforms the reference scores (90% 1-tailed confidence interval). The
model performance is similar for all patterns and both temporal subsets, with a forecasting horizon of
about 11 days. The main difference is observed for the winter half and the patterns Mediterranean
High and Minor Low. The former has a forecasting horizon of over 2 weeks, while the latter is
constrained up to 5 days only. Biscay Low, a pattern highly associated with EPEs, is also more
predictable during winter half. These results agree with other studies that analyse pattern
predictability over other domains. Richardson et al. (2020b) showed that the ECWMF 51-member
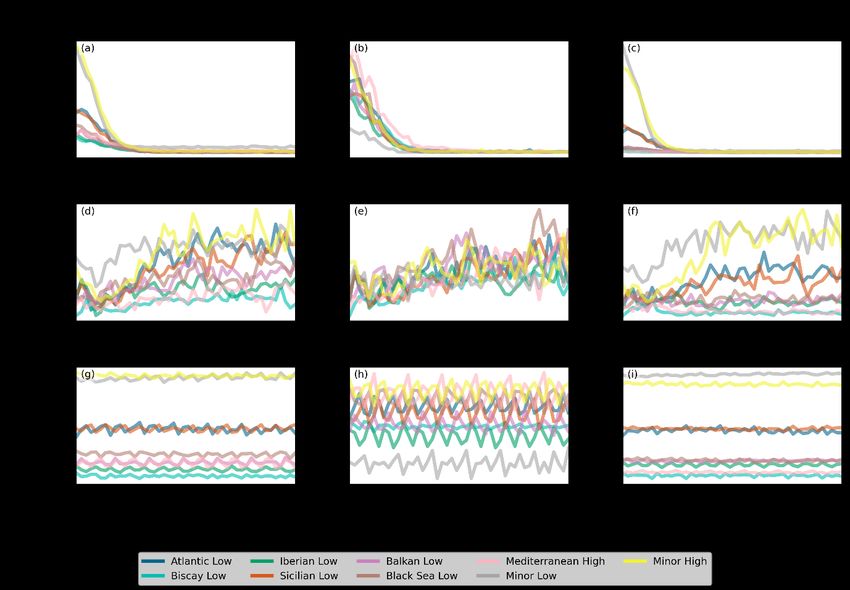
model has a predictability limit of about 15 days for the 8 UK-defined regimes, when analysing the
performance based on Brier Score and considering a 1-day flexibility window in the occurrence of the
patterns. Increased model skill is also observed in this study, when considering flexibility window in
the occurrence of the patterns (not shown). To obtain a more comprehensive understanding about
model performance, Figure S5 presents the decomposition of the Brier Score. The resolution saturates
at about 11 days lead time, while the reliability has high fluctuations, especially so in winter half and
annual statistics. These results also relate to the climatological pattern frequencies (Fig. 2), with high
impact on the uncertainty component of the BS decomposition.

Figure 5 Brier Skill Score (BSS) for the 9 Mediterranean patterns (median value of the bootstraps), considering the annual (a),
winter-half (b), and summer-half (c) periods. The points (connected with bold lines) indicate the lead times that the model
significantly outperforms the reference score.

Figure 6 presents the relative biases of the frequencies of the Mediterranean patterns for the ECMWF
reforecasts (median value of the bootstraps). As with Figure 5, values are presented with points (and
connected with bold lines), when biases are statistically significant (90% two-tailed confidence interval
this time). Even for short lead times, some patterns exhibit (significant) biases over 5%. One
explanation is that the patterns on ERA5 and ECMWF forecasts are derived from data with slightly
different configurations. The patterns on ERA5 are based on daily data derived by averaging hourly
data. On the other hand, for ECMWF reforecasts, as the data are not in hourly resolution for all lead
times, daily data were based on the average of only 2 values (start and end of day), meaning that a lot
of the 24-hours variability and convective activities during daytime are lost.

The main significant biases observed are an underestimation of the Sicilian Low and an overestimation
of the Minor Low. These biases are stable for all lead times and mainly occur in summer half. The
significant negative biases for the first few lead days of summer half for the Mediterranean pattern,
are mainly related to the very low frequency of this pattern during this period (Fig. 2). This leads to
high differences in percentages, with only a minor difference in the actual occurrences. During winter
half, there is also a consistent overestimation of the Balkan Low and Black Sea Low, mainly significant
for most lead times. Nevertheless, most biases (significant and non-significant) lie within the ±10%
band, especially for winter. Good representation of the patterns at this period is crucial for indirectly
informing about EPEs, as most of the EPEs occur during winter half.
Figure 6 Relative frequency biases of the Mediterranean patterns for the ECMWF reforecasts (median bootstraps value), when
considering annual (a), winter-half (b), and summer-half (c) year periods. The points (connected with bold lines) indicate
significant biases.

The forecast performance (median value of the bootstraps) in the predictability of P95 EPEs is
presented in Figure 7 (Figs. S6, S7 for P90, P099, respectively). The plot shows the performance over
selected (large) domains (area-weighted mean of all included grid cells), in terms of BSS for P95 EPEs,
based on direct forecasting (using model-predicted precipitation) and indirect one (using the
forecasted patterns and their half-year conditional probabilities for EPEs). The direct forecasts have a
high skill for short and medium range predictions; the skill drops below the reference score (pale-
coloured lines) at about 8 days lead time. A small spike observed at 15 days lead time can be attributed
to the change of the horizontal resolution that happens to the ECMWF forecasts at that time, which
lead to some errors when resampling the variable from the fine resolution to the coarser one. The
indirect EPE forecasting outperforms the reference score over 10 days lead time in general, extending
the forecasting horizon. This extension of the forecasting horizon based on indirect forecasting of EPEs
can be explained by the nature of this method, which, by construction, is not biased. More specifically,
when there are no (or low) biases on the regimes (something that in general applies in this study; Fig.
6), the indirect method does not over-/under-forecast EPEs, and that’s why the BSS has an asymptotic
behaviour around 0 at longer lead times. On the other hand, the direct forecasting of precipitation is
more susceptible to biases, especially so at longer lead times. Thus, BSS decreases to below 0 after
medium-range forecasts. As the discriminatory skill of the patterns nowhere exceeds 20% even for
perfect forecasts (Fig. 4), the BSS does not exceed 0.2, even at 0-day lead time. From the selected
subregions (subplots b-f), northern Morocco has a better skill. This relates to its small domain and
homogeneity, with the mountain ranges forming a barrier that direct the flow and force moisture to
precipitate.
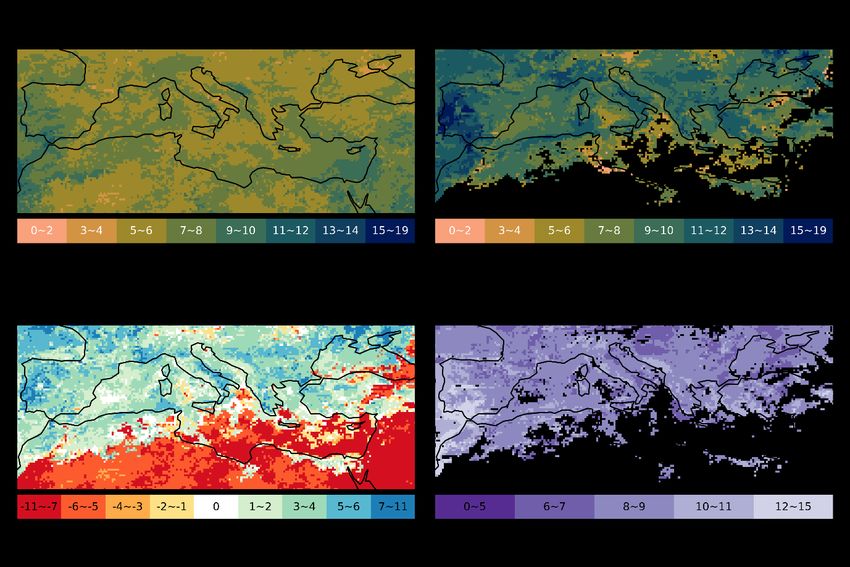
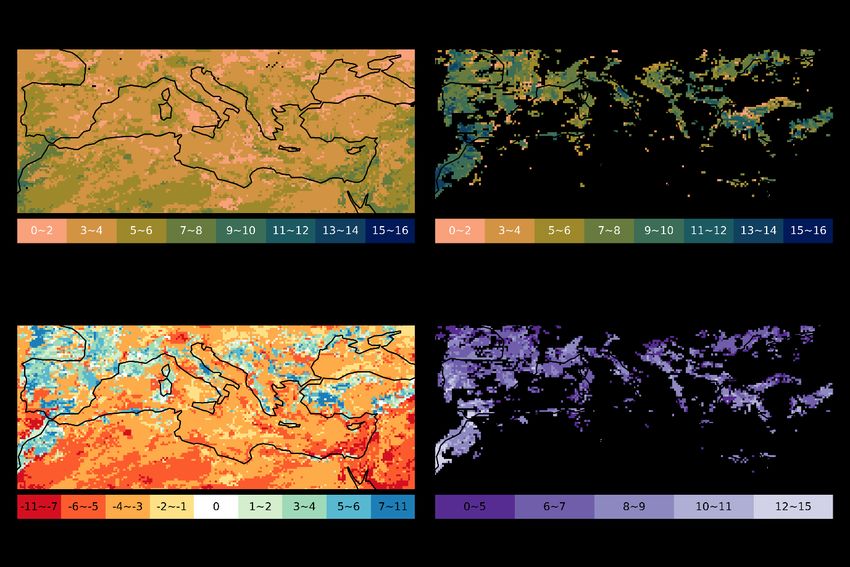
Figure 2 Brier Skill Score for direct (blue colour) and indirect (orange colour) P95 EPEs forecasting for selected subregions.

Figure 8 presents similar results as Figure 7, yet now for each grid cell of the studied domain. Subplots
(a) and (b) present the forecasting horizon up to when the model beats the reference score for direct
and indirect forecasting (statistically significant results). The results of the indirect forecasting are
masked to exclude any grid cell that has no significant discriminatory skill for EPEs when conditioning
on the patterns (i.e., assuming a perfect pattern forecast). Significance is derived based on the 1,000
bootstraps per lead day (and considering all lead times used for the analysis) with a 90% one-tailed
confidence interval. The indirect forecasting outperforms the reference score even for over 8 days
lead time for many regions, especially so for Iberian Peninsula, southern Balkans and western Turkey.
In contrast, direct forecasting has skilful predictions only up to 8 days lead time for most locations. It
can be noticed from subplot (c) that indirect forecasting extends the forecasting horizon for EPEs by
between 3 and 6 days for many of the locations. This is a substantial increase in lead time, which could
support informative decision making for various domains, as for example (re)insurance companies and
agricultural sector. As the discriminatory skill (Fig. 4) of the patterns for inferring EPEs is not very
strong, indirect forecasting is not beneficial at short lead times. This information outperforms the
direct forecasting only after the end of week 1 for most locations as shown in subplot (d).

Summarizing, results suggest that up to the end of week one, it is beneficial to use direct EPE
forecasting, while for week two (extending to week three for few locations), indirect forecasting is the
preferred method. Therafter, climatological forecasting provides the most informative inputs. Results
for P90 and P99 events are presented in Figures S8 and S9. As the EPEs definition becomes stricter,
benefits of indirect forecasting decrease and are confined to smaller areas; mainly related to locations
of high orography and coastal domains. One explanations for the above have been provided in the
discussion of Figure 4. An additional explanation is that P99 EPEs refer to a very small sample of events
per domain. Thus, conditional probabilities are not stable and deviate noticeable when using
bootstrapping and different subsets. This could be improved by optimizing the probabilities. Yet,
significant improvement is not expected, as many events are driven by localized convective activity
for high EPEs, which is not substantially affecting large-scale weather variability.
Figure 8 Forecasting horizon (maximum forecast day) up to when the ECMWF model outperforms the reference score (BSS>0)
in predicting P95 EPEs, when assessing EPEs based on the forecasted precipitation (a), or the forecasted Mediterranean
patterns (b). (c) Difference of the forecasting horizon between subplot (b) and subplot (a). (d) Minimum lead day from when
indirect forecasting of EPEs (based on patterns) outperforms direct forecasting (based on precipitation).

Figure 9 presents the maximum economic value for 7-, 11-, and 17-days lead-time forecasts, for the
same regions as Figure 7. Results are calculated from the actual reforecasts data (using 105 instead of
110 dates, to respect the climatological frequency of seasons), without performing bootstraps due to
the computational load. For each of the lead times, the best forecasting method (direct, indirect,
reference) for each cost-loss ratio, is selected and coloured accordingly. Figure S10 provides an
example of how each of the 3 methods performs for the 7-days lead time. From this plot, the best
method at each cost-loss ratio is kept for deriving the 7-day lead-time lines in Figure 9. Note that the
reference score has positive values, rather than 0, because it already takes into consideration the
seasonality in the occurrence of EPEs, whereas the climatological economic value is solely based on
the 5% probability of the EPEs throughout the year. As the studied EPEs are the P95, the maximum
economic value is obtained when the cost-loss ratio is equal to the climatological occurrence of the
extremes (5 %). For high cost-loss ratios, even for extended-range forecasts, the highest benefits are
obtained when using model-predicted precipitation. This is because for such high ratios, decisions
would be financially viable only if there is high probability and confidence for upcoming EPEs. Direct
forecasting is the only method that can deliver high probabilities, as it can even reach 100 %, whereas
indirect (or the reference ones), cannot exceed 45 % at any location (Fig. 2). As for low cost-loss ratios,
indirect forecasting brings the highest benefits, already from day 7. The usefulness of this information
becomes wider at 11 days lead time, while benefits can be seen even 17 days ahead. These results
further support the previous findings in terms of BSS, translating the usefulness of the forecasts to
economic benefits. They demonstrate that there is a wide range of cost-loss ratios that indirect
forecasting based on the patterns delivers maximum benefits for decisions regarding EPEs.
Figure 9 P95 EPEs: Maximum Economic value for all cost-loss rations and three different lead times (7-, 11-, and 17-days from
upper line to lower line) for selected subregions. At each cost-loss ratio, the best method among the direct/indirect forecasting
and reference score are kept and coloured accordingly (blue, orange, green colour respectively).

5. Conclusions
This work analysed if and where large-scale atmospheric flow patterns over the Mediterranean can
be used as skilful predictors for localized EPEs at medium and extended range forecasts. The nine
selected large-scale patterns by Mastrantonas et al. (2021), based on EOF analysis and subsequent K-
means clustering of daily anomalies of sea level pressure and geopotential height at 500 hPa, depict
atmospheric variability in the lower and middle troposphere over the Mediterranean. The EPEs were
derived from the 90th, 95th, and 99th percentile of annual daily precipitation at each grid cell. The ERA5
dataset was used as the reference dataset, while the ECMWF extended range reforecasts (cycle 46r1)
were used as forecasting product. Long-term statistics of the product, regarding pattern predictability
and indirect EPE predictability, based on the predicted patterns, was assessed with the Brier Skill
Score, considering 2,200 reforecasts at each lead time ranging from 0 up to 45 days ahead.
Bootstrapping was also implemented to assess results’ significance.

The results show that the ECMWF model well represents the Mediterranean patterns without
remarkable biases of their climatological frequencies – even up to 45th day lead time. The model
provides skilful predictions of the patterns up to 2 weeks in advance; outperforming results based on
climatological frequencies and persistence. Its performance does not show noticeable deviations
between the different patterns and the winter-half and summer-half periods. The only differences
worth-noticing are observed during winter-half years for Mediterranean High and Minor Low patterns.
The former has a forecasting horizon extending up to week 3, while the latter is limited to week 1.

Using the forecasted patterns for indirect EPE predictability provides skilful predictions up to ~10 days
for many locations in the Mediterranean. Especially for areas with high orography and coastal
locations (e.g., parts of Iberian Peninsula, Morocco, western Italy/Balkans/Turkey), the use of these
patterns outperforms climatological EPE allocations by more than 10 days ahead. In fact, using these
patterns, rather than the actual forecasted precipitation fields, extends the EPE forecasting horizon
by 3–6 days for many locations. These benefits also translate to economic value, with results indicating
that the maximum economic benefits for low cost-loss ratios are obtained based on indirect EPE
forecasting from 7-days lead time already.

Our results demonstrate that using large-scale patterns as predictors can provide useful information
for localised extremes already at medium-range forecasts, extending up to sub-seasonal scales. Such
information can be promising for various users, for example the agricultural sectors, emergency
response units and (re)insurance companies. To further advance this direction, it would be useful to
research additional aspects:

 • Are there teleconnections influencing the occurrence of the nine Mediterranean patterns?
 • Are there sources of predictability that give higher confidence for the forecasts of the
 patterns at extended-range lead times?
 • What would be the benefits of using more localised large-scale patterns for different
 subdomains in the Mediterranean, considering, for example, country-wise analysis?
 • How skilful is indirect EPE forecasting when using other predictors, such as water vapour flux
 that is highly related to precipitation (Lavers et al., 2018, 2017, 2016a, 2016b, 2014, 2011)?

Answering such questions can provide guidelines about which predictor is beneficial for different
spatiotemporal resolutions, locations, and forecasting horizons, making better use of already available
NWP model outputs. This can ultimately support the development of new operational products
towards seamless predictions of extreme precipitation that will provide higher confidence to decision
makers and users of different sectors. Such steps, considered a priority for international research
(Majumdar et al., 2021), will be addressed by future studies.

Acknowledgements
This work is part of the Climate Advanced Forecasting of sub-seasonal Extremes (CAFE) project; a
project funded by the European Union’s Horizon 2020 research and innovation programme under the
Marie Skłodowska-Curie grant agreement No 813844. We would like to thank the data providers for
making the data freely available; ERA5 is available through the Copernicus Climate Data Store and
ECMWF reforecasts were downloaded via the ECMWF MARS server. NM would like to thank Zied Ben
Bouallègue for the discussions regarding forecasts verifications and David Richardson for providing
useful comments that improved the quality of this work.

Author Contributions
N.M. conducted literature review, data analysis and wrote the initial manuscript. L.M., F.P., and J.M.
followed the work and reviewed earlier versions. All authors contributed to discussions throughout
the development of this study and improved the initial manuscript. All authors have read and
approved the content of the manuscript.

References
Alexander, L.V., Zhang, X., Peterson, T.C., Caesar, J., Gleason, B., Tank, A.M.G.K., Haylock, M., Collins,
 D., Trewin, B., Rahimzadeh, F., Tagipour, A., Kumar, K.R., Revadekar, J., Griffiths, G., Vincent,
 L., Stephenson, D.B., Burn, J., Aguilar, E., Brunet, M., Taylor, M., New, M., Zhai, P., Rusticucci,
 M., Vazquez‐Aguirre, J.L., 2006. Global observed changes in daily climate extremes of
 temperature and precipitation. J. Geophys. Res. Atmospheres 111.
 https://doi.org/10.1029/2005JD006290
Bauer, P., Thorpe, A., Brunet, G., 2015. The quiet revolution of numerical weather prediction. Nature
 525, 47–55. https://doi.org/10.1038/nature14956
Bouallègue, Z.B., Magnusson, L., Haiden, T., Richardson, D.S., 2019. Monitoring trends in ensemble
 forecast performance focusing on surface variables and high-impact events. Q. J. R.
 Meteorol. Soc. 145, 1741–1755. https://doi.org/10.1002/qj.3523
Cardell, M.F., Amengual, A., Romero, R., Ramis, C., 2020. Future extremes of temperature and
 precipitation in Europe derived from a combination of dynamical and statistical approaches.
 Int. J. Climatol. 1–28. https://doi.org/10.1002/joc.6490
Douville, H., John, A., 2020. Fast adjustment versus slow SST-mediated response of daily
 precipitation statistics to abrupt 4xCO2. Clim. Dyn. https://doi.org/10.1007/s00382-020-
 05522-w
Ferranti, L., Corti, S., Janousek, M., 2015. Flow-dependent verification of the ECMWF ensemble over
 the Euro-Atlantic sector. Q. J. R. Meteorol. Soc. 141, 916–924.
 https://doi.org/10.1002/qj.2411
Ferranti, L., Magnusson, L., Vitart, F., Richardson, D.S., 2018. How far in advance can we predict
 changes in large-scale flow leading to severe cold conditions over Europe? Q. J. R. Meteorol.
 Soc. 144, 1788–1802. https://doi.org/10.1002/qj.3341
Grams, C.M., Beerli, R., Pfenninger, S., Staffell, I., Wernli, H., 2017. Balancing Europe’s wind-power
 output through spatial deployment informed by weather regimes. Nat. Clim. Change 7, 557–
 562. https://doi.org/10.1038/nclimate3338
Grazzini, F., Craig, G.C., Keil, C., Antolini, G., Pavan, V., 2020. Extreme precipitation events over
 northern Italy. Part I: A systematic classification with machine-learning techniques. Q. J. R.
 Meteorol. Soc. 146, 69–85. https://doi.org/10.1002/qj.3635
Grazzini, F., Fragkoulidis, G., Teubler, F., Wirth, V., Craig, G.C., 2021. Extreme precipitation events
 over northern Italy. Part II: Dynamical precursors. Q. J. R. Meteorol. Soc. 147, 1237–1257.
 https://doi.org/10.1002/qj.3969
Hannaford, J., Mastrantonas, N., Vesuviano, G., Turner, S., 2021. An updated national-scale
 assessment of trends in UK peak river flow data: how robust are observed increases in
 flooding? Hydrol. Res. https://doi.org/10.2166/nh.2021.156
Hersbach, H., Bell, B., Berrisford, P., Hirahara, S., Horányi, A., Muñoz‐Sabater, J., Nicolas, J., Peubey,
 C., Radu, R., Schepers, D., Simmons, A., Soci, C., Abdalla, S., Abellan, X., Balsamo, G.,
 Bechtold, P., Biavati, G., Bidlot, J., Bonavita, M., Chiara, G.D., Dahlgren, P., Dee, D.,
 Diamantakis, M., Dragani, R., Flemming, J., Forbes, R., Fuentes, M., Geer, A., Haimberger, L.,
 Healy, S., Hogan, R.J., Hólm, E., Janisková, M., Keeley, S., Laloyaux, P., Lopez, P., Lupu, C.,
 Radnoti, G., Rosnay, P. de, Rozum, I., Vamborg, F., Villaume, S., Thépaut, J.-N., 2020. The
 ERA5 global reanalysis. Q. J. R. Meteorol. Soc. n/a. https://doi.org/10.1002/qj.3803
Hoy, A., Schucknecht, A., Sepp, M., Matschullat, J., 2014. Large-scale synoptic types and their impact
 on European precipitation. Theor. Appl. Climatol. 116, 19–35.
 https://doi.org/10.1007/s00704-013-0897-x
Jonkman, S.N., 2005. Global Perspectives on Loss of Human Life Caused by Floods. Nat. Hazards 34,
 151–175. https://doi.org/10.1007/s11069-004-8891-3
Khairul, I.M., Mastrantonas, N., Rasmy, M., Koike, T., Takeuchi, K., 2018. Inter-Comparison of Gauge-
 Corrected Global Satellite Rainfall Estimates and Their Applicability for Effective Water
 Resource Management in a Transboundary River Basin: The Case of the Meghna River Basin.
 Remote Sens. 10, 828. https://doi.org/10.3390/rs10060828
Kostopoulou, E., Jones, P.D., 2005. Assessment of climate extremes in the Eastern Mediterranean.
 Meteorol. Atmospheric Phys. 89, 69–85. https://doi.org/10.1007/s00703-005-0122-2
Krouma, M., Yiou, P., Déandreis, C., Thao, S., 2021. Assessment of stochastic weather forecast of
 precipitation near European cities, based on analogs of circulation. Geosci. Model Dev.
 Discuss. 1–20. https://doi.org/10.5194/gmd-2021-36
Lavaysse, C., Vogt, J., Toreti, A., Carrera, M.L., Pappenberger, F., 2018. On the use of weather
 regimes to forecast meteorological drought over Europe. Nat. Hazards Earth Syst. Sci. 18,
 3297–3309. https://doi.org/10.5194/nhess-18-3297-2018
Lavers, D.A., Allan, R.P., Wood, E.F., Villarini, G., Brayshaw, D.J., Wade, A.J., 2011. Winter floods in
 Britain are connected to atmospheric rivers. Geophys. Res. Lett. 38.
 https://doi.org/10.1029/2011GL049783
Lavers, D.A., Pappenberger, F., Richardson, D.S., Zsoter, E., 2016a. ECMWF Extreme Forecast Index
 for water vapor transport: A forecast tool for atmospheric rivers and extreme precipitation.
 Geophys. Res. Lett. 43, 11,852-11,858. https://doi.org/10.1002/2016GL071320
Lavers, D.A., Pappenberger, F., Zsoter, E., 2014. Extending medium-range predictability of extreme
 hydrological events in Europe. Nat. Commun. 5, 1–7. https://doi.org/10.1038/ncomms6382
Lavers, D.A., Richardson, D.S., Ramos, A.M., Zsoter, E., Pappenberger, F., Trigo, R.M., 2018. Earlier
 awareness of extreme winter precipitation across the western Iberian Peninsula. Meteorol.
 Appl. 25, 622–628. https://doi.org/10.1002/met.1727
Lavers, D.A., Waliser, D.E., Ralph, F.M., Dettinger, M.D., 2016b. Predictability of horizontal water
 vapor transport relative to precipitation: Enhancing situational awareness for forecasting
 western U.S. extreme precipitation and flooding. Geophys. Res. Lett. 43, 2275–2282.
 https://doi.org/10.1002/2016GL067765
Lavers, D.A., Zsoter, E., Richardson, D.S., Pappenberger, F., 2017. An Assessment of the ECMWF
 Extreme Forecast Index for Water Vapor Transport during Boreal Winter. Weather Forecast.
 32, 1667–1674. https://doi.org/10.1175/WAF-D-17-0073.1
Llasat, M.C., Llasat-Botija, M., Petrucci, O., Pasqua, A.A., Rosselló, J., Vinet, F., Boissier, L., 2013.
 Towards a database on societal impact of Mediterranean floods within the framework of the
 HYMEX project. Nat. Hazards Earth Syst. Sci. 13, 1337–1350. https://doi.org/10.5194/nhess-
 13-1337-2013
Llasat, M.C., Llasat-Botija, M., Prat, M.A., Porcú, F., Price, C., Mugnai, A., Lagouvardos, K., Kotroni, V.,
 Katsanos, D., Michaelides, S., Yair, Y., Savvidou, K., Nicolaides, K., 2010. High-impact floods
 and flash floods in Mediterranean countries: the FLASH preliminary database, in: Advances
 in Geosciences. Presented at the 10th EGU Plinius Conference on Mediterranean Storms
 (2008) - 10th Plinius Conference on Mediterranean Storms, Nicosia, Cyprus, 22–24
 September 2008, Copernicus GmbH, pp. 47–55. https://doi.org/10.5194/adgeo-23-47-2010
Magnusson, L., 2019. ECMWF Severe Event Catalogue for Evaluation of Multi-scale Prediction of
 Extreme Weather.
Magnusson, L., Källén, E., 2013. Factors Influencing Skill Improvements in the ECMWF Forecasting
 System. Mon. Weather Rev. 141, 3142–3153. https://doi.org/10.1175/MWR-D-12-00318.1
Majumdar, S.J., Sun, J., Golding, B., Joe, P., Dudhia, J., Caumont, O., Gouda, K.C., Steinle, P.,
 Vincendon, B., Wang, J., Yussouf, N., 2021. Multiscale Forecasting of High-Impact Weather:
 Current Status and Future Challenges. Bull. Am. Meteorol. Soc. 102, E635–E659.
 https://doi.org/10.1175/BAMS-D-20-0111.1
Mastrantonas, N., Bhattacharya, B., Shibuo, Y., Rasmy, M., Espinoza-DáValos, G., Solomatine, D.,
 2019. Evaluating the benefits of merging Near Real-Time Satellite Precipitation Products: A
 Case Study in the Kinu Basin Region, Japan. J. Hydrometeorol. https://doi.org/10.1175/JHM-
 D-18-0190.1
Mastrantonas, N., Herrera‐Lormendez, P., Magnusson, L., Pappenberger, F., Matschullat, J., 2021.
 Extreme precipitation events in the Mediterranean: Spatiotemporal characteristics and
 connection to large-scale atmospheric flow patterns. Int. J. Climatol. 41, 2710–2728.
 https://doi.org/10.1002/joc.6985
Merino, A., Fernández-Vaquero, M., López, L., Fernández-González, S., Hermida, L., Sánchez, J.L.,
 García-Ortega, E., Gascón, E., 2016. Large-scale patterns of daily precipitation extremes on
 the Iberian Peninsula: PRECIPITATION EXTREMES ON THE IBERIAN PENINSULA. Int. J.
 Climatol. 36, 3873–3891. https://doi.org/10.1002/joc.4601
Neal, R., Dankers, R., Saulter, A., Lane, A., Millard, J., Robbins, G., Price, D., 2018. Use of probabilistic
 medium- to long-range weather-pattern forecasts for identifying periods with an increased
 likelihood of coastal flooding around the UK. Meteorol. Appl. 25, 534–547.
 https://doi.org/10.1002/met.1719
Neal, R., Fereday, D., Crocker, R., Comer, R.E., 2016. A flexible approach to defining weather patterns
 and their application in weather forecasting over Europe. Meteorol. Appl. 23, 389–400.
 https://doi.org/10.1002/met.1563
Neal, R., Robbins, J., Dankers, R., Mitra, A., Jayakumar, A., Rajagopal, E.N., Adamson, G., 2020.
 Deriving optimal weather pattern definitions for the representation of precipitation
 variability over India. Int. J. Climatol. 40, 342–360. https://doi.org/10.1002/joc.6215
Owens, R., Hewson, T., 2018. ECMWF Forecast User Guide. https://doi.org/10.21957/M1CS7H
Papalexiou, S.M., Montanari, A., 2019. Global and Regional Increase of Precipitation Extremes Under
 Global Warming. Water Resour. Res. 55, 4901–4914.
 https://doi.org/10.1029/2018WR024067
Richardson, D., Fowler, H.J., Kilsby, C.G., Neal, R., 2018. A new precipitation and drought climatology
 based on weather patterns. Int. J. Climatol. 38, 630–648. https://doi.org/10.1002/joc.5199
Richardson, D., Fowler, H.J., Kilsby, C.G., Neal, R., Dankers, R., 2020a. Improving sub-seasonal
 forecast skill of meteorological drought: a weather pattern approach. Nat. Hazards Earth
 Syst. Sci. 20, 107–124. https://doi.org/10.5194/nhess-20-107-2020
Richardson, D., Neal, R., Dankers, R., Mylne, K., Cowling, R., Clements, H., Millard, J., 2020b. Linking
 weather patterns to regional extreme precipitation for highlighting potential flood events in
 medium- to long-range forecasts. Meteorol. Appl. 27, e1931.
 https://doi.org/10.1002/met.1931
Richardson, D.S., 2000. Skill and relative economic value of the ECMWF ensemble prediction system.
 Q. J. R. Meteorol. Soc. 126, 649–667. https://doi.org/10.1002/qj.49712656313
Sukovich, E.M., Ralph, F.M., Barthold, F.E., Reynolds, D.W., Novak, D.R., 2014. Extreme Quantitative
 Precipitation Forecast Performance at the Weather Prediction Center from 2001 to 2011.
 Weather Forecast. 29, 894–911. https://doi.org/10.1175/WAF-D-13-00061.1
Thomas, S.R., Martínez-Alvarado, O., Drew, D., Bloomfield, H., 2021. Drivers of extreme wind events
 in Mexico for windpower applications. Int. J. Climatol. 41, E2321–E2340.
 https://doi.org/10.1002/joc.6848
Toreti, A., Giannakaki, P., Martius, O., 2016. Precipitation extremes in the Mediterranean region and
 associated upper-level synoptic-scale flow structures. Clim. Dyn. 47, 1925–1941.
 https://doi.org/10.1007/s00382-015-2942-1
Toreti, A., Naveau, P., Zampieri, M., Schindler, A., Scoccimarro, E., Xoplaki, E., Dijkstra, H.A., Gualdi,
 S., Luterbacher, J., 2013. Projections of global changes in precipitation extremes from
 Coupled Model Intercomparison Project Phase 5 models. Geophys. Res. Lett. 40, 4887–4892.
 https://doi.org/10.1002/grl.50940
Toreti, A., Xoplaki, E., Maraun, D., Kuglitsch, F.G., Wanner, H., Luterbacher, J., 2010. Characterisation
 of extreme winter precipitation in Mediterranean coastal sites and associated anomalous
 atmospheric circulation patterns. Nat. Hazards Earth Syst. Sci. 10, 1037–1050.
 https://doi.org/10.5194/nhess-10-1037-2010
Vitart, F., 2014. Evolution of ECMWF sub-seasonal forecast skill scores. Q. J. R. Meteorol. Soc. 140,
 1889–1899. https://doi.org/10.1002/qj.2256
White, C.J., Carlsen, H., Robertson, A.W., Klein, R.J.T., Lazo, J.K., Kumar, A., Vitart, F., Perez, E.C. de,
 Ray, A.J., Murray, V., Bharwani, S., MacLeod, D., James, R., Fleming, L., Morse, A.P., Eggen,
 B., Graham, R., Kjellström, E., Becker, E., Pegion, K.V., Holbrook, N.J., McEvoy, D., Depledge,
 M., Perkins‐Kirkpatrick, S., Brown, T.J., Street, R., Jones, L., Remenyi, T.A., Hodgson‐
 Johnston, I., Buontempo, C., Lamb, R., Meinke, H., Arheimer, B., Zebiak, S.E., 2017. Potential
 applications of subseasonal-to-seasonal (S2S) predictions. Meteorol. Appl. 24, 315–325.
 https://doi.org/10.1002/met.1654
Wilks, D.S., 2011. Statistical Methods in the Atmospheric Sciences. Academic Press, San Diego, CA.
Xoplaki, E., González-Rouco, J.F., Luterbacher, J., Wanner, H., 2004. Wet season Mediterranean
 precipitation variability: influence of large-scale dynamics and trends. Clim. Dyn. 23, 63–78.
 https://doi.org/10.1007/s00382-004-0422-0
Xoplaki, E., Trigo, R.M., García-Herrera, R., Barriopedro, D., D’Andrea, F., Fischer, E.M., Gimeno, L.,
 Gouveia, C., Hernández, E., Kuglitsch, F.G., Mariotti, A., Nieto, R., Pinto, J.G., Pozo-Vázquez,
 D., Saaroni, H., Toreti, A., Trigo, I.F., Vicente-Serrano, S.M., Yiou, P., Ziv, B., 2012. Large-Scale
 Atmospheric Circulation Driving Extreme Climate Events in the Mediterranean and its
 Related Impacts, in: Lionello, P. (Ed.), The Climate of the Mediterranean Region. Elsevier,
 Oxford, pp. 347–417. https://doi.org/10.1016/B978-0-12-416042-2.00006-9
Yiou, P., Déandréis, C., 2019. Stochastic ensemble climate forecast with an analogue model. Geosci.
 Model Dev. 12, 723–734. https://doi.org/10.5194/gmd-12-723-2019
You can also read


