Electrically Active Diurnal Pulses in Hurricane Harvey (2017) - Atmospheric ...
←
→
Page content transcription
If your browser does not render page correctly, please read the page content below
JUNE 2020                                                  DITCHEK ET AL.                                                                    2283

                      Electrically Active Diurnal Pulses in Hurricane Harvey (2017)

          SARAH D. DITCHEK, KRISTEN L. CORBOSIERO, ROBERT G. FOVELL, AND JOHN MOLINARI
                    Department of Atmospheric and Environmental Sciences, University at Albany, State University of
                                                   New York, Albany, New York

                                     (Manuscript received 24 January 2020, in final form 5 March 2020)

                                                                  ABSTRACT

                  Recent research has found that diurnal pulses are ubiquitous features of tropical cyclones. To gain further
               insight into the characteristics of these pulses, a case study of an electrically active (ACT) cooling pulse and an
               off-the-clock ACT cooling pulse that occurred in Hurricane Harvey (2017) was conducted. Using GridSat-B1
               IR brightness temperatures, World Wide Lightning Location Network (WWLLN) lightning data, the 85–91-
               GHz channels on microwave satellite imagers, and Level-II Doppler radar reflectivity data from WSR-88D
               stations (i.e., NEXRAD), these pulses were found to share many similar characteristics: both propagated
               outward on the right-of-shear side of Harvey and were associated with elevated cloud ice content and
               high reflectivity. Additionally, using HRRR model output, both pulses were found to be associated with 1)
               column-deep total condensate, 2) a surface cold pool, 3) an overturning circulation, and 4) an enhanced
               low-level jet. These characteristics are similar to those found in tropical squall lines, supporting the tropical
               squall-line interpretation of diurnal pulses put forth in recent studies. A hypothesis for ACT pulse initia-
               tion was then introduced, tested, and confirmed: inner rainbands that propagated outward into a more fa-
               vorable environment for deep convection reinvigorated into ACT pulses that had tropical squall-line
               characteristics.

1. Introduction                                                            the Dunion et al. (2014) clock. As in Dunion et al.
                                                                           (2014), Ditchek et al. (2019a) used IR brightness tem-
   Dunion et al. (2014) took 6-h IR brightness temper-
                                                                           peratures to create 6-h IR brightness temperature dif-
ature differences of Atlantic basin major hurricanes
                                                                           ference fields, and pulses of cooler cloud tops were
from 2001 to 2010. In doing so, they found an area of
                                                                           defined objectively by determining critical thresholds
cooler cloud tops (relative to 6 h prior) that routinely
                                                                           for the magnitude of the IR brightness temperature
propagated outward from the 200-km radius beginning
                                                                           differences and areal coverage of cold cloud tops. The
around 0400–0800 LT. These cooler cloud tops had a
                                                                           metric identified days with ‘‘cooling pulses’’, similar to
propagation speed of about 5–10 m s21, so that by 1500–
                                                                           those documented by Dunion et al. (2014), and days
1800 LT, they were around the 500-km radius. They also
                                                                           without cooling pulses. For some of the days without
found that these cooler cloud tops (negative values in
                                                                           cooling pulses, locally warmer cloud tops that propa-
the difference fields) were often trailed by warmer cloud
                                                                           gated outward at a similar time and speed as their
tops (positive values in the difference fields). They de-
                                                                           cooling cloud top counterparts were discovered. These
fined this propagating feature as a ‘‘diurnal pulse’’ and
                                                                           ‘‘warming pulses,’’ a previously undiscovered pulse
created a 24-h conceptual clock that identified around
                                                                           type, were then also objectively defined using thresholds
which radius the pulse would be located based on local
                                                                           for the magnitude of the IR brightness temperature
time (LT).
                                                                           differences and areal coverage of warm-cloud tops.
   To understand tropical cyclone diurnal pulse fre-
                                                                           Cooling and warming pulses were then divided, based
quency, structure, and characteristics, Ditchek et al.
                                                                           on their longevity, into long-lived pulses ($9 h) and
(2019a) generalized and expanded the results of Dunion
                                                                           short-lived pulses (3–6 h). Therefore, each storm day
et al. (2014) by creating a 36-yr climatology of Atlantic
                                                                           was given a pulse-type classification: 1) long-lived cooling
basin diurnal pulses that had similar temporal phasing as
                                                                           pulse (LLCP), 2) short-lived cooling pulse (SLCP), 3)
                                                                           long-lived warming pulse (LLWP), 4) short-lived warm-
  Corresponding author: Sarah D. Ditchek, sarahditchek@gmail.com           ing pulse (SLWP), or 5) no pulse (NP). One key result of

DOI: 10.1175/MWR-D-20-0022.1
Ó 2020 American Meteorological Society. For information regarding reuse of this content and general copyright information, consult the AMS Copyright
Policy (www.ametsoc.org/PUBSReuseLicenses).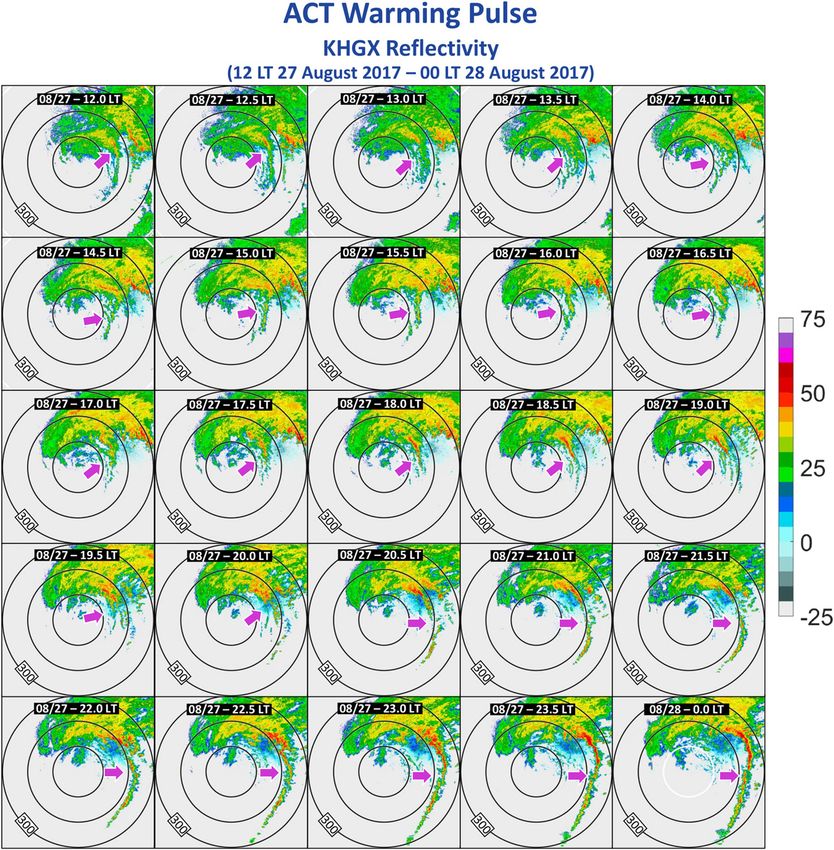
2284                                         MONTHLY WEATHER REVIEW                                                       VOLUME 148

Ditchek et al. (2019a) was that diurnal cooling and                   propagation speed that did not support the gravity
warming pulses were near-ubiquitous features of tropi-                wave interpretation of diurnal pulses. Additionally, as
cal cyclones, present 88% of the time.                                INACT warming pulses were not associated with
   Taking IR brightness temperature differences only                  convection, the tropical squall-line interpretation
depicts the tendencies at cloud top. Dunion et al. (2014),            was found to be incomplete.
however, showed that diurnal pulses might be associated                  While Ditchek et al. (2019a,b) answered questions
with deep convection. For example, using 89-GHz mi-                   about the frequency and structure of tropical cyclone
crowave satellite imagery, they showed that Hurricane                 diurnal pulses, they relied on composites and did not
Emily (2005) and Hurricane Felix (2007) had diurnal                   examine the thermodynamic and kinematic proper-
pulses that were associated with elevated cloud ice                   ties of pulses. Therefore, it was not possible to gain
content and, therefore, possibly deep convection (cloud               further insight into pulse characteristics, including
ice is indicated by warm colors in their Figs. 2c,d and               whether pulses behave like tropical squall lines (Dunion
5c,d). Later, Dunion et al. (2019) used the highly real-              et al. 2019) and their potential initiation mechanisms.
istic ‘‘hurricane nature run’’ of Nolan et al. (2013) to              Since the literature lacks case studies of observed diur-
study diurnal pulses. In doing so, they found that pulses             nal pulses, this paper focuses on two representative
were associated with enhanced vertical velocities and                 ACT2 pulses present in Hurricane Harvey (2017): an
elevated total condensate, along with trailing down-                  ACT cooling pulse and an ACT warming pulse. Since
drafts and suppressed moisture, signatures of a cold                  Ditchek et al. (2019b) found that ACT warming pulses
pool. They, therefore, stated that their results supported            were preceded by an off-the-clock ACT cooling pulse,
a tropical squall-line explanation of diurnal pulses.                 most of the results discussed in this paper will focus on
   Since Dunion et al. (2014, 2019) found that diurnal                comparing the ACT cooling pulse to the off-the-clock
pulses could be column-deep, Ditchek et al. (2019b)                   ACT cooling pulse.
stratified the 36-yr climatology of Ditchek et al. (2019a)               The aim of this paper is threefold: 1) to document the
into pulses that were and were not associated with deep               evolution of the two representative ACT pulses, 2) to
convection using World Wide Lightning Location                        evaluate whether these pulses behaved like tropical
Network (WWLLN) lightning data from 2005 to 2017,                     squall lines, and 3) to identify their initiation mecha-
as lightning has been found to be a sufficient, but not               nisms. Data used are detailed in section 2. Section 3
necessary, proxy for deep convection in tropical cy-                  details how the two representative pulse days were se-
clones (Corbosiero and Molinari 2002, 2003; Abarca                    lected. Section 4 documents the plan-view evolution of
et al. 2011; Stevenson et al. 2016, 2018). They identified            Harvey’s 6-h IR brightness temperature differences and
electrically active (ACT), quasi-electrically active (QUASI),         associated lightning, supplemented by 85–91-GHz mi-
and electrically inactive (INACT) pulses based on an                  crowave and radar reflectivity imagery for both ACT
objective metric that incorporated lightning flash den-               pulse days. To better understand the thermodynamic
sity, areal coverage, and longevity within a pulse. It was            and kinematic properties of the ACT pulses present in
found that ACT pulses occurred around 61% of the                      Harvey and determine whether they behaved like
time, primarily when pulses propagated outward on the                 tropical squall lines, forecasts from the High-Resolution
right-of-shear side of the storm, the dominant quadrant               Rapid Refresh (HRRR; Benjamin et al. 2016) model
for outer-rainband lightning activity (Corbosiero and                 developed by NOAA’s Earth System Research Laboratory
Molinari 2002, 2003; Stevenson et al. 2016). Interestingly,           (ESRL) and run by NCEP’s Environmental Modeling
ACT warming pulses were associated with off-the-clock1                Center (EMC) were used to further study the observed
ACT cooling pulses that propagated outward ahead                      diurnal pulses (section 5). From results gathered, a hy-
of the warming pulse. The propagation speed of ACT                    pothesis for ACT pulse initiation was formed and tested
cooling pulses, ACT warming pulses, and INACT cooling                 (section 6). Finally, section 7 provides a summary and
pulses offered support to the gravity wave interpretation             areas for future work.
of diurnal pulses proposed in the literature (Navarro
et al. 2017; O’Neill et al. 2017; Ruppert and O’Neill                 2. Data
2019; Evans and Nolan 2019) and to the Dunion et al.
                                                                      a. Observations
(2019) result that pulses take on tropical squall-line
characteristics after propagating away from the inner                    Four times daily location and intensity data over Harvey’s
core. The INACT warming pulses, however, had a                        lifetime from 0600 UTC 16 August to 1200 UTC

 1                                                                      2
   A pulse being ‘‘off-the-clock’’ means that it did not follow the       The reason behind the selection of just these two pulse types
Dunion et al. (2014) diurnal clock schematic.                         will be described in section 3.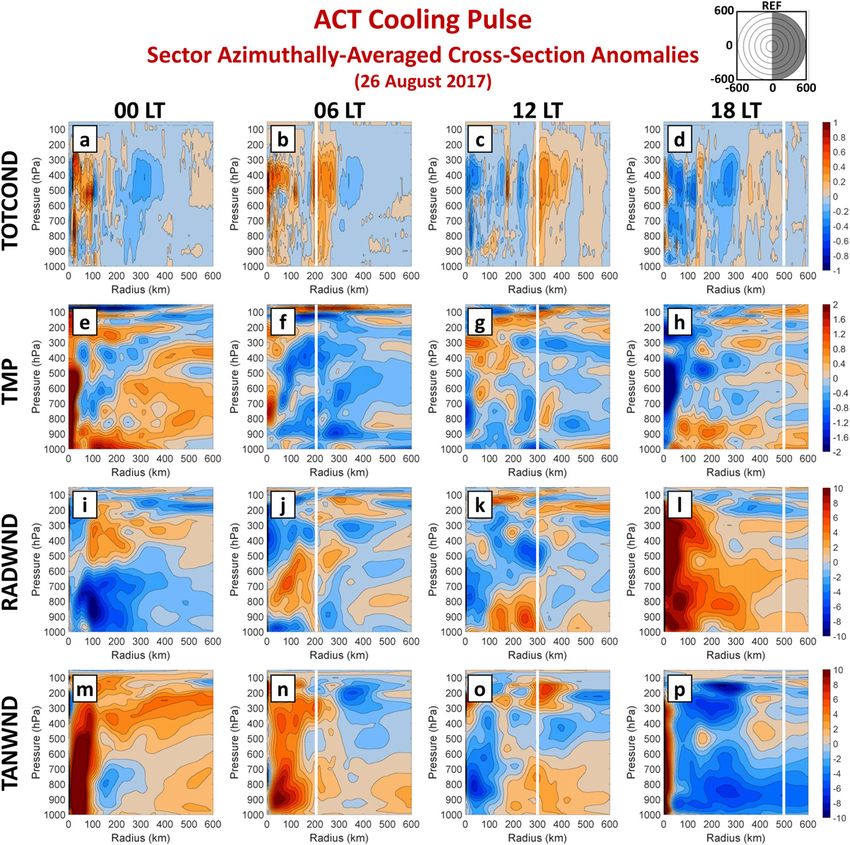
JUNE 2020                                       DITCHEK ET AL.                                                      2285

2 September 2017 were obtained from the Hurricane            satellite. Images were retrieved from the Naval Research
Database (HURDAT2; Landsea and Franklin 2013)                Laboratory Monterey Tropical Cyclones web page
and were linearly interpolated to a temporal resolution      (http://www.nrlmry.navy.mil/TC.html) and were modi-
of 3 h. For each storm time, the p 5 200–850-hPa, r 5 0–     fied for aesthetic purposes.
500-km developmental Statistical Hurricane Intensity            Level-II Doppler radar reflectivity data from WSR-
Prediction Scheme (SHIPS; DeMaria and Kaplan 1994,           88D stations (i.e., NEXRAD) were also used to visual-
1999; DeMaria et al. 2005) shear magnitude (kt; 1 kt ’       ize the structure of the pulses underneath the cloud
0.5144 m s21) and direction (degrees) were also re-          top. The reflectivity data has an approximately 5-min
trieved, linearly interpolated to a temporal resolution of   temporal resolution and around a 1-km spatial resolu-
3 h, and converted to m s21.                                 tion. NOAA’s Weather and Climate Toolkit (https://
   Next, the 3-h temporal resolution and 0.078 3 0.078       www.ncdc.noaa.gov/wct/) was used to extract reflectivity
horizontal resolution GridSat-B1 IR brightness tem-          data at the lowest elevation angle every 3 h, to match the
peratures (Knapp et al. 2011) were extracted and cen-        temporal resolution of GridSat-B1, and every 30 min, to
tered on each storm time, yielding 139 storm-centered        show finer-resolution features over a select period of
grids over 18 storm days. The 6-h IR brightness tem-         time (section 6b). Stations accessed included Corpus
perature differences (T0 2 T26 h) were then computed         Christi (KCRP) and Houston (KHGX).
on the storm-centered 0.078 3 0.078 resolution grid
                                                             b. HRRR model analyses
every 3 h.
   Lightning flash locations 61.5 h of each storm time          To better understand the characteristics of diurnal
were obtained from WWLLN and binned to a storm-              pulses, version 2 of the HRRR, archived by the University
centered, 0.078 3 0.078 grid, matching the GridSat-B1        of Utah MesoWest HRRR (Blaylock et al. 2017), was
resolution. As described in Ditchek et al. (2019b), in       used to supplement the 6-h IR brightness temperature
order for the yearly WWLLN lightning density to match        differences, lightning data, 85–91-GHz microwave im-
the lightning density climatology of the spaceborne          agery, and reflectivity imagery.
Optical Transient Detector (OTD) and the Lightning              The HRRR uses the Advanced Research Weather
Imaging Sensor (LIS) on board the Tropical Rainfall          Research and Forecasting Model (WRF-ARW) as its
Measuring Mission (TRMM) satellite, adjustment fac-          core. Its grid is centered over the contiguous United
tors are applied to the WWLLN data. These adjustment         States on a Lambert Comformal projection, with ini-
factors account for the increase in sensors and im-          tial and boundary conditions from the 13-km Rapid
proved detection algorithms, and, therefore, detection       Refresh (RAP) model that covers the entirety of
efficiency over time (Rodger et al. 2009; Abarca et al.      North America. The horizontal resolution of the
2010; DeMaria et al. 2012; Stevenson et al. 2018).           HRRR is 3 km. This high spatial resolution made it
Therefore, the 2017 adjustment factor of 3.6 that was        ideal to use as the diurnal pulse is around 75–200-km
used in Ditchek et al. (2019b) was applied to the            wide (Ditchek et al. 2019a, Figs. 4 and 5); thus, at least
WWLLN data.                                                  25 model grid points would span the pulse. The
   Since IR brightness temperatures only depict the          HRRR is run every hour, producing 0–18-h forecasts.
temperatures at cloud top, to view the areas of tropical     More information on the HRRR can be found in
cyclones with deep convective features (e.g., the eye-       Benjamin et al. (2016).
wall, rainbands, and perhaps diurnal pulse), the 85–91-         Since prior to each initialization, available obser-
GHz channels on microwave satellite imagers were             vations, including reflectivity, are assimilated (Wu
used. In these channels, areas of deep convection have       et al. 2002; James and Benjamin 2017), it is expected
low brightness temperatures (warm colors) due to ice         that the HRRR should be able to reproduce the di-
scattering, while the ocean and low-level, moist air have    urnal pulses in Harvey. In essence, therefore, the
high brightness temperatures (cool colors; Hawkins           HRRR is used to accomplish retrievals of fields that
and Velden 2011). The 85–91-GHz channels from four           cannot be directly sensed by, or easily obtained from,
sources were obtained: 1) the Special Sensor Microwave       observations.
Imager (SSM/I; F-15) on board the Defense Meteorological        The first time when Harvey’s center was 400 km from
Satellite Program (DMSP) satellites, 2) the Special          the southern boundary of the HRRR was 0600 UTC
Sensor Microwave Imager/Sounder (SSMIS; F-16,-17,            (0000 LT) 26 August. From that time until Harvey made
and -18) on board the DMSP satellites, 3) the Advanced       its final landfall at 0800 UTC 30 August (so as not to
Microwave Scanning Radiometer 2 (AMSR2) on board             include times when Harvey was transitioning from a
the GCOM-W1 satellite, and 4) the Advanced Microwave         tropical to an extratropical system; Blake and Zelinsky
Sounding Unit-B (AMSU-B) on board the NOAA-18                2017), forecast hour 0 (i.e., the analysis) was retrieved, as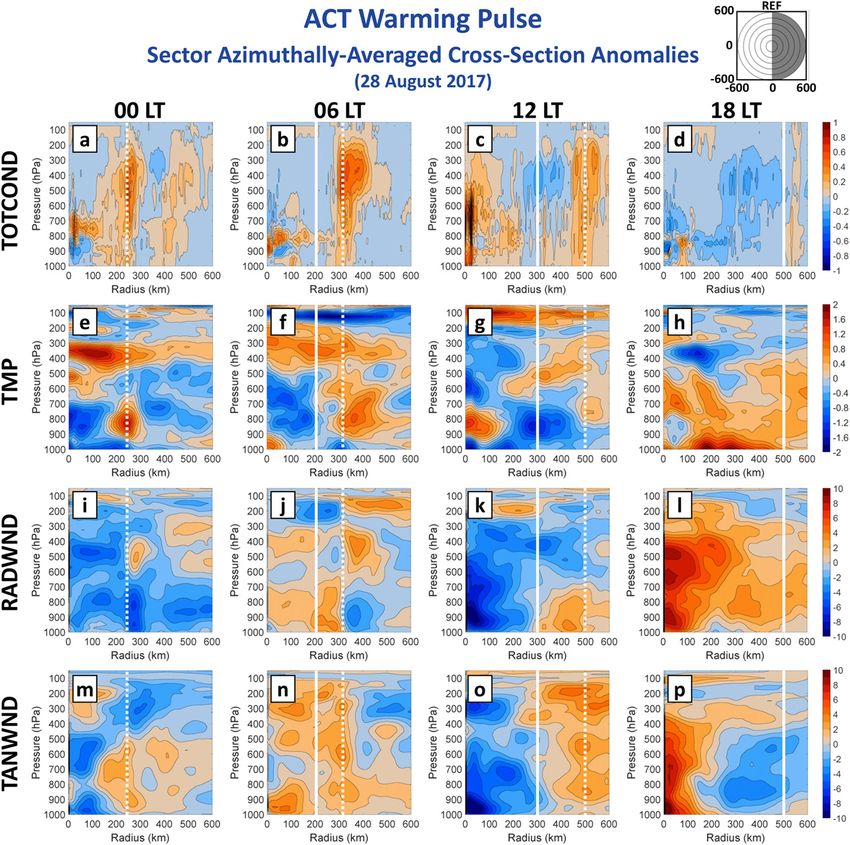
2286                                     MONTHLY WEATHER REVIEW                                               VOLUME 148

it was the only hour archived for three-dimensional             perhaps, because the ACT cooling and warming pulses
fields. Fields accessed included simulated IR brightness        studied here mostly moved radially outward over the
temperature (K), total condensate (TOTCOND; g kg21),            Gulf of Mexico rather than moving radially outward
temperature (TMP; K), convective available potential            over land.
energy (CAPE; J kg21), as well as zonal and meridio-               Therefore, while studying the impacts of landfall on
nal winds, which were transformed into radial wind              diurnal pulse frequency and structure should be an area
(RADWND; m s21) and tangential wind (TANWND;                    of future research, it does not appear as though Harvey’s
m s21). Storm-centered fields were computed by cen-             landfall drastically affected or modified these two
tering each field on the smoothed mean sea level pres-          pulses. It should be noted, however, that land interac-
sure (MSLP) minimum in the HRRR for each analysis               tions are occurring during the pulses investigated in
time, where a 19-point moving average was used to achieve       this paper. Additionally, while similar analyses could
the smoothing. Tracking minimum MSLP, an integrated             be conducted for a different storm, in order to include
quantity, was found by Alland (2019) to find the storm          the high temporal and spatial resolution reflectivity
center more accurately than other storm-centering               data, a storm that moved close to land would need to be
methods such as those detailed in Nguyen et al. (2014).         selected.

3. Selection of case study days                                 4. ACT cooling pulse
  While Harvey occurred over an 18-day period, there              The ACT cooling pulse occurred over the 24-h period
were only 16 full (0000–2300 LT) storm days. Using the          beginning at 0600 UTC (0000 LT) 26 August. On this
objective metric from Ditchek et al. (2019a), each of           day, the shear was mostly southwesterly at 7.7 m s21 on
these 16 storm days was given a pulse-type classification.      average, falling into the moderate-shear grouping,
Then, using the objective metric from Ditchek et al. (2019b),   where moderate shear (4.4–10.6 m s21) was defined as
cooling and warming pulse days were classified based on         the interquartile range of the climatological distribution
their electric activity. For a concise view of the lifetime     of shear values in Ditchek et al. (2019a).
diurnal-pulse activity in Harvey, please see the appendix.
                                                                a. Observations
  Since the HRRR was used to explore pulse types
further, only days from 0600 UTC (0000 LT) 26 August              The 6-h IR brightness temperature difference evo-
to 0800 UTC (0200 LT) 30 August could be considered             lution with overlaid lightning for the ACT cooling
(as described in section 2b). The objective metrics             pulse every 3 h from 0000 to 2100 LT, along with white
identified that across those four days there were three         circles that depict around where the pulse should be
ACT cooling pulses and one ACT warming pulse. For               located following the Dunion et al. (2014) clock, is
the purpose of this study, two representative days were         given in Fig. 1. The pulse began propagating outward
selected: one of the days with an ACT cooling pulse             around 0300 LT near the 200-km radius, already cou-
(26 August) and the day with an ACT warming pulse               pled to lightning. It continued propagating outward
(28 August).                                                    through 1800 LT when it was present beyond the 500-km
  These pulse days occurred after Harvey made its first         radius. The pulse propagated outward on the right-of-
landfall. Due to that landfall, during the first 3 h of         shear side of the storm, the dominant side for lightning
the ACT cooling pulse day, Harvey rapidly weakened              activity outside of the inner core and the side often
from a category 4 hurricane to a tropical storm. For the        associated with ACT pulses (Ditchek et al. 2019b).
remainder of the day, the intensity was steady. The             Additionally, trailing the ACT cooling pulse were
ACT warming pulse occurred while Harvey was stalled             warming cloud tops.
over, and just offshore of, the Texas coastline. Over              The abundant lightning present suggests that the
that entire day, Harvey remained a tropical storm and           ACT cooling pulse was a column-deep feature.
did not experience any intensity fluctuations. Despite          Therefore, it is not surprising that the corresponding
the structural changes that accompany rapid weakening           85–91-GHz microwave imagery showed the presence
and landfall, the objective metrics were still able to          of elevated cloud ice content (i.e., possibly deep-
identify that ACT cooling and warming pulses occurred           convective clouds) in the ACT cooling pulse between
on these two days. Furthermore, as will be seen in              0300 and 1800 LT (Fig. 2). It was also not surprising
sections 4 and 5, the evolution of both the ACT cooling         that the pulse was seen in the reflectivity field between
and warming pulses were similar to the composite re-            0600 and 1200 LT when the amplitude of the 6-h IR
sults of Ditchek et al. (2019b) (their Figs. 3 and 5), which    brightness temperature differences was largest (Fig. 3).
did not include landfalling storms. This similarity is,         The trailing warming behind the ACT cooling pulse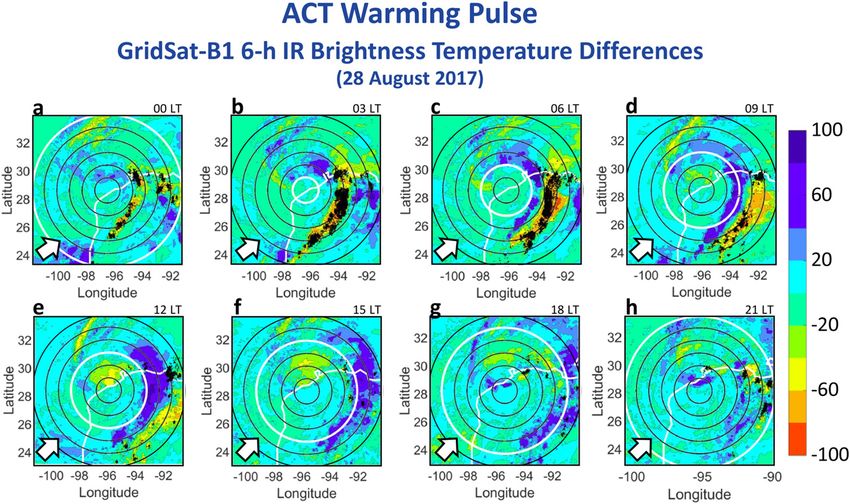
JUNE 2020                                                DITCHEK ET AL.                                                              2287

              FIG. 1. A plan view of 6-h IR brightness temperature difference fields (8C) at times closest to (a) 0000, (b) 0300,
            (c) 0600, (d) 0900, (e) 1200, (f) 1500, (g) 1800, and (h) 2100 LT with overlaid lightning 61.5 h centered on the image
            time for the day when the ACT cooling pulse occurred. The shear direction is indicated by the white arrow at the
            bottom left of each plot. Black range rings are overlaid on each image every 100 km from r 5 100–600 km. White
            range rings indicate the radius around which the pulse should occur using the extended version of the Dunion et al.
            (2014) diurnal clock (Ditchek et al. 2019a, Fig. 2b). Note that the colorbar resembles the conventional IR brightness
            temperature scale, where warmer colors represent colder cloud tops and cooler colors represent warmer cloud tops.

               FIG. 2. As in Fig. 1, but for 85–91-GHz microwave imagery (K) without overlaid lightning. Images were retrieved
            from the Naval Research Laboratory Monterey Tropical Cyclones web page (http://www.nrlmry.navy.mil/
            TC.html) and were modified for aesthetic purposes.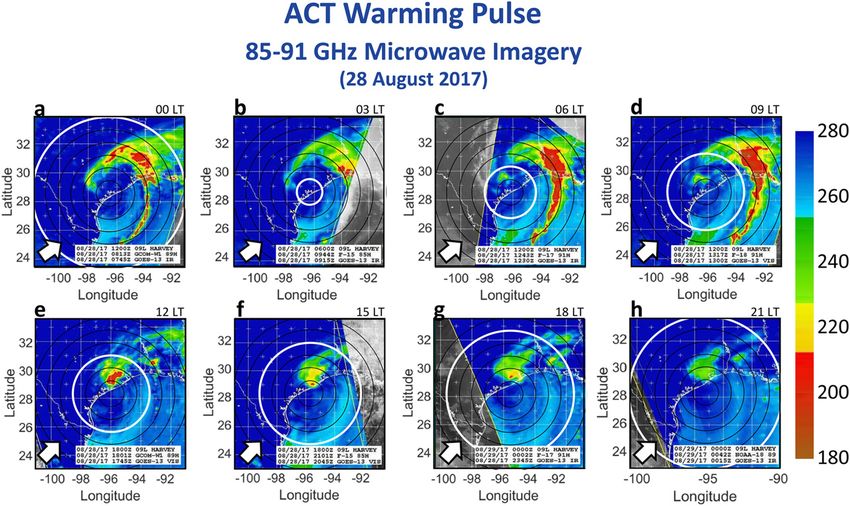
2288 MONTHLY WEATHER REVIEW VOLUME 148
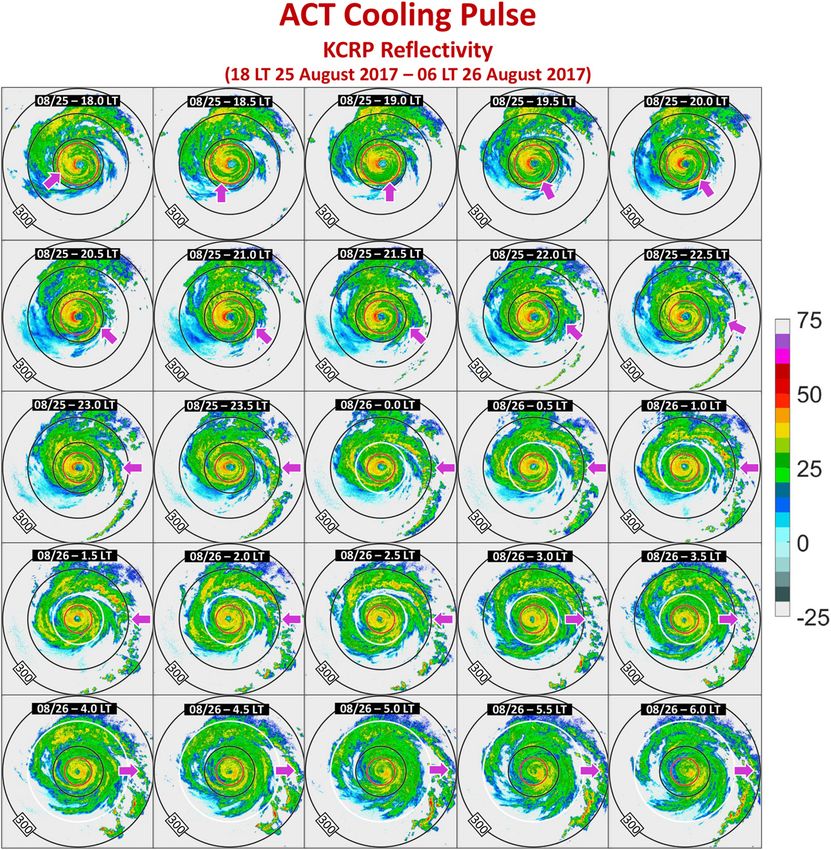
FIG. 3. As in Fig. 1, but for reflectivity (dBZ) without overlaid lightning.
was also detectable, associated with an absence of the HRRR was able to reproduce many aspects of the
cloud ice (Fig. 2) and low reflectivity values (Fig. 3). ACT cooling pulse.
b. Reproducibility of observed ACT cooling pulse c. Thermodynamic and kinematic properties from
the HRRR
The analyses of the 0600 UTC (0000 LT) 26 August–
0300 UTC (2100 LT) 27 August initializations of the To depict the anomalous thermodynamic and kine-
HRRR were used to determine whether the ACT cooling matic properties associated with the ACT cooling pulse,
pulse was reproduced by the model. The plan-view evo- anomalies from daily mean, sector-averaged cross
lution of the 6-h simulated IR brightness temperature sections were taken for total condensate, temperature,
differences depicted an outward propagating pulse on the radial wind, and tangential wind (Fig. 5).4 By taking
eastern side of the storm, as found in the observations (not azimuthal averages over a sector rather than the entire
shown). The associated azimuthally averaged,3 simulated, storm, the resulting azimuthal averages focus on just the
IR brightness temperatures and corresponding 6-h IR pulse and, due to its circular geometry, essentially run
brightness temperature differences (Figs. 4a,b) depicted an along the axis of the pulse. Here, sector averages were
conducted over the eastern half of Harvey, as that was
on-the-clock, outward-propagating cooling pulse with
where the ACT cooling pulse was located (Fig. 1). For
trailing warming that had a similar timing and propagation
reference, a diagram of this sector is included in Fig. 5.
speed as the ACT cooling pulse seen in the observations
For brevity, sector-averaged cross sections are shown
(Figs. 4c,d). The structures of the ACT cooling pulse in the
every 6 h, instead of 3 h.
HRRR and the observations were similar, with the maxi- The ACT cooling pulse in the HRRR was associated
mum amplitude of the pulse peaking at outer radii. Finally, with outward propagating, enhanced total condensate.
the HRRR also reproduced the cold cloud tops in the inner At 0000 LT, enhanced total condensate was mostly
core that were present overnight (Figs. 4a,c). Therefore, concentrated at mid- to upper levels and was located
3 4
The HRRR azimuthal averages were computed using a 3-km Qualitatively similar results were found when taking 6-h dif-
bin size, matching the HRRR resolution. ferences instead of anomalies from the daily mean.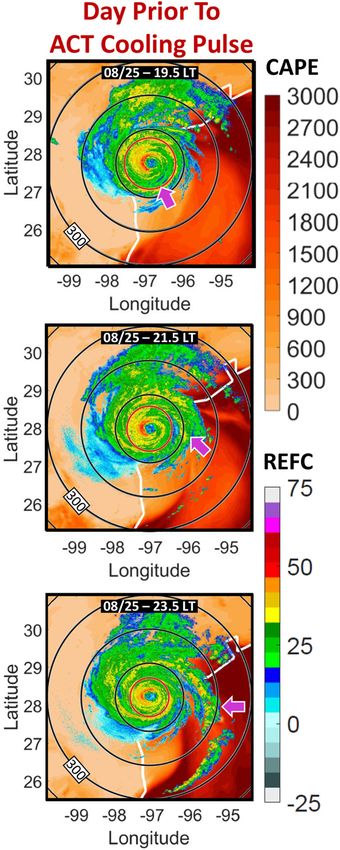
JUNE 2020                                                DITCHEK ET AL.                                                             2289

              FIG. 4. Azimuthally averaged (a),(c) IR brightness temperatures (8C) and (b),(d) 6-h IR brightness temperature
            differences (8C) for 0600 UTC (0000 LT) 26 Aug–0300 UTC (2100 LT) 27 Aug from (a),(b) the HRRR and from
            (c),(d) the observations. White lines correspond to the mean (solid), earliest (leftmost dashed), and latest (right-
            most dashed) times of the onset of the diurnal pulse according to the original diurnal clock in Dunion et al. (2014).
            Note that the colorbars in (b),(d) resemble the conventional IR brightness temperature scale seen in (a),(c), where
            warmer colors represent colder cloud tops and cooler colors represent warmer cloud tops.

around the 100-km radius (Fig. 5a). By 0600 LT, the pulse               cooling pulse (Figs. 5j,k). Above the anomalous radial
had enhanced total condensate at lower levels as well and               inflow, there was anomalous radial outflow, indicative of
began to propagate outward through 1800 LT (Figs. 5b,d).                an overturning circulation. Also present was a diver-
Radially inward of the ACT cooling pulse were lower                     gence signature between 400 and 600 hPa at 1200 LT,
values of total condensate, associated with the trailing                suggesting that this was the level of convective outflow.
warming that followed the ACT cooling pulse.                            Additionally, in the outflow layer (100–300 hPa), there
   The ACT cooling pulse was also associated with                       was enhanced radial outflow at the times of the strongest
anomalously cool temperatures that propagated out-                      pulse signature.
ward at low levels between 900 and 1000 hPa from 0600                     Finally, the ACT cooling pulse was associated with an
to 1200 LT (Figs. 5f,g). This positioning implies that the              area of anomalous cyclonic flow, indicative of a low-
ACT cooling pulse produced a cold pool in its wake, a                   level jet. Between 0600 and 1200 LT, the anomalous
feature often associated with tropical squall lines, con-               cyclonic flow was maximized at low levels (Figs. 5n,o).
sistent with the results of Dunion et al. (2019).                       At 1200 LT, it was also maximized at upper levels
   Additionally, from 0600 to 1200 LT between 800                       (Fig. 5o). By 1800 LT, the low-level signature was gone,
and 1000 hPa, anomalous radial inflow converged with                    perhaps because the pulse itself was of weaker ampli-
anomalous radial outflow near the axis of the ACT                       tude (Fig. 4b).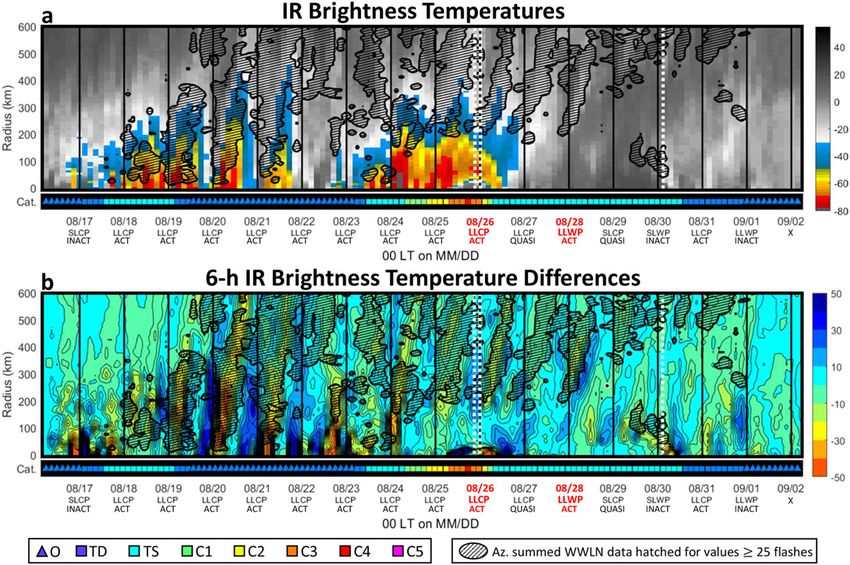
2290                                           MONTHLY WEATHER REVIEW                                                            VOLUME 148

  FIG. 5. Anomalies from daily mean, sector-averaged cross sections of (a)–(d) total condensate (TOTCOND; g kg21), (e)–(h) temperature
(TMP; K), (i)–(l) radial wind (RADWND; m s21), and (m)–(p) tangential wind (TANWND; m s21) for the ACT cooling pulse at 0000, 0600,
1200, and 1800 LT. White vertical lines indicate the radius around which the pulse should occur using the extended version of the Dunion et al.
(2014) diurnal clock (Ditchek et al. 2019a, Fig. 2b). Variables are from the analyses of the HRRR model runs for the ACT cooling pulse day.

   Overall, the HRRR depicted the ACT cooling pulse                      structure, Fig. 3 shows that the ACT pulse was asso-
as being a column-deep feature with an associated cold                   ciated with a rainband-like reflectivity feature that
pool, converging flow at low levels with an overturning                  propagated outward over the course of the day begin-
circulation, and enhanced cyclonic flow near the surface                 ning around the 100–200-km radius.
and aloft (Fig. 5). These features are reminiscent of the
structure of tropical squall lines and tropical cyclone
                                                                         5. ACT warming pulse
rainbands (e.g., Barnes et al. 1983; Powell 1990a,b; Hence
and Houze 2008; Houze 2010; Didlake and Houze 2009;                        The ACT warming pulse occurred over the 24-h period
Dunion et al. 2019). Corroborating this rainband-like                    beginning at 0600 UTC (0000 LT) 28 August. On this day,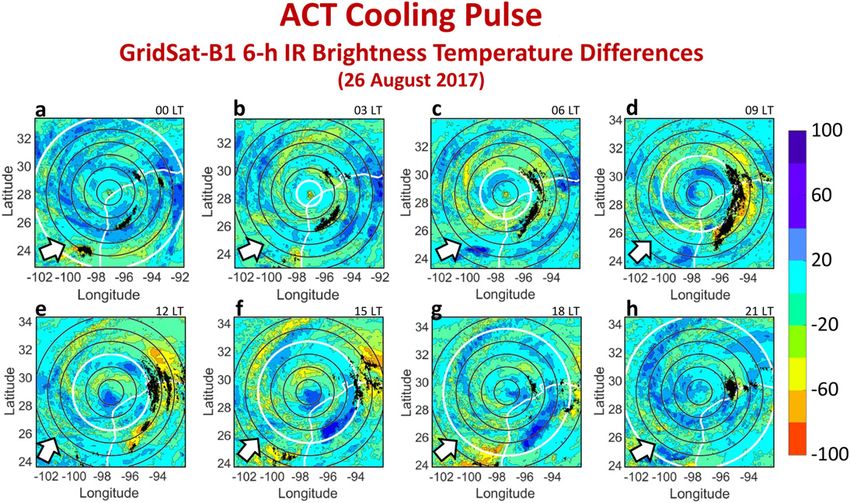
JUNE 2020                                              DITCHEK ET AL.                                                          2291

            FIG. 6. As in Fig. 1, but for 6-h IR brightness temperature difference fields (8C) on the ACT warming pulse day.

the shear was mostly southwesterly at 15.25 m s21 on av-             column-deep feature. Therefore, it is not surprising
erage, falling into the high-shear grouping, where high              that the corresponding 85–91-GHz microwave imagery
shear (.10.6 m s21) was defined as the upper quartile of             evolution depicted that the off-the-clock ACT cooling
the climatological distribution of shear values from                 pulse was comprised of elevated cloud ice content,
Ditchek et al. (2019a).                                              while the warming pulse was absent of cloud ice
                                                                     (Fig. 7). It is also not surprising that reflectivity was
a. Observations
                                                                     elevated within the off-the-clock ACT cooling pulse
   The 6-h IR brightness temperature difference                      and that the warming pulse itself had lower values of
evolution with overlaid lightning for the ACT                        reflectivity (Fig. 8).
warming pulse every 3 h from 0000 to 2100 LT is given
                                                                     b. Reproducibility of the observed ACT
in Fig. 6. The ACT warming pulse can be seen fol-
                                                                        warming pulse
lowing the Dunion et al. (2014) clock (white circles;
Fig. 6). The lightning, however, was actually part                      The analyses of the 0600 UTC (0000 LT) 28 August–
of an off-the-clock ACT cooling pulse that propa-                    0300 UTC (2100 LT) 29 August initializations of the
gated outward ahead of the warming pulse. This                       HRRR were used to determine whether the warming
off-the-clock ACT cooling pulse preceding a warming                  pulse and associated off-the-clock ACT cooling pulse
pulse was also found in Figs. 7e and 7g of Ditchek                   were reproduced by the model. The plan-view evolution
et al. (2019b).                                                      of the 6-h simulated IR brightness temperature differ-
   Both the warming pulse and the off-the-clock ACT                  ences showed both the warming pulse as well as the off-
cooling pulse propagated outward on the right-of-shear               the-clock ACT cooling pulse, as found in observations
side of the storm, the dominant side for lightning activity          (not shown). Additionally, the azimuthally averaged,
outside of the inner core and the side often associated with         simulated, IR brightness temperatures and corresponding
ACT pulses (Ditchek et al. 2019b). Hereafter, discussion             6-h simulated, IR brightness temperature differences
will mainly focus on this off-the-clock ACT cooling pulse.           (Figs. 9a,b) depicted an off-the-clock ACT cooling pulse,
   As with the ACT cooling pulse that occurred two                   trailed by an on-the-clock warming pulse, that had a similar
days prior, the abundant lightning present in the off-               timing and propagation speed as the observations
the-clock ACT cooling pulse implies that it was a                    (Figs. 9c,d). The structures of the warming pulses,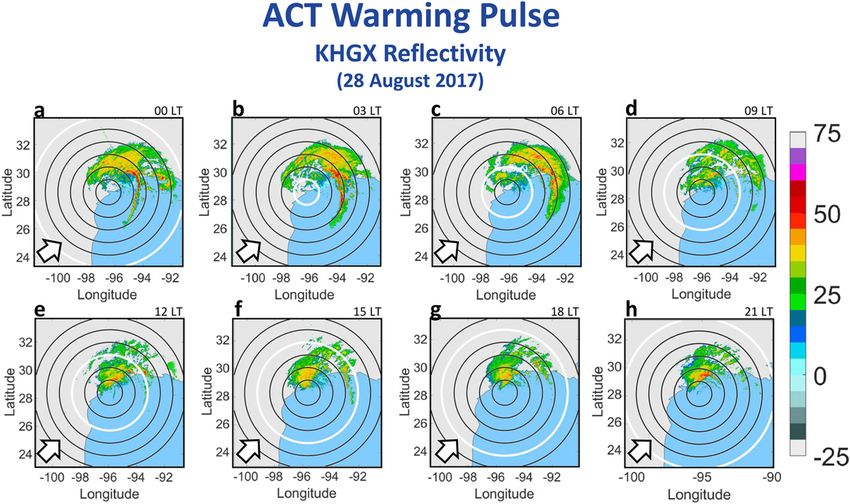
2292                                        MONTHLY WEATHER REVIEW                                                         VOLUME 148

       FIG. 7. As in Fig. 1, but for 85–91-GHz microwave imagery (K) without overlaid lightning on the ACT warming pulse day.

               FIG. 8. As in Fig. 1, but for reflectivity (dBZ) without overlaid lightning on the ACT warming pulse day.
JUNE 2020 DITCHEK ET AL. 2293
FIG. 9. As in Fig. 4, but for 0600 UTC (0000 LT) 28 Aug–0300 UTC (2100 LT) 29 Aug from (a),(b) the HRRR and
from (c),(d) the observations.
however, were slightly different: the observed radial wind, and tangential wind (Fig. 10).5 Azimuthal av-
warming pulse peaked in magnitude around 0800 LT erages were again conducted over the eastern half
while the HRRR warming pulse peaked in magni- of Harvey, as that was where the off-the-clock ACT cooling
tude around 1200 LT. This difference implies that pulse was mainly located (Fig. 6). For reference, a diagram
the observed warming pulse was a more coherent of this sector is included in Fig. 10. Again, for brevity, sector-
feature earlier in the day at a smaller radius than the averaged cross sections are shown every 6 h, instead of 3 h.
HRRR warming pulse. Despite these structural The off-the-clock ACT cooling pulse (white dashed
differences, the spatial representation and propa- vertical lines) was associated with outward propagating,
gation speed similarities between the HRRR and the enhanced total condensate. At 0000 LT, enhanced total
observations indicate that the HRRR was able to condensate values were most prominent at upper and
reproduce key aspects of the ACT warming pulse. midlevels (Fig. 10a). By 0600 LT, the off-the-clock ACT
cooling pulse also had a more cohesive low-level total
c. Thermodynamic and kinematic properties from
condensate component (Fig. 10b). At 1200 LT, the off-the-
the HRRR
clock ACT cooling pulse continued propagating outward
As with the ACT cooling pulse, in order to depict the (Fig. 10c) and by 1800 LT was beyond the 600-km radius
anomalous thermodynamic and kinematic properties
associated with the off-the-clock ACT cooling pulse,
anomalies from daily mean, sector-averaged cross 5
Qualitatively similar results were again found when taking 6-h
sections were taken for total condensate, temperature, differences instead of anomalies from the daily mean.2294 MONTHLY WEATHER REVIEW VOLUME 148
FIG. 10. As in Fig. 5, but for the ACT warming pulse day at 0000, 0600, 1200, and 1800 LT. The additional dashed white vertical lines
indicate the radius around which the off-the-clock ACT pulse occurred.
so it does not appear in Fig. 10d. The ACT warming The off-the-clock ACT cooling pulse was associated
pulse itself was associated with locally lower total with anomalous radial inflow that converged with
condensate values and propagated outward over the anomalous radial outflow between 700 and 1000 hPa
course of the day. with divergence aloft between 400 and 600 hPa at 0000 LT
As with the ACT cooling pulse, the off-the-clock ACT (Fig. 10i). This pattern continued through 1200 LT
cooling pulse was associated with anomalous cool tem- (Figs. 10j,k) and implies that the off-the-clock ACT
peratures that propagated outward at low levels be- cooling pulse was associated with an overturning cir-
tween 900 and 1000 hPa from 0000 to 1200 LT, implying culation. Additionally, at 0600 LT between 700 and
that the off-the-clock ACT cooling pulse produced a 1000 hPa at the axis of the warming pulse (solid white line),
cold pool in its wake, consistent with the results of anomalous radial outflow was located radially outward of
Dunion et al. (2019) (Figs. 10e–g). weaker anomalous radial inflow – a divergence signatureJUNE 2020 DITCHEK ET AL. 2295
squall lines. This section will investigate the initiation
mechanisms of those two pulses.
In the 6-h IR brightness temperature difference
evolution of the ACT cooling pulse and the off-the-
clock ACT cooling pulse, the pulses appeared to begin
around the 100–200-km radius. This timing is consis-
tent with the composite results of Ditchek et al.
(2019a,b) and the diurnal clock of Dunion et al. (2014);
however, whether the pulse actually formed at that
radius before propagating outward is unclear. If pulses
originated within the 100–200-km radial band, they
might not be apparent in the 6-h IR brightness tem-
perature difference evolution since their signatures
were too weak to be seen or since a higher spatial and/or
temporal resolution is needed to detect them. Therefore, it
is important to determine whether there are outward
propagating features present in the inner core of Harvey
that later become the pulses. One such outward propagat-
FIG. 11. A cross-sectional schematic of ACT pulse structure based
ing feature might be inner rainbands. While the diurnal
on Figs. 5 and 10. The right side of the graphic depicts the range of
levels over which the daily mean radial outflow and inflow occur. pulse is not necessarily a rainband, it is associated with
tropical squall-line characteristics (Figs. 5 and 10) and
probably due to subsidence associated with the warming rainband-like features (Figs. 3 and 8).
pulse (Fig. 10j). This divergence signature was also found Numerical modeling and observational studies have
at 1200 LT and at 1800 LT near the warming pulse been conducted that explore how inner rainbands can
(Figs. 10k,l). Additionally, in the outflow layer (100– become principal and distant rainbands. In an idealized
300 hPa), there was enhanced radial outflow at the times tropical cyclone simulation, Li and Wang (2012a,b)
of the strongest pulse signature. found that outward propagating inner rainbands were
Finally, the off-the-clock ACT cooling pulse was asso- stretched in the rapid filamentation zone (RFZ): the
ciated with an area of outward propagating, anomalous region where deep-convective clouds cannot form or
cyclonic flow. At 0000 LT, this anomalous cyclonic be sustained since the deformation is much larger than
flow was maximized at low levels (Fig. 10m), indicative the vorticity, corresponding to filamentation times of
of a low-level jet. Between 0600 and 1200 LT, it was less than 30–45 min (Rozoff et al. 2006). Once beyond
maximized at upper levels (Figs. 10n,o). By 1800 LT, the the RFZ, if the environment is favorable for deep con-
low-level signature was gone, as the off-the-clock ACT vection, the inner-rainband remnants can reinvigorate and
cooling pulse was beyond the 600-km radius. form an outer spiral rainband.
Therefore, the HRRR depicts that the off-the-clock Li et al. (2017) expanded on the Li and Wang (2012b)
ACT cooling pulse also had characteristics reminis- results by introducing vertical wind shear into their nu-
cent of tropical squall lines found in tropical cyclone merical model. With the introduction of shear, three
rainbands. Rainband-like features associated with different initiation mechanisms for inner rainbands be-
the off-the-clock ACT cooling pulse were also seen came apparent: 1) convectively coupled vortex Rossby
using NEXRAD reflectivity (Fig. 8). waves (VRWs) propagated radially outward at around
Since both ACT pulses in Harvey had similar structures, a 9.5 m s21 in the downshear half of the storm and accu-
summary schematic is given in Fig. 11. Again, these features mulated at the stagnation radius, often 3 times the radius
are reminiscent of the structure of tropical squall lines and of maximum wind (RMW) and the outer extent of inner-
tropical cyclone rainbands found in the literature (e.g., core circulation (e.g., Montgomery and Kallenbach
Barnes et al. 1983; Powell 1990a,b; Hence and Houze 2008; 1997; Reasor et al. 2000; Corbosiero et al. 2006); 2) weak
Houze 2010; Didlake and Houze 2009; Dunion et al. 2019). convective cells present in the upshear-right quadrant of
the storm were advected and strained downshear (Moon
and Nolan 2015b); and, 3) multiple strained convective
6. A hypothesis for pulse initiation
cells merged downshear (Moon and Nolan 2015b).
Sections 4 and 5 documented the evolution of two Regardless of the inner-rainband formation mechanism,
representative ACT diurnal pulses present in Harvey if the inner rainbands propagated outward beyond the
and evaluated whether those pulses behaved like tropical region dominated inner-core dynamics (around 3 times2296 MONTHLY WEATHER REVIEW VOLUME 148
the RMW) into an area favorable for deep convection, approximately 5-min temporal resolution, NOAA’s
they were able to become outer rainbands, thus cor- Weather and Climate Toolkit was again used, but at
roborating the earlier results of Li and Wang (2012b). 30-min intervals from: 1) KCRP beginning at 1800 LT
More recently, Yu et al. (2018) used radar analyses to the day before through 0600 LT the day of the ACT
study outer tropical cyclone rainbands as they ap- cooling pulse, and 2) KHGX beginning at 1200 LT
proached Taiwan between 2003 and 2015 with the goal the day before through 0000 LT the day of the ACT
of quantifying how often squall-line structures were warming pulse. The reason for this 6-h time difference
present. They found that around 60% of their sample was so that the origin of the off-the-clock ACT cooling
had squall-line-like airflow patterns (i.e., were associ- pulse could be determined. To generate storm-centered
ated with converging airflow at low levels and cold grids of the radar data, the HURDAT2 data described in
pools). These patterns were also found by Yu and Tsai section 2 were linearly interpolated to a temporal reso-
(2013). From their analysis, Yu et al. (2018) speculated lution of 30 min.
that rainbands propagated from the inner, wave-dominant While the location of the RFZ could not be deter-
region to the outer region of a tropical cyclone where mined from observations, the location of the stagnation
squall-line dynamics took over. Thus, their results did radius (around 3 times the RMW) was estimated using
not conflict with the wave-dynamics interpretation of four times daily operational estimates of the RMW for
tropical cycle inner rainbands. the ACT cooling and off-the-clock ACT cooling pulse
The literature has, therefore, provided evidence on days from the ‘‘extended best track’’ dataset (EBT;
how outer rainbands can be formed from inner rainbands. Demuth et al. 2006) that were linearly interpolated to a
Since the diurnal pulses in Harvey were found to be as- temporal resolution of 30 min.
sociated with tropical squall-line characteristics (Figs. 5
b. Results
and 10) and rainband-like features (Figs. 3 and 8), the
hypothesis for diurnal pulse initiation is, therefore, simi-
1) ACT COOLING PULSE
lar to the mechanism for inner-to-outer rainband trans-
formation: inner rainbands that propagate outward into Figure 12 depicts the evolution of the KCRP re-
a more favorable environment for deep convection flectivity data every 30 min beginning at 1800 LT the
take on tropical squall-line characteristics. The enhanced day before through 0600 LT the day of the ACT
convection then becomes visible in the 6-h IR brightness cooling pulse. Between 1800 and 1830 LT the day
temperature differences as a diurnal pulse and propa- before the ACT cooling pulse occurred, an inner
gation is furthered by a low-level cold pool. Inner- rainband (yellow shading) propagated away from the
rainband occurrence is not diurnal, however (e.g., eyewall on the western side of the storm (purple ar-
Corbosiero et al. 2006; Moon and Nolan 2015a,b). row). This rainband then propagated cyclonically
Therefore, the timing of their outward propagation must around the storm, was filamented by the flow, and was
be key to diurnal-pulse formation. Since the literature located at the estimated stagnation radius (red circle)
has found that there is an overnight and early morning on the eastern side of the storm by 1900–2000 LT.
peak of inner-core deep convection, lightning, and From 2030 to 2230 LT, the RMW and, therefore, stag-
tropical cyclone rainfall (Ditchek et al. 2019a, Fig. 1), it nation radius, contracted slightly, and so the remnants of
is speculated that inner rainbands that propagate out- the filamented inner rainband became located outside of
ward overnight and in the early morning would enter an the stagnation radius. Shortly thereafter, convection re-
environment that is more favorable for deep convection invigorated around 150 km and remained stationary be-
and, therefore, become the diurnal pulses seen in the 6-h tween 0000 and 0330 LT. By 0400 LT, the rainband
IR brightness temperature differences. began propagating outward so that by 0600 LT it was
It is important to note that the aim of this section is not located around the 200–300-km radius. This rainband is
to determine the formation mechanisms of inner and outer the ACT cooling pulse seen in Figs. 1–3.
rainbands, or to claim that diurnal pulses are rainbands. By examining the sector-averaged, radius–time evo-
Rather, it is to understand whether inner rainbands were lution of the reflectivity data depicted in Fig. 12 (not
the preceding structure to the diurnal pulses in Harvey. shown), it was found that the outward-propagating inner
rainband had a slower propagation speed than the ACT
a. Data and methods
cooling pulse: 6.2 m s21 between 75 and 125 km and
To determine whether the ACT cooling and off-the- 4.4 m s21 between 125 and 200 km. These speeds are
clock ACT cooling pulses formed from inner rainbands, consistent with VRW theory (e.g., Montgomery and
a data source with high temporal and spatial resolution Kallenbach 1997; Corbosiero et al. 2006) and, therefore,
is needed. Since the NEXRAD reflectivity data has an the presence of the inner rainband is consistant withJUNE 2020 DITCHEK ET AL. 2297 FIG. 12. A plan view of storm-centered KCRP NEXRAD reflectivity data (dBZ) every 30 min from 1800 LT the day before through 0600 LT the day of the ACT cooling pulse. Black range rings are overlaid on each image every 100 km from r 5 100–300 km. White range rings indicate the radius at which the pulse should occur using the extended version of the Dunion et al. (2014) diurnal clock (Ditchek et al. 2019a, Fig. 2b). The red range ring indicates 3 times the RMW, the approximate location of the stagnation radius for VRWs. The purple arrows track the evolution of the ACT cooling pulse. Coastlines were removed from these graphics for aesthetic reasons. the first inner-rainband initiation mechanism detailed associated reflectivity fields from Fig. 12. The three times by Li et al. (2017). chosen include: 1) 1930 LT—when the inner rainband was To determine whether the environment into which stalled at the stagnation radius, 2) 2130 LT—after the the inner rainband moved was favorable for deep inner rainband moved beyond the stagnation radius, convection, CAPE from the HRRR was retrieved the and 3) 2330 LT—when convection reinvigorated. day prior to the ACT cooling pulse. Three representa- At all times, CAPE was found to be elevated in the tive times are given in Fig. 13 and are overlaid with the Gulf of Mexico, just outside of the 100-km radius.
2298                                        MONTHLY WEATHER REVIEW                                                  VOLUME 148

                                                                     As the inner rainband moved beyond the stagnation
                                                                     radius on the eastern side of Harvey, it moved into a
                                                                     region more favorable for deep convection. By 2330 LT,
                                                                     the inner rainband had already reinvigorated and CAPE
                                                                     was found to be decreased in that region.
                                                                       The hypothesis for ACT pulse initiation is, therefore,
                                                                     supported.
                                                                       2) ACT WARMING PULSE
                                                                       The off-the-clock ACT cooling pulse was found to
                                                                     propagate outward around 6 h earlier than an on-the-
                                                                     clock pulse. Therefore, Fig. 14 depicts the evolution of
                                                                     the KHGX reflectivity data every 30 min beginning
                                                                     at 1200 LT the day before through 0000 LT the day
                                                                     of the off-the-clock ACT cooling pulse. The RMW
                                                                     was located around 140 km and, therefore, the esti-
                                                                     mated stagnation radius (around 420 km) is not visible
                                                                     in Fig. 14.
                                                                       The evolution of the off-the-clock ACT cooling pulse
                                                                     was different than that of the ACT cooling pulse.
                                                                     Between 1200 and 1900 LT the day prior to the off-the-
                                                                     clock ACT cooling pulse, multiple, discrete reflectivity
                                                                     features propagated outward, collecting just outside of
                                                                     the RMW at the 160-km radius. The high-reflectivity
                                                                     feature then began to intensify and convection invigo-
                                                                     rated both upwind and downwind between 1930 and
                                                                     2130 LT. Between 2200 and 0000 LT, the line of con-
                                                                     vection began to propagate outward as the off-the-clock
                                                                     ACT cooling pulse. Since the RMW was around the
                                                                     140-km radius, it is possible that convective features that
                                                                     formed near the RMW were strained by the flow and
                                                                     merged downshear to create a larger, well-organized
                                                                     rainband. This mechanism is similar to the third inner-
                                                                     rainband initiation mechanism detailed by Li et al. (2017).
                                                                     While not outside the stagnation radius, it will be shown
                                                                     that the rainband moved into an area favorable for deep
                                                                     convection.
                                                                       CAPE from the HRRR was retrieved the day prior
                                                                     to the off-the-clock ACT cooling pulse. Figure 15
                                                                     depicts three representative times overlaid with the
                                                                     associated reflectivity fields from Fig. 14. The three
                                                                     times chosen include: 1) 1930 LT—after the inner
                                                                     rainband formed, 2) 2130 LT—after convection be-
                                                                     gan to reinvigorate, and 3) 2330 LT—while the off-
                                                                     the-clock ACT cooling pulse began to propagate
                                                                     outward. As with the ACT cooling pulse, the envi-
                                                                     ronment into which the eastward propagating diurnal
                                                                     pulse moved was favorable for deep convection. The
  FIG. 13. A plan view of CAPE from the HRRR overlaid with           trailing warming pulse, on the other hand, was asso-
NEXRAD reflectivity (dBZ) from Fig. 12 for 1930 LT, 2130 LT,
and 2330 LT the day prior to the ACT cooling pulse. As in Fig. 12,
                                                                     ciated with a lack of CAPE, probably due to the de-
black range rings are overlaid on each image every 100 km from r 5   pletion of CAPE by the off-the-clock ACT cooling
100–300 km, the red range ring indicates 3 times the RMW, the        pulse. Additionally, CAPE across the Gulf of Mexico
approximate location of the stagnation radius for VRWs, and the      was higher the day prior to the off-the-clock ACT
purple arrows tracks the evolution of the pulses.
JUNE 2020 DITCHEK ET AL. 2299
FIG. 14. As in Fig. 12, but for KHGX NEXRAD reflectivity data (dBZ) from 1200 LT the day before through 0000 LT the day of
the ACT warming pulse.
cooling pulse than the day prior to the ACT cooling The hypothesis for ACT pulse initiation is, therefore,
pulse. Perhaps the overall more favorable environ- also supported by this case.
ment allowed for tropical squall-line dynamics to be-
gin sooner, which would allow for earlier propagation
7. Conclusions
by the low-level cold pool, thus explaining why the
ACT cooling pulse that occurred that day was off-the- Ditchek et al. (2019a) generated a climatology of
clock. More case studies of off-the-clock ACT cooling Atlantic basin tropical cyclone cooling and warming
pulses should be conducted to identify whether this is pulses over a 36-yr period by creating an objective
the case. metric to identify pulses with similar temporal phasing2300 MONTHLY WEATHER REVIEW VOLUME 148
as Dunion et al. (2014). By taking 6-h IR brightness
temperature differences of GridSat-B1 imagery, they
created their metric by using critical thresholds for
the magnitude of the IR brightness temperature dif-
ferences, areal coverage of cold cloud tops, and lon-
gevity. Ditchek et al. (2019b) then used WWLLN
lightning data from 2005 to 2017 to identify pulses that
were electrically active and pulses that were electrically
inactive based on an objective metric that incorporated
lightning flash density, areal coverage, and longevity
within a pulse.
Both Ditchek et al. (2019a,b) were composite stud-
ies. To gain further insight into pulse characteristics,
here, an ACT cooling pulse and an ACT warming pulse
that occurred in Hurricane Harvey (2017) were studied
in depth using observations as well as the HRRR
analysis fields, as the University of Utah MesoWest
HRRR archive only retained forecast hour 0 (i.e.,
the analysis) for three-dimensional fields. Since the
HRRR assimilates available observations, including
reflectivity, prior to each initialization, it was expected
that the structure and timing of both the ACT cooling
pulse and the off-the-clock ACT cooling pulse would be
reproduced. Using the HRRR, therefore, allowed for
the exploration of fields not readily obtainable from
observations.
A notable feature of the ACT warming pulse is that it
is associated with an off-the-clock ACT cooling pulse
that propagated outward ahead of the warming pulse.
Most of the results discussed in this paper, therefore,
focused on comparing the ACT cooling pulse to the off-
the-clock ACT cooling pulse with three main goals: 1) to
document the evolution of the pulses, 2) to evaluate
whether the pulses had tropical-squall-line characteris-
tics, and 3) to identify their initiation mechanisms.
The ACT cooling pulse and the off-the-clock ACT
cooling pulse were found to share many characteristics:
d Both pulses were identifiable in the 6-h IR brightness
temperature differences imagery and propagated out-
ward on the right-of-shear side of Harvey, the dominant
side for overall lightning activity outside of the inner
core (Figs. 1 and 6).
d Elevated cloud ice content was present in both the ACT
cooling pulse and the off-the-clock ACT cooling pulse,
as seen in the 85–91-GHz microwave imagery (Figs. 2
and 7), implying that the pulse was column deep.
d Both pulses were also associated with outward propa-
FIG. 15. As in Fig. 13, but with NEXRAD reflectivity (dBZ) from gating rainband-like reflectivity features (Figs. 3 and 8).
Fig. 14 for the day prior to the ACT warming pulse. d The HRRR was able to reproduce the structure and
timing of both the ACT cooling pulse and the off-the-
clock ACT cooling pulse, allowing for various fields in
the HRRR to be examined (Figs. 4 and 9).JUNE 2020 DITCHEK ET AL. 2301
d Using the HRRR, it was found that both the ACT waves since the HRRR model analyses did not provide
cooling pulse (Fig. 5) and the off-the-clock ACT vertical velocity fields.
cooling pulse (Fig. 10) were associated with: 1) ele- Furthermore, while it was found that the ACT cooling
vated total condensate that was column deep; 2) a pulse and off-the-clock ACT cooling pulse in Harvey
surface cold pool; 3) an overturning circulation; shared many similar characteristics, this paper could
and, 4) enhanced cyclonic flow at low levels. These not conclusively answer what caused the off-the-clock
characteristics are similar to those found in tropical ACT cooling pulse to be ‘‘off the clock’’. One hypothesis
squall lines. is that days that have an off-the-clock ACT cooling
pulse have environments that are more favorable for
Since the pulses were found to be associated with deep convection (cf. Figs. 13 and 15). Thus, tropical
tropical squall-line characteristics (Figs. 5 and 10) and squall-line dynamics would occur sooner and earlier
rainband-like features (Figs. 3 and 8), a hypothesis was propagation outward would be aided by a low-level
introduced for ACT pulse initiation: ACT pulses cold pool. Additionally, since Ditchek et al. (2019b)
originated from inner rainbands that propagated into a found that ACT warming pulses occurred most often in
more favorable environment for deep convection. At high shear environments, another hypothesis for the
these outer radii, they reinvigorated, taking on tropi- existence of off-the-clock ACT cooling pulses is that
cal squall-line characteristics. Using NEXRAD re- the wavenumber-1 asymmetry associated with highly
flectivity data, it was found that the ACT cooling pulse sheared storms could force a pulse to be off-the-clock.
formed from an inner rainband that propagated out- If so, then the on-the-clock warming pulse observed
ward beginning around 1800 LT the day before the would be the trailing warming typically associated
ACT cooling pulse occurred (Fig. 12) and that the off- with a cooling pulse. In direct contradiction to this hy-
the-clock ACT cooling pulse formed from multiple pothesis, however, is the fact that INACT warming
convective features that were strained by the flow and pulses were also found to occur in high-shear environ-
merged downshear to create a rainband (Fig. 14). The ments, but were not found to be associated with an off-
inner rainbands then moved into a high-CAPE envi- the-clock ACT or INACT cooling pulse (Ditchek et al.
ronment, where convection reinvigorated, taking on 2019b, Fig. 6).
tropical squall-line characteristics (Figs. 13 and 15). Additionally, INACT cooling pulses and warming
Further propagation was likely aided by the low-level pulses were not discussed in this paper, as INACT pulses
cold pool found in Figs. 5 and 10. Additional case in Harvey occurred before Harvey’s center was 400 km
studies of ACT pulses should be conducted to deter- from the southern HRRR boundary and after Harvey’s
mine how frequently these initiation mechanisms oc- final landfall. Since INACT cooling pulses could be as-
sociated with nonelectrified convection or could merely
curred for ACT cooling pulses and off-the-clock ACT
be a cirrus canopy feature, and since INACT warming
cooling pulses.
pulses were not associated with convection and had
While this case study provided a comprehensive
a propagation speed that did not support the gravity
analysis of an ACT cooling pulse and an off-the-clock
wave interpretation of diurnal pulses (Ditchek et al.
ACT cooling pulse associated with an identified ACT
2019b), a similar analysis as provided by this paper
warming pulse, there are still many questions that
should be conducted on a storm that had an INACT
remain unanswered. For example, recent papers have
warming pulse.
provided a gravity wave interpretation of diurnal
pulses (Navarro et al. 2017; O’Neill et al. 2017;
Acknowledgments. The authors wish to thank re-
Ruppert and O’Neill 2019; Evans and Nolan 2019). viewer John Knaff as well as two anonymous reviewers
The composite results of (Ditchek et al. 2019a) sup- for their insightful comments, which helped to improve
ported this theory, especially their finding that days the manuscript. GridSat-B1 IR brightness temperature
with enhanced, overnight convection were associated was acquired from NOAA’s National Centers for
with days that had cooling pulses, as diabatic heating is Environmental Information (https://www.ncdc.noaa.gov/
one source of gravity wave generation. Furthermore, cdr/fundamental/geostationary-ir-channel-brightness-
Ditchek et al. (2019b) found that the propagation temperature-gridsat-b1). The authors wish to thank the
speed of ACT cooling and warming pulses was con- World Wide Lightning Location Network (http://wwlln.net),
sistent with that of gravity waves. Other than the fact a collaboration among over 50 universities and institutions,
that the pulses had similar propagation speeds to for providing the lightning location data used in this
gravity waves, this case study, however, could not make paper. Additionally, the authors thank the University of
any connections between the ACT pulses and gravity Utah MesoWest HRRR archive for providing access to2302 MONTHLY WEATHER REVIEW VOLUME 148
FIG. A1. Azimuthally summed WWLLN lightning flash data (hatched for values $25 flashes) overlaid onto
azimuthally averaged (a) IR brightness temperatures (8C) and (b) 6-h IR brightness temperature differences (8C)
over the lifetime of Hurricane Harvey (2017). Black vertical lines correspond to 0000 LT on each day. White dashed
lines indicate landfall in the continental United States (Blake and Zelinsky 2017). Red text indicates 0000 LT on the
two representative days detailed in this paper. The colored squares represent the intensity of Harvey according to
the Saffir–Simpson hurricane wind scale (Simpson 1974) categories: tropical depression (dark blue), tropical storm
(cyan), category 1 (green), category 2 (yellow), category 3 (orange), category 4 (red), and category 5 (magenta). The
dark blue triangles represent times when the storm was designated as a low, wave, or extratropical by HURDAT2.
The pulse type and electric activity classification for each day is listed under the x-axis labels and was determined by
the objective metrics in Ditchek et al. (2019a,b). An ‘‘3’’ below the x-axis labels indicates that the objective metric
was not run for that date.
HRRR data (Blaylock et al. 2017). All authors were diurnal pulses that occurred over Harvey’s lifetime
supported by NSF Grant AGS1636799. using azimuthally averaged IR brightness temperatures
(Fig. A1a) and azimuthally averaged 6-h IR brightness
APPENDIX temperatures differences (Fig. A1b) both with overlaying
azimuthally summed WWLLN lightning flash data
(hatched for values $25 flashes). Azimuthal averages
Lifetime Diurnal-Pulse Activity in Hurricane
were computed using a 0.078 bin size, matching the
Harvey (2017)
GridSat-B1 resolution, were sorted into bins centered on
As detailed in section 3, while Harvey occurred over the hour, and were averaged.
an 18-day period, there were only 16 full (0000–2300 LT) Between 0000 LT 17 August and 2300 LT 21 August,
storm days. Each of those days was first given a pulse- Harvey experienced multiple expansions and contrac-
type classification using the objective metric from tions of cold cloud tops (,2358C) and lightning
Ditchek et al. (2019a). Cooling and warming pulse days (Fig. A1a). The associated 6-h IR brightness temper-
were then classified based on their electric activity using ature differences and lightning depict outward prop-
the objective metric from Ditchek et al. (2019b). agating cooler cloud tops (Fig. A1b) that the objective
Two representative pulse days were chosen to be metrics identified as one INACT SLCP and four ACT
studied in this paper. But, since the lifetime diurnal-pulse LLCPs. It was not surprising that pulses were occur-
activity in a single storm has never been documented, ring when Harvey was a tropical storm and tropical
this appendix will now detail the different types of depression, since Ditchek et al. (2019a) found thatYou can also read