Exercise improves the quality of slow wave sleep by increasing slow wave stability
←
→
Page content transcription
If your browser does not render page correctly, please read the page content below
www.nature.com/scientificreports
OPEN Exercise improves the quality
of slow‑wave sleep by increasing
slow‑wave stability
Insung Park1,7, Javier Díaz1,7, Sumire Matsumoto1, Kaito Iwayama2, Yoshiharu Nabekura3,
Hitomi Ogata4, Momoko Kayaba5, Atsushi Aoyagi3, Katsuhiko Yajima6, Makoto Satoh1,
Kumpei Tokuyama1 & Kaspar E. Vogt1*
Exercise can improve sleep by reducing sleep latency and increasing slow-wave sleep (SWS). Some
studies, however, report adverse effects of exercise on sleep architecture, possibly due to a wide
variety of experimental conditions used. We examined the effect of exercise on quality of sleep using
standardized exercise parameters and novel analytical methods. In a cross-over intervention study we
examined the effect of 60 min of vigorous exercise at 60% V̇O2max on the metabolic state, assessed
by core body temperature and indirect calorimetry, and on sleep quality during subsequent sleep,
assessed by self-reported quality of sleep and polysomnography. In a novel approach, envelope
analysis was performed to assess SWS stability. Exercise increased energy expenditure throughout
the following sleep phase. The subjective assessment of sleep quality was not improved by exercise.
Polysomnography revealed a shorter rapid eye movement latency and reduced time spent in SWS.
Detailed analysis of the sleep electro-encephalogram showed significantly increased delta power in
SWS (N3) together with increased SWS stability in early sleep phases, based on delta wave envelope
analysis. Although vigorous exercise does not lead to a subjective improvement in sleep quality, sleep
function is improved on the basis of its effect on objective EEG parameters.
Epidemiologic studies indicate that insufficient sleep and/or poor sleep quality are associated with multiple
adverse effects on health, such as an increased risk for hypertension, type 2 diabetes, and o besity1–4. Insufficient
sleep is also associated with anxiety, depression, and an increased risk for other psychiatric d isorders5–7. Physical
exercise is recommended by academic sleep associations as a low-cost, easily administered, and non-pharmaco-
logic intervention for improving sleep8–11. A number of studies have demonstrated that a single bout of exercise
can decrease sleep onset latency and wake after sleep onset while simultaneously increasing sleep efficiency and
slow-wave sleep (SWS)12–15. Some studies also report that repeated exercise can induce more salient, chronic
effects on the sleep architecture14,15. Other studies, however, report few, or even adverse, effects of exercise on
the sleep architecture. In healthy young participants, SWS duration was decreased by moderate exercise with an
intensity of 35%-45% of maximal oxygen consumption (V̇ O2max)16,17. Another study reported no significant
differences in the total sleep time and SWS in healthy young men and women exercising at 45%, 55%, 65%, or
75% of the V̇ O2max compared to a trial without exercise18. Yet another study reported that 12 weeks of exercise
training did not alter the duration of SWS and sleep latency in young female participants19. Although several
investigators have attempted to explain these discrepancies by examining differences in experimental protocols
such as the sex, age, and exercise habits of the participants, and in the exercise regimen (type, intensity, duration
of exercise, and time of day to exercise), the discrepancies in the effects of exercise on sleep remain to be fully
explained.
For more than half a century, since 1968, sleep has been evaluated by applying standardized scoring criteria
to electroencephalogram (EEG) and electromyogram recordings established by Rechtschaffen and K ales20. We
hypothesized that the discrepancies in the effect of exercise on sleep architecture may at least in part originate
from the semi-quantitative nature of this sleep-stage scoring. For example, an epoch is scored as sleep stage N3
1
International Institute for Integrative Sleep Medicine (WPI‑IIIS), University of Tsukuba, 1‑1‑1 Tennodai, Tsukuba,
Ibaraki, Japan. 2Faculty of Budo and Sport Studies, Tenri University, Tenri, Japan. 3Faculty of Health and Sports
Sciences, University of Tsukuba, Tsukuba, Japan. 4Graduate School of Humanities and Social Sciences, Hiroshima
University, Hiroshima, Japan. 5Department of Somnology, Tokyo Medical University, Tokyo, Japan. 6Faculty of
Pharmaceutical Sciences, Josai University, Saitama, Japan. 7These authors contributed equally: Insung Park and
Javier Diaz. *email: vogt.kaspar.fu@u.tsukuba.ac.jp
Scientific Reports | (2021) 11:4410 | https://doi.org/10.1038/s41598-021-83817-6 1
Vol.:(0123456789)
www.nature.com/scientificreports/
Figure 1. Study protocol. The schedule of the control day (upper bar) and exercise day (bottom bar). For
participants whose habitual bedtime is at 00:00, indirect calorimetry begins at 11:00 and ends at 08:00 of
the next morning, as shown by the dotted rectangles. Participants exited the metabolic chamber at 19:00 for
preparation of the polysomnographic measurement and reentered at 21:00. Gray, red, and white boxes represent
sleep (00:00–08:00), exercise (17:00–18:00), and wakefulness (08:00–24:00), respectively. Breakfast, lunch, and
dinner are denoted by B, L, and D, respectively.
or SWS when slow-wave EEG (0.5–2 Hz) with an amplitude greater than 75 µV is observed for more than 20%
of a 30-s epoch. A further increase in the amplitude or duration of EEG slow waves does not affect sleep scoring,
thereby potentially masking meaningful effects.
As a more quantitative approach to determining sleep depth and quality21, the delta (δ) power (typically
0.5–4 Hz) of the EEG is evaluated using fast-Fourier t ransformation22. Studies assessing the effects of exercise
on EEG δ power have produced mixed results. A number of studies demonstrated that exercise is associated
with an increase in δ power during subsequent s leep23,24. Young, fit participants also exhibited increased δ
power (0–3.9 Hz) after a 30- or 42-km cross-country running r ace23. In addition, a recent study showed that δ
power (0.5–4 Hz) was increased by a moderate (40% of V̇ O2max) bicycle ergometer workout in healthy male
participants24. In another study, trained athletes who exercised daily at moderate to high intensity were requested
to remain sedentary in the laboratory for an entire day, and investigators found no significant differences in the
δ power (0.33–3 Hz) between the exercise and sedentary d ays25.
A novel computational method for analyzing EEG waves based on envelope analysis was proposed in 2 01826.
The envelope of a signal in a given frequency band, obtained through its Hilbert transformation, can be viewed
as a representation of the instantaneous power in this band. The coefficient of variation of this measure shows
how much this power varies over time. The coefficient of variation of the envelope (CVE) thus provides a scale-
independent measure of the temporal stability of an oscillation. Low CVE values are found for stable sinusoidal
oscillations, intermediate CVE values indicate Gaussian oscillations, and high CVE values are a sign of irregular
phasic processes26. We used CVE analysis as a novel tool to investigate the effect of exercise on sleep to examine
not only the power of the EEG δ waves generated, but also the stability of these waves.
The present study evaluated the effects of a single bout of vigorous exercise in young healthy men on the meta-
bolic state of subsequent sleep and its quality. We wanted to determine, whether exercise improved or decreased
sleep quality and whether short exercise bouts can exert lasting effects on the metabolic state.
Results
Participant characteristics. The participant characteristics were (mean ± SEM): age 23.8 ± 0.7 years,
weight 66.6 ± 2.2 kg, body fat 17.6 ± 0.01%, and BMI 22.8 ± 0.6 kg/m2. The average V̇ O2max was 55.27 ± 5.29 ml/
kg/min. All participants completed 2 trials, and there were no significant differences in weight, body fat, and
BMI among the trials. All participants fulfilled all inclusion/exclusion criteria (Fig. 1).
Lasting effects on metabolic state. As expected, energy expenditure increased during the exercise
period (control trial: 88 ± 3 kcal/h vs. exercise trial: 676 ± 25 kcal/h, p < 0.001; Fig. 2A). As a consequence, oxygen
consumption during exercise increased up to 747% (control trial: 0.30 ± 0.01 L/min vs. exercise trial: 2.27 ± 0.08
L/min), HR increased by 238% (control trial: 65 ± 3 beats/min vs. exercise trial: 154 ± 4 beats/min), and core
body temperature increased by 0.70 °C (control trial: 36.91 ± 0.07 °C vs. exercise trial: 37.61 ± 0.11 °C) above the
sedentary condition. Hourly means of the core body temperature during exercise and 1 h post-exercise were also
higher in the exercise trials compared with the control trial. A 2-factor repeated measures ANOVA identified a
significant effect of time (p < 0.0001) and interaction (p < 0.0001), although the main effects of group were not
significant (Fig. 2B).
The mean core body temperature throughout the post-exercise sleep period was not significantly different
from that during the control trials (control trials: 36.35 ± 0.06 °C vs. exercise trials: 36.28 ± 0.04 °C, p = 0.40).
The hourly core body temperature curves during the sleep period differed between the 2 conditions. A 2-factor
repeated measures ANOVA showed no effect of exercise (p = 0.4119), but a significant effect of time (p < 0.0001)
and a significant interaction between exercise and time (p = 0.007; Fig. 2B). Energy expenditure remained ele-
vated throughout sleep after exercise (control trial: 526 ± 15 kcal/8 h vs. exercise trial: 544 ± 17 kcal/8 h, p < 0.05;
Fig. 2A). Thus, even several hours after a bout of vigorous exercise, the metabolic state was altered in subsequent
sleep.
Scientific Reports | (2021) 11:4410 | https://doi.org/10.1038/s41598-021-83817-6 2
Vol:.(1234567890)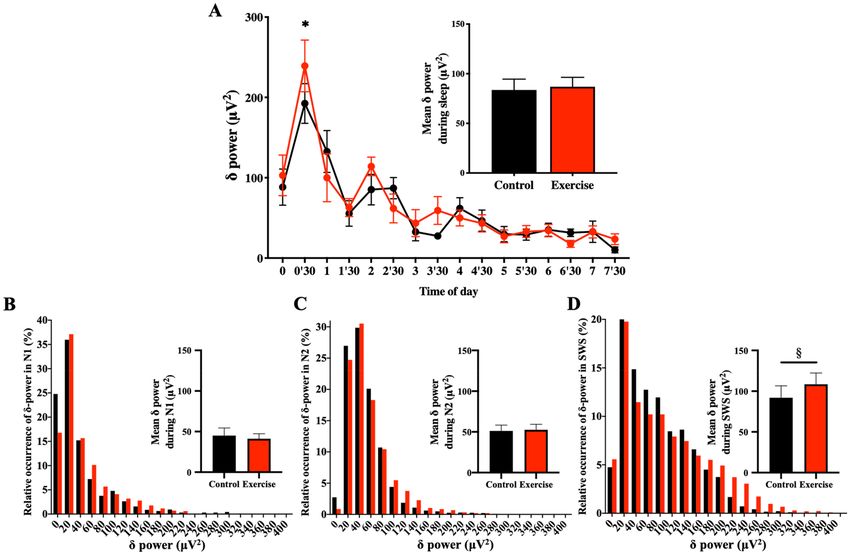
www.nature.com/scientificreports/

                                  Figure 2.  Time-course of energy expenditure and core body temperature. Time-course of energy expenditure
                                  (A) and core body temperature (B) during the entire experiment is shown. Hourly means ± SE are shown for
                                  control (filled black circle) and exercise trials (filled red circle), respectively. The red bar at the bottom represents
                                  exercise or a sedentary period, and the gray area represents the sleep period. To attach PSG electrodes,
                                  participants exited from the metabolic chamber (19:00–21:00). *Represents a statistically significant difference
                                  between control and exercise trials by post hoc comparisons using Bonferroni’s correction for multiple
                                  comparisons (*p < 0.05).

                                                                         Control      Exercise
                                   Parameters                            Mean         Mean         p
                                   Sleepiness on rising                  20.0 ± 1.4   19.5 ± 2.0   0.80
                                   Sleep duration                        16.7 ± 1.8   19.1 ± 1.7   0.37
                                   Initiation and maintenance of sleep   16.5 ± 2.5   17.7 ± 2.4   0.46
                                   Refreshness                           22.9 ± 1.1   16.8 ± 2.4   0.03*
                                   Frequent dreaming, nightmares         19.6 ± 1.1   23.1 ± 1.4   0.02*

                                  Table 1.  Subjective parameters by OSA sleep inventory MA version (mean ± standard error). OSA The Oguri
                                  Shirakawa and Azumi standard rating scale, MA middle age and aged version. *p < 0.05.

                                  Subjective assessment of sleep quality.            Subjective sleep quality on the basis of responses to the OSA-
                                  MA questionnaire differed for ’Refreshness’ and ’Frequent Dreaming or Nightmares’ between the exercise and
                                  control conditions, with no significant differences in the other parameters (’Sleepiness on Rising’, ’Initiation and
                                  Maintenance of Sleep’, and ’Sleep Length’; Table 1). Thus vigorous exercise did not improve the subjective assess-
                                  ment of the sleep quality.

Scientific Reports |   (2021) 11:4410 |                    https://doi.org/10.1038/s41598-021-83817-6                                                     3

                                                                                                                                                    Vol.:(0123456789)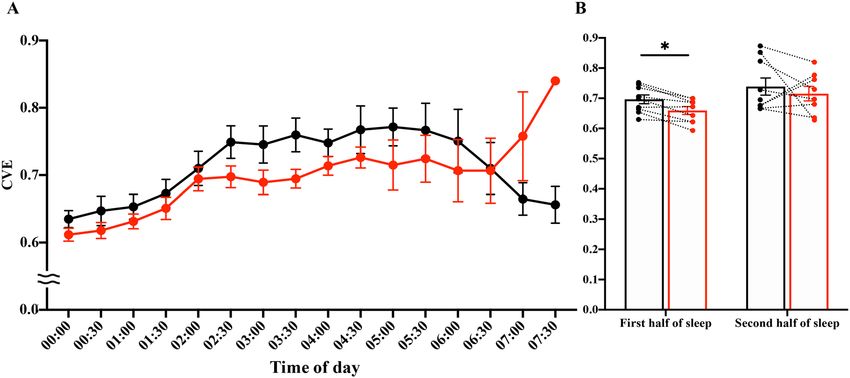
www.nature.com/scientificreports/
Control Exercise
Parameters Mean Mean p
Total bedtime (min) 480.0 480.0
Total sleep time (min) 449.8 ± 8.1 459.6 ± 5.9 0.14
Wakefulness (min) 21.9 ± 7.1 15.5 ± 4.0 0.36
Sleep latency (min) 5.6 ± 1.9 4.6 ± 1.7 0.43
Sleep efficiency (%) 93.5 ± 1.6 95.5 ± 1.2 0.15
Stage 1 (min) 42.3 ± 5.0 48.2 ± 5.2 0.20
Stage 2 (min) 228.5 ± 10.5 236.6 ± 11.4 0.25
SWS (min) 101.6 ± 7.2 90.8 ± 6.9 0.01**
REM sleep (min) 76.4 ± 4.7 82.6 ± 8.7 0.53
REM sleep latency (min) 107.7 ± 14.2 80.1 ± 7.6 0.03*
Table 2. Sleep Architecture (mean ± standard error). SWS slow-wave sleep, REM rapid eye movement.
*p < 0.05, **p < 0.01.
Objective assessment of sleep quality. Basic sleep architecture (i.e., durations of stage 1, stage 2, SWS,
REM, and wakefulness after sleep onset) was largely unchanged between the conditions; with the exception
of REM, SWS sleep latency, and SWS duration, which were shorter following exercise (Table 2 and Fig. 3).
Shortened SWS durations were limited to the first sleep cycle (64.39 ± 5.65 vs. 48.61 ± 3.73 min for control
and exercise trials, p = 0.019). SWS episode durations in subsequent sleep cycles were not significantly dif-
ferent (20.28 ± 2.42 min vs. 26.17 ± 4.00 min for control and exercise trials during the second cycle, p = 0.176;
10.17 ± 2.79 min vs. 10.00 ± 2.72 min for control and exercise trials during the third cycle, p = 0.780). At first
glance, these results indicate a decrease in slow wave activity. To further evaluate this finding, we investigated
the power of the δ oscillations in detail. Overall mean δ power throughout the whole sleep period (control trials:
83.67 ± 10.85 μV2 vs. exercise trials: 86.88 ± 9.54 μV2, p = 0.425) was not significantly different between condi-
tions (Fig. 4A). Interestingly, however, δ power in SWS (N3) was significantly larger in the exercise condition
(108.4 ± 13.9 μV2) than in the control condition (92.0 ± 14.6 μV2; p = 0.047). Mean δ power in N1 (45.1 ± 9.3 μV2
vs. 41.2 ± 6.2 μV2 for control and exercise trials, p = 0.645) and N2 (51.2 ± 7.1 μV2 vs. 52.6 ± 6.8 μV2 for control
and exercise trials, p = 0.711) was similar between conditions. As a consequence, δ wave energy generated over
the shortened SWS period was actually larger in the exercise condition compared with the control condition
(Fig. 4B–D).
We also performed a detailed examination of the time course of δ wave power throughout sleep. A 2-factor
repeated measures ANOVA revealed a significant effect of time (p < 0.0001) and a significant interaction between
time and exercise condition (p = 0.0198). Post-hoc analysis showed a significant difference in SWS δ wave-power
during 00:30–01:00 after sleep in the exercise condition (Fig. 4A). In summary, we found that the generation of δ
wave-power was significantly increased in early sleep phases, without an overall increase in EEG δ wave-power
throughout sleep in the exercise trials.
We subsequently examined the stability of the EEG δ waves using CVE analysis. Low CVE values indicate
stable, rhythmic, δ wave oscillations, whereas high CVE values indicate short phasic events in the δ frequency
range. In an animal model it has been shown that δ-band CVE converges towards 1 as its minimal possible value
(see discussion for details). Here we show that in humans this limit holds and δ-band CVE diminishes with
increasing sleep depth (CVE of N1 > CVE of N2 > CVE of SWS; Table 3). Our detailed analysis of SWS revealed
a significant effect of time (p < 0.0001) and a significant interaction of time and exercise condition (p = 0.0265;
Fig. 5A). Post-hoc comparisons showed significant differences in multiple comparisons. Specifically, exercise
trials were associated with lower CVE values than control trials in the first half of sleep (1.50 ± 0.03 vs. 1.44 ± 0.03
for control and exercise trials, p = 0.0051; Fig. 5B). This finding reinforces the notion of increased density and
stability of δ wave oscillations in early sleep phases after exercise.
Discussion
The present study investigated the acute effects of a single bout of high-intensity exercise on the subsequent sleep
phase, as assessed by observation of the metabolic state, responses to a sleep questionnaire, sleep-stage scoring,
EEG spectral analysis, and envelope (CVE) analysis of the EEG δ wave band. The parameters of the single 1-h
bout of vigorous exercise chosen here were comparable with those of exercises used in studies registering positive
effects of exercise on s leep12,13,15 and represent a realistic exercise regimen for healthy adults.
One potential limitation of the study should be considered in the interpretation of the findings. Although not
mentioned by the participants, stress due to the unfamiliar sleeping conditions may have affected sleep quality.
It should be noted, however, that participants underwent an adaptation day before the experiment and the high
sleep efficiency observed in both trials excludes disturbed sleep under the experimental conditions. Moreover,
first-night effects would be expected to affect both trial conditions equally owing to the crossover design. To
generalize the effects of exercise on sleep, future studies utilizing a different experimental design are warranted,
including experiments with a larger sample size. Protocols using regular, chronic exercise with participants of
different fitness levels should also be performed.
Scientific Reports | (2021) 11:4410 | https://doi.org/10.1038/s41598-021-83817-6 4
Vol:.(1234567890)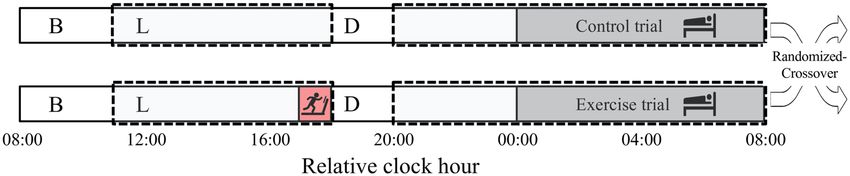
www.nature.com/scientificreports/
Figure 3. Time-course of sleep architecture and timing of sleep cycles. (A) Sleep architecture of the 9
participants for the control (upper panel) and exercise trials (bottom panel). Percentage of participants in stage
W (wakefulness; black), stage N1 (gray), stage N2 (light blue), SWS (dark blue), and stage REM (red) changed
with the sleep time. B and C: Latencies of SWS and REM sleep evaluated as time after beginning of sleep cycle
(B) and as time after sleep onset (C) are shown. Latency of sleep stage transition in each sleep cycle is shown
with black and red box-whisker plots for control and exercise trials, respectively. * and † represent statistically
significant differences between the control trial and exercise trial by a paired t-test (*p < 0.05; †p < 0.1).
In the present study, 1 h of vigorous exercise in the evening in untrained volunteers had a moderate, but
statistically significant effect on the metabolic state throughout the subsequent sleep phase, detected as excess
post-exercise oxygen consumption. Other studies, however, showed that a single bout of low- or high-intensity
exercise before lunch did not affect energy expenditure during subsequent s leep27,28. Excess post-exercise oxygen
consumption can be interpreted as restoring an oxygen deficit incurred during exercise and more complex mech-
anisms, including factors that directly (e.g., availability of metabolites such as ADP, ATP, inorganic phosphate,
and creatine phosphate) or indirectly (e.g., release of catecholamines, thyroxine, glucocorticoids, fatty acids,
calcium ions, and temperature [ Q10 effect]) affect mitochondrial O 2 consumption29. Interestingly, the increase
in energy expenditure in sleep after exercise was not accompanied by an increase in the core body temperature,
suggesting an important difference in heat dissipation, which was also observed in previous s tudies24.
Post-exercise sleep was judged subjectively worse compared to sleep following non-exercise conditions. We
hypothesize that mechanisms underlying the post-exercise oxygen deficit and excess oxygen consumption indi-
cate that subjects are under stress and this might explain this lower subjective assessment regarding the ’Refresh-
ness’ category in the exercise condition. Another potential reason for subjectively worse sleep after vigorous
exercise is muscle soreness as the participants were not accustomed to vigorous exercise. Indeed, in a previous
study of moderate (as opposed to vigorous) exercise (~ 45% V̇ O2max) in young healthy males, participants
reported increased subjective sleep quality, particularly ‘Initiation and maintenance of sleep’30. Recommendations
Scientific Reports | (2021) 11:4410 | https://doi.org/10.1038/s41598-021-83817-6 5
Vol.:(0123456789)www.nature.com/scientificreports/
Figure 4. Time-Course of δ-Power of the non-REM Sleep EEG & Relative Occurrence of δ-Power in Each
non-REM stage. (A) The 30-min means ± SE of δ-power of the 9 participants are shown as a line graph and
accumulated δ-power during non-REM is shown as a bar graph. *Represents a statistically significant difference
between the control trial and exercise trial by post hoc comparisons using Bonferroni’s correction for multiple
comparisons (p < 0.05). (B–D) Relative occurrences of δ-power in N1 (B), N2 (C), and SWS (D) stages are
shown. Inserted bar graphs in each panel represent mean δ-power in each non-REM stage. Black plots (filled
black circle) and bars (filled black square) represent control trials, and red plots (filled red circle) and bars (filled
red square) represent exercise trials. §Represents a statistically significant difference between control trial and
exercise trial by a paired t-test (§p < 0.05).
CVE
Non-REM stage Mean ± sem Post-hoc comparisons
N1 1.81 ± 0.03 N1 > N2, p = 0.586
N2 1.69 ± 0.05 N2 > SWS, p = 0.026*
SWS 1.39 ± 0.08 SWS < N1, p < 0.001**
Table 3. CVE Values in Each non-REM stage (mean ± standard error). CVE coefficient of variation of the
envelope. *p < 0.05, **p < 0.01.
for exercise for non-pharmacologic improvement of subjective sleep quality may benefit from suggestions to
participate in moderate exercise, at least initially.
While vigorous exercise may be judged as negatively affecting subjective sleep quality by participants, we
found that objective measures of sleep quality indicate a more complex picture suggesting an opposite, benefi-
cial effect. Sleep staging according to American Academy of Sleep Medicine criteria revealed little difference
between the exercise and control conditions, consistent with previous studies16–19. Sleep staging is inherently
semi-quantitative, e.g., when the criteria for the SWS stage are fulfilled, further increases in sleep depth can-
not be resolved. Notably, stage N4, which might allow for more fine-grained classification of sleep depth, was
recently abolished. We observed shortening of the first N3 episode, while several studies investigating the effect
of exercise on sleep observed little effect on the total duration of S WS16–19,31. The participants in our study were
not regularly exercising at the level used in this study, which might explain some differences between our findings
Scientific Reports | (2021) 11:4410 | https://doi.org/10.1038/s41598-021-83817-6 6
Vol:.(1234567890)www.nature.com/scientificreports/
Figure 5. Envelope analysis. (A) Time-course of the CVE during the entire sleep. The 30-min means ± SE
of the CVE are shown for the control trial (filled black circle) and exercise trial (filled red circle). (B) Mean
CVE during the first half and second half of sleep are shown. Mean CVE is shown for the control trial (open
black square) and exercise trial (open red square). Dotted lines connect the same participants. *Represents a
significant difference between the control trial and exercise trial by a paired t-test (*p < 0.05). Note that the CVE
values did not differ significantly between control and exercise in the last hour of sleep. CVE values were most
likely affected by the very low δ power values during this time.
and those of previous studies, but a recent meta-analysis indicated that fitness level does not modulate the effect
of exercise on S WS13.
REM latency is chronically shortened in some pathologic conditions, including depression32 and attention-
deficit/hyperactivity disorder33, but these are unlikely causes in the present study, which included young healthy
participants. In fact, physical exercise is a known beneficial intervention for depression34. The shortened first
REM sleep latency we observed in this study can be interpreted as a forward shift of sleep processes following
exercise. Latencies of SWS and REM sleep evaluated as time after the beginning of the sleep cycle did not dif-
fer significantly during the second and third sleep stages (Fig. 3). The latencies were shortened, however, when
evaluated as time after sleep onset, i.e., indicating a shift forward. A potential caveat of this type of analysis is
the necessarily semi-quantitative nature of the scoring system, which may obscure more subtle differences. As
a more quantitative measure, energy in the EEG δ power is viewed as the most reliable indicator of sleep-need
buildup and r esolution35. Accordingly, the increased δ wave energy production in the first SWS period observed
here indicates a more rapid reduction of sleep need in the early sleep phases after exercise, reinforcing the notion
of more efficient early sleep processes. Thus, exercise could help achieve efficient sleep earlier by more effectively
reducing the sleep need during the first SWS episode. A recent study showed that exercise performed in the even-
ing delays the nocturnal melatonin rise, indicating an effect on the central clock36. Our finding of an advance in
the sleep cycle after exercise shows that this mechanism is not responsible for our results.
The lack of an increase in overall δ wave-power throughout the entire sleep period shows that the overall
sleep need was not increased by 1 h of vigorous physical exercise. This finding is in contrast to the previous
report that sleep after high-intensity exercise (50–70% V̇ O2max) increased sleep need as defined by enhanced
SWS duration31, but is consistent with findings from a study reporting no effect of high-intensity exercise (65%
and 75% V̇ O2max) on sleep n eed18.
Complementary to measuring spectral power, envelope analysis, operating in the time domain, allows an even
more detailed analysis of EEG activity, providing information about the morphology of slow waves. According
to a recent model based on rat EEG recordings, δ waves originate from the superposition of transient events
whose density controls the phasic or continuous appearance of the resulting wave as well as its amplitude26. A
few transients (i.e. isolated slow waves) over the EEG background are reported by CVE ≫ 1, while epochs show-
ing dense slow waves are characterized by CVE approaching 1 (for simplicity, CVE = 1 represents a theoretical
constant related to Gaussian waves, i.e. the limit for a random superposition of high-density transient events)26.
In this study we show that in humans NREM stages are arranged on the CVE scale as 1 < N3 < N2 < N1 (Table 3),
hence CVE can be directly interpreted as sleep depth. These morphologic variations in δ waves can be followed
quantitatively using envelope analysis, which provides the investigator with a novel tool for assessing the effect of
manipulations on sleep that may otherwise elude detection. As a general observation, deep SWS is accompanied
by lower CVE values compared with shallow non-REM sleep. The lower CVE values in SWS that we observed
here together with the higher δ wave energy in the first SWS period reinforce the notion that the processes gen-
erating slow waves are more efficient after exercise compared with control conditions. To our knowledge this is
the first report of exercise exerting such an effect. Further investigation into the mechanisms and consequences
of this increased δ wave stability are necessary.
Scientific Reports | (2021) 11:4410 | https://doi.org/10.1038/s41598-021-83817-6 7
Vol.:(0123456789)www.nature.com/scientificreports/
Patients who need or wish to perform vigorous exercise during the day may judge their subsequent sleep as
inferior compared to rest. Our results indicate that objective parameters contradict this subjective assessment
and may serve to reassure individuals, such as athletes who need or wish to perform at high V̇ O2max loads, that,
if anything, sleep is improved by their physical exercise.
Methods
Participants. Nine healthy young men participated in the study. All participants satisfied the inclusion crite-
ria, as follows: 20–30 years of age, body mass index of 18.0–29.9 (kg/m2), a regular sleep/wake pattern, and regu-
lar exercise no more than twice a week. Exclusion criteria for the study participants was determined following
previous studies22,41; self-reported sleep problems (Pittsburgh Sleep Quality Index score > 5); shiftwork or trans-
meridian travel within 1 month before the study; smoking; excessive alcohol intake (> 30 g alcohol/day); ongoing
medication for cardiovascular disease, diabetes, hypercholesterolemia, hyperglycemia, or hyperlipidemia; and
the use of medications affecting sleep or metabolism. Based on sample size calculation, our 9 participants allow
us to observe a significant difference with a paired t-test with 75% power and 5% alpha level. Power analysis was
conducted by using G-Power 3.1.9 software. This study was conducted according to the guidelines of the Decla-
ration of Helsinki and all procedures involving human participants were approved by the Ethics Committee of
the University of Tsukuba. The study protocol was approved by the University of Tsukuba (approval number: tai-
28-52) and registered with Clinical Trials UMIN (ID numbers: UMIN000040428, 31/05/2020). All participants
provided written informed consent before study commencement.
Procedures. The present study was a randomized-crossover intervention study. The 2 trials were separated
by a washout period of 1 week. All participants performed a graded exercise test comprising submaximal and
maximal tests using a treadmill (ORK-7000, Ohtake-Root Kogyo Co., Ltd, Iwate, Japan)37 to determine a work-
load corresponding to 60% of each individual’s V̇ O2max. The test was performed within a month before the
first experimental trial. Additionally, the experiment was preceded by an adaptation night in the whole-room
metabolic chamber, during which the sensors and electrodes of the polysomnographic recording system were
attached to the participants. For 5 days prior to the experiment, participants maintained a constant 8-h sleep/16-
h wake schedule following their habitual bed and awake time. The participants refrained from ingesting bever-
ages containing caffeine and alcohol, and from performing high-intensity physical activity. Compliance with
the instructions was confirmed by sleep diaries and wrist actigraphy (ActiGraph, Ambulatory Monitoring, NY).
One day before the experiment and during the experiment day, the participants consumed specified meals at
the designated time for breakfast (1 h after waking), lunch (4 h after waking), and dinner (5 h before bedtime).
On the experiment day, the participants arrived at the laboratory, ate lunch, swallowed a core body tem-
perature sensor, and entered the metabolic chamber. The participants performed physical exercise at 60% of
the V̇ O2max for 60 min beginning at 6 h before bedtime using a treadmill (T1201, Johnson Health Tech Japan,
Tokyo, Japan) or remained seated. After the exercise period, the participants were allowed to leave the chamber
for 90 min to wipe away sweat and eat dinner. After fitting the participants with the electrodes for polysom-
nography, they entered the metabolic chamber and remained sedentary. The participants went to bed at their
usual bedtime (23:30 ~ 24:30) and slept for 8 h. Energy metabolism was measured for 16 h (from lunch to the
next morning; Fig. 1).
The specified meals provided were based on energy requirements estimated from the basal metabolic rate38
with a physical activity level of 1.3 on the day prior to the experiment and control trials. The physical activity level
of the exercise trial was assumed to be 1.64 to maintain a stable energy b alance39. The macronutrient composition
of the meals was 15% protein, 25% fat, and 60% carbohydrates.
Measures. Indirect calorimetry. The airtight metabolic chamber measured 2.00 × 3.45 × 2.10 m (FHC-15S,
Fuji Medical Science Co., Ltd., Chiba, Japan), and air in the chamber was pumped out at a rate of 80 L/min. The
temperature and relative humidity of the incoming fresh air were controlled at 25 °C and 55%, respectively. The
chamber was furnished with an adjustable hospital bed, desk, chair, and toilet. Concentrations of oxygen ( O2)
and carbon dioxide ( CO2) in the outgoing air were measured with high precision by online process mass spec-
trometry (VG Prima δB; Thermo Electron Co., Winsford, UK). The precision of the mass spectrometry, defined
as the standard deviation for continuous measurement of the calibrated gas mixture ( O2, 15%; C O2, 5%), was
0.0016% for O 2 and 0.0011% for C
O2. Every minute, O 2 consumption (V̇ O2) and C O2 production (V̇ CO2) rates
were calculated using an algorithm for improved transient response40. Energy expenditure was calculated from
V̇ O2, V̇ CO2, and urinary nitrogen excretion (N), as described previously22,39,41.
Core body temperature. Core body temperature was continuously monitored using an ingestible temperature
sensor that wirelessly transmitted the core body temperature to a recorder (CorTemp, HQ Inc, FL, USA). The
sensor was accurate to ± 0.1 °C, and was calibrated by immersion in water at a known reference temperature
before use and swallowed 4 h before experiment42.
Self‑reported quality of sleep. The Pittsburgh Sleep Quality Index was used to assess sleep quality and sleep dis-
orders in the month prior to the experimental procedures. We assessed 7 components: subjective sleep quality,
sleep latency, sleep duration, sleep efficiency, sleep disturbances, use of sleep medication, and daytime dysfunc-
tion. The scores of the 7 components were summed to produce a total score (range = 0—21). This index was used
only in the preselection s tage43. The Oguri-Shirakawa-Azumi sleep inventory MA version (OSA-MA) was used
to assess subjective sleep quality after waking in the morning44. This questionnaire comprises 16 items with 5
Scientific Reports | (2021) 11:4410 | https://doi.org/10.1038/s41598-021-83817-6 8
Vol:.(1234567890)www.nature.com/scientificreports/
factors (‘Sleepiness on rising’, ‘Initiation and maintenance of sleep’, ‘Frequent dreaming’, ‘Refreshness’, and ‘Sleep
length’).
Polysomnography. The recording system (Alice 5, Respironics Inc, Japan) comprised 6 electroencephalogra-
phy locations (C3-A2, C4-A1, O2-A1, O1-A2, F3-A2, and F4-A1), submental electromyography, and a bilateral
electrooculogram. Sleep parameters were categorized at 30-s intervals as wakefulness and stages N1, N2, SWS,
and rapid eye movement (REM) sleep according to the standard criteria of the American Academy of Sleep
Medicine45. In addition, total sleep time, sleep onset latency, REM sleep latency, and sleep efficiency were evalu-
ated.
Data analysis: spectral analysis of the electroencephalogram. The C3-A2 EEG recording was analyzed using
escribed22. Fast-Fourier transformation was con-
discrete fast-Fourier transformation techniques as previously d
ducted on an EEG record length of 5 s to obtain a frequency resolution of 0.2 Hz. Each 5-s EEG segment was
first windowed with a Hanning tapering window prior to computing the power spectra. The spectral distribution
was categorized into the following frequency bands: delta (δ: 0.75–4.00 Hz), theta (θ: 4.10–8.00 Hz), alpha (α:
8.10–12.00 Hz), sigma (σ: 12.10–14.00 Hz), and beta (β: 14.10–30.00 Hz)22. The power content of the δ band for
each 30-s epoch of sleep was determined as the mean of the δ power measured in six consecutive 5-s segments
of the EEG (expressed as μV2).
Envelope analysis. The CVE for the δ band was calculated for EEG recordings (C3-A2) at 30-s intervals. To
minimize aliasing effects, the epochs had 50% overlap (i.e., epoch length = 60 s). First, every epoch was digitally
bandpass-filtered (0.5–4 Hz) with a fourth-order IIR implementation of a Butterworth filter using the ’signal’
package for the R language (http://r-forge.r-project.org/projects/signal/). The envelope of the filtered EEG (filt_
EEG_envelope) was obtained using its Hilbert transform (Ht) according to the standard relation:
Filt_EEG_envelope = sqrt filt_EEG2 + Ht(filt_EEG)2 ,
where sqrt corresponds to the square root. Both the filter and envelope calculations usually produce artifacts at
the border of each epoch. To avoid this problem, the samples of each epochs were collected with a 10% excess (i.e.,
totaling 66 s, 3 s per side). Once the envelope was obtained, this time excess was excised. The mean and standard
deviation (SD) of the obtained envelope were calculated and a normalized version of the coefficient of variation
(CVE) was obtained sd/(mean*0.523); with 0.523 being the value for Gaussian waves. As a consequence, CVE
values larger than 1 result from processes more phasic than Gaussian waves, while values below 1 indicate more
sinusoidal processes. For each epoch, the coefficient of variation (i.e. SD/mean) of the corresponding envelope
was stored as a relevant feature26.
Statistical analysis. The results are expressed as the mean ± standard error of the mean (SEM). Paired
Student’s t tests were used to compare the total amount of δ power during the whole sleep period, each sleep
stage latency, the OSA-MA parameters, and the sleep parameters between the mean value of trials. The effects of
exercise on the time course of δ power, CVE, core body temperature, and energy expenditure were assessed by
2-way repeated-measures analysis of variance (ANOVA) and Bonferroni’s correction for multiple comparisons.
1-way ANOVA and Bonferroni’s correction for multiple comparisons were used to compare the CVE in each
non-REM stage. Data analysis was conducted using Prism 8 (GraphPad Software, San Diego, CA), or R (https://
www.r-project.org/), and differences were considered significant when the error probability was less than 0.05.
Received: 23 June 2020; Accepted: 8 February 2021
References
1. Spiegel, K., Tasali, E., Leproult, R. & Van Cauter, E. Effects of poor and short sleep on glucose metabolism and obesity risk. Nat.
Rev. Endocrinol. 5, 253–261. https://doi.org/10.1038/nrendo.2009.23 (2009).
2. Cappuccio, F. P., D’Elia, L., Strazzullo, P. & Miller, M. A. Quantity and quality of sleep and incidence of type 2 diabetes: A systematic
review and meta-analysis. Diabetes Care 33, 414–420. https://doi.org/10.2337/dc09-1124 (2010).
3. Knutson, K. L. Sleep duration and cardiometabolic risk: A review of the epidemiologic evidence. Best Pract. Res. Clin. Endocrinol.
Metab. 24, 731–743. https://doi.org/10.1016/j.beem.2010.07.001 (2010).
4. Grandner, M. A., Hale, L., Moore, M. & Patel, N. P. Mortality associated with short sleep duration: The evidence, the possible
mechanisms, and the future. Sleep Med. Rev. 14, 191–203. https://doi.org/10.1016/j.smrv.2009.07.006 (2010).
5. Sivertsen, B., Krokstad, S., Øverland, S. & Mykletun, A. The epidemiology of insomnia: associations with physical and mental
health. The HUNT-2 study. J. Psychosom. Res. 67, 109–116. https://doi.org/10.1016/j.jpsychores.2009.05.001.
6. Vandeputte, M. & de Weerd, A. Sleep disorders and depressive feelings: A global survey with the Beck depression scale. Sleep Med.
4, 343–345. https://doi.org/10.1016/s1389-9457(03)00059-5 (2003).
7. Ford, D. E. & Kamerow, D. B. Epidemiologic study of sleep disturbances and psychiatric disorders. An opportunity for prevention?
JAMA 262, 1479–1484. https://doi.org/10.1001/jama.262.11.1479 (1989).
8. Passos, G. S., Poyares, D. L., Santana, M. G., Tufik, S. & Mello, M. T. Is exercise an alternative treatment for chronic insomnia?.
Clinics (Sao Paulo) 67, 653–660. https://doi.org/10.6061/clinics/2012(06)17 (2012).
9. Schutte-Rodin, S., Broch, L., Buysse, D., Dorsey, C. & Sateia, M. Clinical guideline for the evaluation and management of chronic
insomnia in adults. J. Clin. Sleep Med. 4, 487–504 (2008).
10. Milne, S. & Elkins, M. R. Exercise as an alternative treatment for chronic insomnia (PEDro synthesis). Br. J. Sports Med. 51,
479–480. https://doi.org/10.1136/bjsports-2016-096349 (2017).
11. Association, A. S. D. Sleep hygiene: Behaviors that help promote better sleep (American Sleep Disorders Association, Rochester MN,
1995).
Scientific Reports | (2021) 11:4410 | https://doi.org/10.1038/s41598-021-83817-6 9
Vol.:(0123456789)www.nature.com/scientificreports/
12. Youngstedt, S. D. Effects of exercise on sleep. Clin. Sports Med. 24, 355–365. https://doi.org/10.1016/j.csm.2004.12.003 (2005).
13. Youngstedt, S. D., O’Connor, P. J. & Dishman, R. K. The effects of acute exercise on sleep: A quantitative synthesis. Sleep 20, 203–214.
https://doi.org/10.1093/sleep/20.3.203 (1997).
14. Driver, H. S. & Taylor, S. R. Exercise and sleep. Sleep Med. Rev. 4, 387–402. https://doi.org/10.1053/smrv.2000.0110 (2000).
15. Kubitz, K. A., Landers, D. M., Petruzzello, S. J. & Han, M. The effects of acute and chronic exercise on sleep: A meta-analytic review.
Sports Med. 21, 277–291. https://doi.org/10.2165/00007256-199621040-00004 (1996).
16. Buguet, A., Roussel, B., Angus, R., Sabiston, B. & Radomski, M. Human sleep and adrenal individual reactions to exercise. Elec‑
troencephalogr. Clin. Neurophysiol. 49, 515–523. https://doi.org/10.1016/0013-4694(80)90394-6 (1980).
17. Horne, J. A. & Poter, J. M. Exercise and human sleep. Nature 256, 573–575. https://doi.org/10.1038/256573a0 (1975).
18. Wong, S. N., Halaki, M. & Chow, C. M. The effects of moderate to vigorous aerobic exercise on the sleep need of sedentary young
adults. J. Sports Sci. 31, 381–386. https://doi.org/10.1080/02640414.2012.733823 (2013).
19. Meintjes, A. F., Driver, H. S. & Shapiro, C. M. Improved physical fitness failed to alter the EEG patterns of sleep in young women.
Eur. J. Appl. Physiol. Occup. Physiol. 59, 123–127. https://doi.org/10.1007/BF02396589 (1989).
20. Rechtschaffen, A. & Kales, A. University of California LA Brain Information Service, NINDB Neurological Information Network
(U.S.). A manual of standardized terminology, techniques and scoring system for sleep stages of human participants. U.S. National
Institute of Neurological Diseases and Blindness, Neurological Information Network; (1986).
21. Borbély, A. A., Baumann, F., Brandeis, D., Strauch, I. & Lehmann, D. Sleep deprivation: Effect on sleep stages and EEG power
density in man. Electroencephalogr. Clin. Neurophysiol. 51, 483–495. https://doi.org/10.1016/0013-4694(81)90225-x (1981).
22. Park, I. et al. Effects of subacute ingestion of chlorogenic acids on sleep architecture and energy metabolism through activity of
the autonomic nervous system: A randomised, placebo-controlled, double-blinded cross-over trial. Br. J. Nutr. 117, 979–984. https
://doi.org/10.1017/S0007114517000587 (2017).
23. Torsvall, L., Åkerstedt, T. & Lindbeck, G. Effects on sleep stages and EEG power density of different degrees of exercise in fit
subjects. Electroencephalogr. Clin. Neurophysiol. 57, 347–353. https://doi.org/10.1016/0013-4694(84)90158-5 (1984).
24. Aritake-Okada, S. et al. Diurnal repeated exercise promotes slow-wave activity and fast-sigma power during sleep with increase in
body temperature: A human crossover trial. J Appl Physiol 1985(127), 168–177. https://doi.org/10.1152/japplphysiol.00765.2018
(2019).
25. Hague, J. F., Gilbert, S. S., Burgess, H. J., Ferguson, S. A. & Dawson, D. A sedentary day: Effects on subsequent sleep and body
temperatures in trained athletes. Physiol. Behav. 78, 261–267. https://doi.org/10.1016/s0031-9384(02)00975-7 (2003).
26. Díaz, J., Bassi, A., Coolen, A., Vivaldi, E. A. & Letelier, J. C. Envelope analysis links oscillatory and arrhythmic EEG activities to
two types of neuronal synchronization. Neuroimage 172, 575–585. https://doi.org/10.1016/j.neuroimage.2018.01.063 (2018).
27. Melanson, E. L. et al. Effect of exercise intensity on 24-h energy expenditure and nutrient oxidation. J. Appl. Physiol. 1985(92),
1045–1052. https://doi.org/10.1152/japplphysiol.00706.2001 (2002).
28. Iwayama, K. et al. Transient energy deficit induced by exercise increases 24-h fat oxidation in young trained men. J. Appl. Physiol.
1985(118), 80–85. https://doi.org/10.1152/japplphysiol.00697.2014 (2015).
29. Gaesser, G. A. & Brooks, G. A. Metabolic bases of excess post-exercise oxygen consumption: A review. Med. Sci. Sports Exerc. 16,
29–43. https://doi.org/10.1249/00005768-198401000-00008 (1984).
30. Sasazawa, Y., Kawada. T. & Kiryu, Y. Effect of daytime exercise on sleep EEG and subjective sleep. J. Sound Vib. 205, 393–403. https
://doi.org/10.1006/jsvi.1997.1004 (1997).
31. Bunnell, D. E., Bevier, W. & Horvath, S. M. Effects of exhaustive exercise on the sleep of men and women. Psychophysiology 20,
50–58. https://doi.org/10.1111/j.1469-8986.1983.tb00900.x (1983).
32. Palagini, L., Baglioni, C., Ciapparelli, A., Gemignani, A. & Riemann, D. REM sleep dysregulation in depression: State of the art.
Sleep Med. Rev. 17, 377–390. https://doi.org/10.1016/j.smrv.2012.11.001 (2013).
33. Diaz-Roman, A. & Buela-Casal, G. Shorter REM latency in children with attention-deficit/hyperactivity disorder. Psychiatry Res.
278, 188–193. https://doi.org/10.1016/j.psychres.2019.06.012 (2019).
34. Dunn, A. L., Trivedi, M. H., Kampert, J. B., Clark, C. G. & Chambliss, H. O. Exercise treatment for depression: Efficacy and dose
response. Am. J. Prev. Med. 28, 1–8. https://doi.org/10.1016/j.amepre.2004.09.003 (2005).
35. Achermann, P. & Borbely, A. A. Low-frequency (< 1 Hz) oscillations in the human sleep electroencephalogram. Neuroscience 81,
213–222. https://doi.org/10.1016/s0306-4522(97)00186-3 (1997).
36. Yamanaka, Y. et al. Morning and evening physical exercise differentially regulate the autonomic nervous system during nocturnal
sleep in humans. Am. J. Physiol. Regul. Integr. Comp. Physiol. 309, R1112-1121. https: //doi.org/10.1152/ajpreg u.00127. 2015 (2015).
37. Shimada, K. et al. Effects of post-absorptive and postprandial exercise on 24 h fat oxidation. Metabolism 62, 793–800. https://doi.
org/10.1016/j.metabol.2012.12.008 (2013).
38. Anonumous. Dietary reference intakes for Japanese. Tokyo: Ministry of Health Labour and Welfare of Japan (2010).
39. Iwayama, K. et al. Exercise increases 24-h fat oxidation only when it is performed before breakfast. EBioMedicine 2, 2003–2009.
https://doi.org/10.1016/j.ebiom.2015.10.029 (2015).
40. Tokuyama, K., Ogata, H., Katayose, Y. & Satoh, M. Algorithm for transient response of whole body indirect calorimeter: Decon-
volution with a regularization parameter. J. Appl. Physiol. 1985(106), 640–650. https://doi.org/10.1152/japplphysiol.90718.2008
(2009).
41. Kayaba, M. et al. Energy metabolism differs between sleep stages and begins to increase prior to awakening. Metabolism 69, 14–23.
https://doi.org/10.1016/j.metabol.2016.12.016 (2017).
42. Zhang, S. et al. Changes in sleeping energy metabolism and thermoregulation during menstrual cycle. Physiol. Rep. 8, e14353.
https://doi.org/10.14814/phy2.14353 (2020).
43. Buysse, D. J., Reynolds, C. F. 3rd., Monk, T. H., Berman, S. R. & Kupfer, D. J. The Pittsburgh Sleep Quality Index: A new instrument
for psychiatric practice and research. Psychiatry Res. 28, 193–213. https://doi.org/10.1016/0165-1781(89)90047-4 (1989).
44. Yamamoto, Y. et al. Standardization of revised version of OSA sleep inventory for middle age and aged. Brain Sci. Ment. Disord.
10, 401–409 (1999).
45. American Academy of Sleep Medicine. The AASM manual for the scoring of sleep and associated events summary of updates in
version 2.3 (cited 2010 April 1). Available from: http://www.aasmnet.org/Resources/pdf/ScoringManualUpdates_April_2016.pdf.
Acknowledgements
We would like to thank Fuji Medical Science Co. (Chiba, Japan) for technical support. This study was supported
by the Japan Society for the Promotion of Science (Grant-in-Aid for Scientific Research (B) 20H04120).
Author contributions
I.P. and K.T. designed the experiment; I.P., K.I., Y.N., A.A., and K.Y. performed the indirect calorimetry; I.P.,
J.D., S.M., H.O., M.K., M.S., and K.V. performed the sleep analysis; I.P. performed the statistical analysis; and
I.P., S.M., K.T., and K.V. interpreted the results and wrote the paper.
Scientific Reports | (2021) 11:4410 | https://doi.org/10.1038/s41598-021-83817-6 10
Vol:.(1234567890)www.nature.com/scientificreports/
Competing interests
The authors declare no competing interests.
Additional information
Correspondence and requests for materials should be addressed to K.E.V.
Reprints and permissions information is available at www.nature.com/reprints.
Publisher’s note Springer Nature remains neutral with regard to jurisdictional claims in published maps and
institutional affiliations.
Open Access This article is licensed under a Creative Commons Attribution 4.0 International
License, which permits use, sharing, adaptation, distribution and reproduction in any medium or
format, as long as you give appropriate credit to the original author(s) and the source, provide a link to the
Creative Commons licence, and indicate if changes were made. The images or other third party material in this
article are included in the article’s Creative Commons licence, unless indicated otherwise in a credit line to the
material. If material is not included in the article’s Creative Commons licence and your intended use is not
permitted by statutory regulation or exceeds the permitted use, you will need to obtain permission directly from
the copyright holder. To view a copy of this licence, visit http://creativecommons.org/licenses/by/4.0/.
© The Author(s) 2021
Scientific Reports | (2021) 11:4410 | https://doi.org/10.1038/s41598-021-83817-6 11
Vol.:(0123456789)You can also read