Unraveling cardiolipin induced conformational change of cytochrome c through H/D exchange mass spectrometry and quartz crystal microbalance
←
→
Page content transcription
If your browser does not render page correctly, please read the page content below
www.nature.com/scientificreports
OPEN Unraveling cardiolipin‑induced
conformational change
of cytochrome c through H/D
exchange mass spectrometry
and quartz crystal microbalance
Sin‑Cih Sun1, Hung‑Wei Huang1, Yi‑Ting Lo1, Min‑Chieh Chuang1,2* &
Yuan‑Hao Howard Hsu1,3*
Cardiolipin (CL), a crucial component in inner mitochondrial membranes, interacts with cytochrome
c (cyt c) to form a peroxidase complex for the catalysis of CL oxidation. Such interaction is pivotal to
the mitochondrial regulation of apoptosis and is affected by the redox state of cyt c. In the present
study, the redox-dependent interaction of cyt c with CL was investigated through amide hydrogen/
deuterium exchange coupled with mass spectrometry (HDXMS) and quartz crystal microbalance with
dissipation monitoring (QCM-D). Ferrous cyt c exhibited a more compact conformation compared with
its ferric form, which was supported by the lower number of deuterons accumulated and the greater
amplitude reduction on dissipation. Upon association with CL, ferrous cyt c resulted in a moderate
increase in deuteration, whereas the ferric form caused a drastic increase of deuteration, which
indicated that CL-bound ferric cyt c formed an extended conformation. These results were consistent
with those of the frequency (f) − dissipation (D) experiments, which revealed that ferric cyt c yielded
greater values of |ΔD/Δf| within the first minute. Further fragmentation analysis based on HDXMS
indicated that the effect of CL binding was considerably different on ferric and ferrous cyt c in the
C-helix and the Loop 9–24. In ferric cyt c, CL binding affected Met80 and destabilized His18 interaction
with heme, which was not observed with ferrous cyt c. An interaction model was proposed to explain
the aforementioned results.
Cytochrome c (cyt c) is a heme protein located in the mitochondrial intermembrane space in eukaryotic c ells1.
The negatively charged cardiolipin (CL)2 reacts with approximately 15% of cyt c under homeostatic c onditions3,4.
Oxidative stress induces peroxidation of CL to inhibit electron transport and alter mitochondrial bioenergetics5–7.
Such CL peroxidation changes the integrity of inner mitochondrial membranes and affects the interactions
between CL and cyt c3,8–10. These interactions facilitate unfolding and further activation of cyt c to catalyze CL
peroxidation11–13 .The disruption of this protein–lipid complex triggers cyt c release from mitochondria and
eventually leads to programmed cell d eath14,15.
Upon binding with CL, cyt c exhibits an active but less compact structure16. The CL binding also disturbs the
interactions of Met80 with heme to unfold cyt c and therefore elevates its peroxidase activity. Three CL bind-
ing sites on cyt c have been reported, namely the ionic binding site A as well as the nonionic binding C- and
L-sites17,18. Lys72, Lys73, and Lys79 residues of site A, next to Met80, are critical for CL recognition and necessary
for the peroxidase activity19. CL on the liposome inserts a fatty acyl chain into the surface cleft between residues
67–71 and 82–85 on cyt c, which can be disrupted by Arg91 m utation20. Time-resolved FRET analysis of CL-
bound cyt c revealed that the unfolding of cyt c, particularly on the C-terminus, increases its peroxidase activity11.
The redox state of the heme determines the affinity of cyt c to electron transport chain complex III and com-
plex IV in m itochondria21–23 Ferric cyt c tends to associate with complex III, but ferrous cyt c favors binding to
1
Department of Chemistry, Tunghai University, Taichung, Taiwan. 2Department of Environmental Science
and Engineering, Taichung, Taiwan. 3Biological Science Center, Tunghai University, Taichung, Taiwan. *email:
mcchuang@thu.edu.tw; howardhsu@thu.edu.tw
Scientific Reports | (2021) 11:1090 | https://doi.org/10.1038/s41598-020-79905-8 1
Vol.:(0123456789)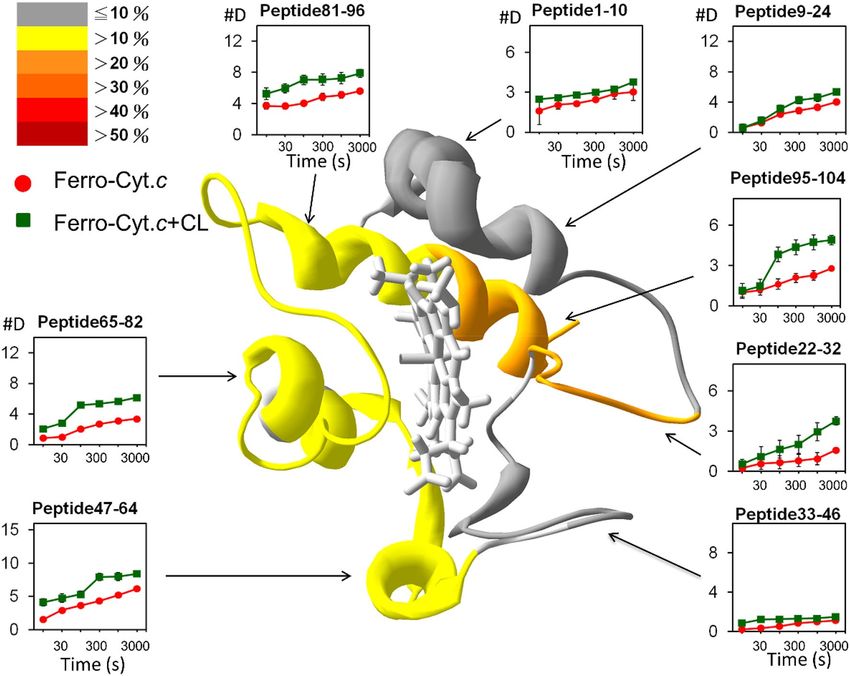
www.nature.com/scientificreports/
Figure 1. Mass spectra of pristine ferric (a), pristine ferrous (b), CL-bound ferric (c), and CL-bound ferrous (d)
cyt c after 50-min deuteration. The CL-bound cyt c was prepared by incubating cyt c with a CL/DPPC liposomal
solution at 30 °C for 10 min (see “Experimental” section for details).
complex IV. The oxidation state of heme affects the conformation of cyt c and the affinity to the electron transport
complexes. Several studies have suggested that the change of the charge state23,24 or redox potential21,25,26 trig-
gers the conformational change of cyt c. Notably, the affinity changes toward electron transport complex did not
drastically change the crystal s tructures21,25. In addition, the redox state of cyt c has been proposed to regulate
cell growth. Ferric cyt c drives the cells toward the proapoptotic state and ferrous cyt c drives the stressed cells
toward the prosurvival state27. Although both ferric and ferrous cyt c form complexes with C L28, whether dif-
ferent oxidative states of free cyt c affect their protein–lipid interactions to release cyt c during apoptosis has not
yet been completely established.
We aimed to understand how the redox state of cyt c affects its interactions with CL. Amide hydrogen/deute-
rium exchange coupled with mass spectrometry (HDXMS) measures the rate of hydrogen/deuterium exchange
on the peptide amide bond and has been widely used to analyze the interface of protein–protein interactions29,
protein–DNA interactions30, protein–phospholipid i nteractions31–34, protein conformational c hanges35, and pro-
tein dynamics36. Quartz crystal microbalance with dissipation monitoring (QCM-D) is useful for determining
the structural change of macromolecules37–41. Because the interactions between CL and cyt c can be electro-
static, hydrophobic, or of other types, determination of the exact conformation of the CL − cyt c association is
difficult13,42,43. While NMR has been performed to study the interaction mechanism between cytochrome and
lipid bilayers44,45, in the present study, we used QCM-D and HDXMS to measure and differentiate the structural
change of both ferric and ferrous cyt c caused by CL binding. The information obtained from these two analyti-
cal methods provided an explanation of the interaction mechanism from global and fragmentary perspectives.
Results
Characterizations of cyt c and the CL‑containing lipid membrane. The absorption spectra (Sup-
plementary Fig. S1) revealed that ferric cyt c was reduced to the ferrous state through treatment with ascorbate.
The Soret band (415 nm) of ferrous cyt c was red-shifted with respect to ferric cyt c. In addition, Q bands, resid-
ing in the range of 500–600 nm, transited from a broad absorption wave (maximum at 530 nm) to two discrete
peaks (520 and 550 nm), verifying redox transition from ferric to ferrous states46,47. A successful synthesis of the
CL/DPPC liposome was confirmed using NAO labeling, which specifically absorbed with CL (Supplementary
Fig. S2). The fluorescence from the CL/DPPC-coated S iO2 surface was considerably greater than those of DPPC-
coated and bare SiO2, which confirmed that CL was assembled with DPPC.
Global hydrogen/deuterium exchange. The global H/D exchange of ferric and ferrous cyt c and their
interaction with CL was analyzed using MALDI-TOF. Hypothetically, CL binding may induce conformational
change on cyt c to yield varying levels of deuteron incorporation. As expected, ferric and ferrous cyt c exhibited
similar masses of m/z = 12,344.0 and 12,344.1 Da, respectively (Supplementary Fig. S3). After 50 min of deutera-
tion, ferric cyt c retained 46.0 deuterons and the mass shifted to 12,390.0 Da (Fig. 1A). However, ferrous cyt c
accumulated 29.1 deuterons and the mass shifted to 12,373.2 Da (Fig. 1B). The greater extent of deuteration indi-
cated that ferric cyt c held a less compact structure. These results implied the redox state of hemes was relevant
to a perturbation on the Fe coordination with surrounding residue such as Met 80, leading to a loosen structure.
Furthermore, the CL-bound cyt c exhibited an enhanced extent of deuteration, in which 56.7 and 40.6 deuterons
were incorporated in ferric and ferrous cyt c, respectively (Fig. 1C,D). This result indicated that CL binding loos-
Scientific Reports | (2021) 11:1090 | https://doi.org/10.1038/s41598-020-79905-8 2
Vol:.(1234567890)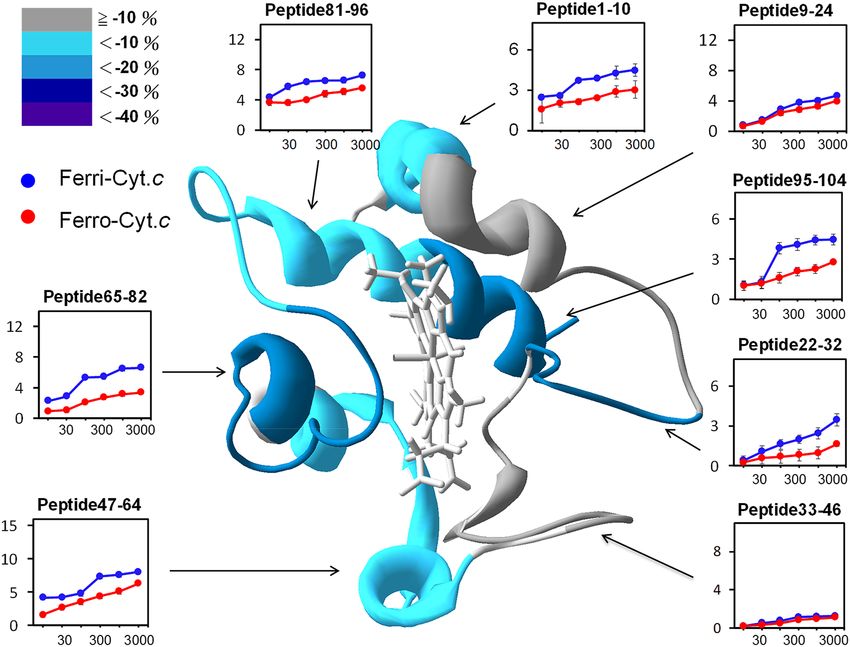
www.nature.com/scientificreports/
Figure 2. Frequency (blue) and dissipation (red) shifts (7th overtone) of a SiO2 QCM-D sensor. The sensor was
sequentially exposed to the CL/DPPC liposomal solution (Section I), Tris–HCl buffer (Section II), cyt c solution
(Section III), and Tris–HCl buffer (Section IV). (A) and (B) correspond to ferric and ferrous cyt c, respectively.
(C) The masses of the adsorbed ferric (black) and ferrous (red) cyt c were estimated based on the Kelvin–Voigt
model. Concentration of CL/DPPC liposome: 230 μM; concentration of cyt c: 50 μM.
CL/DPPC Ferric cyt c-CL/DPPC Ferric cyt c Ferrous cyt c-CL/DPPC Ferrous cyt c
Mass (ng/cm2) 2585 3080 455.0 2730 185.0
Shear modulus (× 103 Pa) 6.334 9.217 2.883 10.83 4.325
Table 1. Mass and shear modulus of the CL/DPPC supported lipid membranes, cyt c-bound CL/DPPC
complex, and cyt c (difference between the former two). The values were estimated based on the Kelvin–Voigt
model.
ens the structure of cyt c in both ferric and ferrous states and potentially causes a substantially conformational
change or a structural extension.
Dynamic interaction monitored using QCM‑D. Compared with the end-point analysis of the global
deuteration of cyt c, a dynamic study is capable of offering insight into kinetics of the interaction between cyt
c and CL. We performed QCM-D to analyze the in situ binding behavior. A schematic summarizing the ana-
lytical procedures (Sections I–IV) is depicted in Supplementary Fig. S4. The corresponding frequency (f) and
dissipation (D) on the SiO2 sensor surface were recorded (Fig. 2A,B). As depicted in Section I of Fig. 2, f shifted
to approximately − 56.52 Hz (Fig. 2A) and − 56.22 (Fig. 2B) with a D of 4.07 × 10⁻⁶ (at the 7th overtone), which
indicated that the assembly of the CL/DPPC lipid layer on the S iO2 surface was reproducible. The subsequent
exposure to the Tris–HCl buffer altered both Δf and ΔD minimally (Section II). Crucially, a sequential exposure
of the supported CL/DPPC membrane to cyt c substantially increased and decreased f and D, respectively. With
the equilibration to the Tris–HCl buffer, the f of ferric cyt c shifted to − 82.50 Hz and D to 5.85 × 10⁻⁶ (Section
IV, Fig. 2A). These shifts were considerably greater than those yielded by ferrous cyt c (− 72.50 Hz on f and
4.93 × 10⁻⁶ of D), which indicated that ferric, rather than ferrous, cyt c exhibited stronger affinity with CL. Fur-
thermore, the greater dissipation shift (ΔD) was presumably attributed to an extensional structure of the ferric
cyt c-bound CL/DPPC complex. This result was consistent with that observed in global H/D exchange experi-
ments, in which 56 and 40 deuterons were retained in ferric and ferrous cyt c, respectively (Fig. 1).
On the basis of the change in f and D, the hydrated mass and shear modulus characteristic of the CL/DPPC-
supported lipid membrane, cyt c-bound CL/DPPC complex, and difference representing net cyt c were estimated
based on the Kelvin–Voigt model (Table 1). Accordingly, the masses of the ferric and ferrous cyt c bound with CL/
DPPC were estimated to be 455 and 185 ng/cm2, respectively, which suggested that ferric—rather than ferrous—
cyt c exhibited high affinity with CL (Fig. 2C). In addition, dissipation change data were used to estimate the shear
modulus of species in the layered format. Although the CL/DPPC lipid membrane exhibited a shear modulus of
approximately 6.334 × 10³ Pa, the interaction of cyt c with such lipid layers increased the shear modulus. Because
the value of the shear modulus was regarded as a measure of stiffness, the result revealed that cyt c rendered the
cyt c–CL/DPPC complex more rigid compared with bare CL/DPPC. In particular, ferrous cyt c enhanced the
stiffness more (shear modulus increase of 4.325 × 10³ Pa, which was greater than 2.883 × 10³ Pa of ferric cyt c).
Section III was further analyzed to understand the dynamic interaction between cyt c and CL/DPPC. The D
values, recorded during Section III of Fig. 2A,B, were plotted against the corresponding f (Fig. 3). Accordingly, the
|ΔD/Δf| ratio was calculated to determine the structural relaxation of the cyt c-bound CL/DPPC complex caused
by the per unit mass increase of cyt c. In both the ferric (Fig. 3A) and ferrous (Fig. 3B) cyt c cases, four |ΔD/
Δf| values were observed throughout the increasing f curve, which were represented in phases of a → b, b → c,
c → d, and beyond d (Fig. 3). The point a denotes the onset at which the CL/DPPC lipid of supported layer was
exposed to cyt c. D decreased with the increase in f until point b, the state with the smallest D. The a → b period
was short (15 and 28 s for ferric and ferrous cyt c, respectively). However, the |ΔD/Δf| of ferrous cyt c was greater
than that of ferric cyt c, which indicated that ferrous cyt c altered the CL/DPPC lipid layer at greater amplitude,
Scientific Reports | (2021) 11:1090 | https://doi.org/10.1038/s41598-020-79905-8 3
Vol.:(0123456789)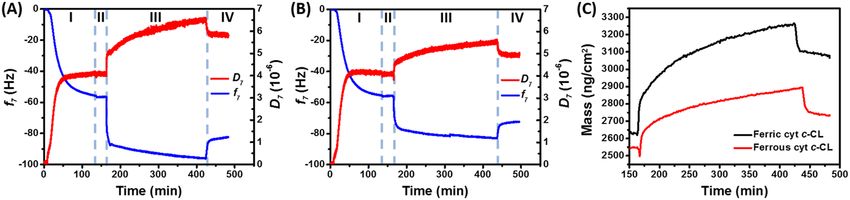
www.nature.com/scientificreports/
Figure 3. D–f curves of ferric (A) and ferrous (B) cyt c–CL interaction. The D values (7th overtone), recorded
in Section III of Fig. 2A,B, were plotted against the corresponding f. The a and b denote that the onset of the
CL/DPPC supported layer was in contact with cyt c and the state with the smallest D, respectively. The c and d
indicate the states at which |ΔD/Δf| changed.
presumably because of the higher shear modulus (rigidity) of ferrous cyt c (Table 1). Subsequently, D increased
with the increase in f at a constant |ΔD/Δf| from points b to c, after which |ΔD/Δf| changed. Ferric and ferrous
cyt c reached point c at approximately 60 and 121 s, respectively. Cyt c partially inserted into the CL/DPPC lipid
membranes and the structural extension of cyt c disrupted the order of the lipid layer within 1 min11,48,49. Analysis
of Δf (within 1-min) revealed a higher interaction rate of ferric cyt c (0.304 Hz s−1) and (0.173 Hz s−1 of ferrous
cyt c). Furthermore, ferric cyt c yielded a greater |ΔD/Δf| (4.141 × 10⁻⁸ Hz−1) compared with the 2.635 × 10⁻⁸ Hz−1
of ferrous cyt c within 1 min, which indicated that single ferric cyt c not only exhibited higher CL/DPPC affinity
but also rendered a complex and extended structure. Compared with the b → c period, the |ΔD/Δf| values in
the c → d period were smaller. However, the |ΔD/Δf| values observed beyond point d were greater than those in
the b → c duration. We proposed that point d was the end of the first molecular interaction layer. The gradual
decline on |ΔD/Δf| from c to d indicated that the late-interacting cyt c had less of an effect on the structure of
the cyt c–CL/DPPC complex because of the reduced negative charge of CL on the surface. The high |ΔD/Δf|
values beyond point d were attributed to the interaction beyond the first molecular layer of interaction. After
saturation in the first layer, the non-adsorbed cyt c exhibited physical adsorption instead of a specific electrostatic
interaction with CL/DPPC. As such, the |ΔD/Δf| represented the viscoelastic properties which were attributed
to pristine cyt c. Overall, the |ΔD/Δf| under the first layer (from points a to d) of the interaction was 3.457 × 10⁻⁸
and 2.718 × 10⁻⁸ Hz−1 for ferric and ferrous cyt c, respectively, which indicated a less dense structure of the ferric
cyt c-bound CL/DPPC complex. This was consistent with the results of previous studies11,49.
HDXMS of pepsin‑digested cyt c. In addition to using HDXMS and QCM-D, we aimed to retrieve
detailed regional information of the protein. The HDXMS data of the pepsin-digested ferric cyt c revealed that
55 peptides accounted for complete coverage of the protein primary sequence (Supplementary Fig. S5), which
indicated that the HDXMS result could provide information in every residue. The deuteration level of the rep-
resentative peptides in the specific regions of cyt c are presented under the primary sequence and mapped onto
a NMR structure in Supplementary Fig. S623. As mentioned earlier, heme is a Fe-containing ligand coordinating
with Met80 and His18 in the cyt c structure. The His18 containing loop was stabilized by both His18 coordi-
nation and covalent bonding between the Cys14 and Cys17 thiols and heme (Supplementary Fig. S6C). We
Scientific Reports | (2021) 11:1090 | https://doi.org/10.1038/s41598-020-79905-8 4
Vol:.(1234567890)www.nature.com/scientificreports/
Figure 4. Deuteration level of ferric (blue) and ferrous (red) cyt c represented by peptide fragments. The
difference in the deuteration level between ferric and ferrous cyt c is illustrated in percentage [(ferrous − ferric)/
ferric × 100%] in different colors (scale shown in the top-left corner). The time-course deuterium number of
each fragment related to the corresponding region of cyt c (the ribbon diagram shown in the center of the
figure) was recorded.
observed low deuteration levels in the loops 10–24, 25–32, and 35–46, which contained the L-site and a CL bind-
ing site composed of Lys22, Lys27, and His33, and were close to heme coordination residue His18. By contrast,
the Met80-containing loop and 70 s Helix region (67–82) were deuterated to a relatively high level. Another
CL binding region (A-site), containing Lys72, Lys73, Lys86, and Lys87, was located in this region. In addition,
the contact regions of n-terminal and c-terminal helices, as well as the 50 s helix, were deuterated to high levels
(Supplementary Fig. S6).
Redox‑dependent deuteration of cyt c. To investigate the conformational change of cyt c induced by
heme redox, an HDXMS analysis of ferrous cyt c was conducted. Compared with ferric cyt c, ferrous cyt c exhib-
ited a lower (0–20% reduction) level of deuteration in most fragments (Fig. 4), which indicated a stable structure
of the ferrous cyt c. The results were consistent with the higher shear modulus obtained through QCM-D. A
detailed examination of the heme-proximity region revealed that the heme reduction decreased deuteration of
regions 65–82, containing Met80. However, minimal changes occurred in regions 9–24, containing His18. The
contact area between C-terminal regions 95–104 and N-terminal regions 1–10 exhibited considerable decreases
in deuteration (approx. 50%). The disturbance of Fe-Met80 coordination had a limited effect on 60 s and 70 s
helices. Given that no changes were observed in His18, the effects on the N-terminal helix (i.e., the deutera-
tion decrease in this region) were probably affected by contact with the C-terminal helix. These results were
consistent with those obtained using N MR23, in which two redox states were compared. The results proved that
oxidation of the heme changed Fe-Met80 coordination and triggered a structural change to expose the heme
molecule outward. Approximately 15% of the surface area of heme (III) became solvent accessible, which was
higher than 7% of heme (II). This behavior highlighted the higher deuteration of ferric cyt c caused by the high
solvent accessibility.
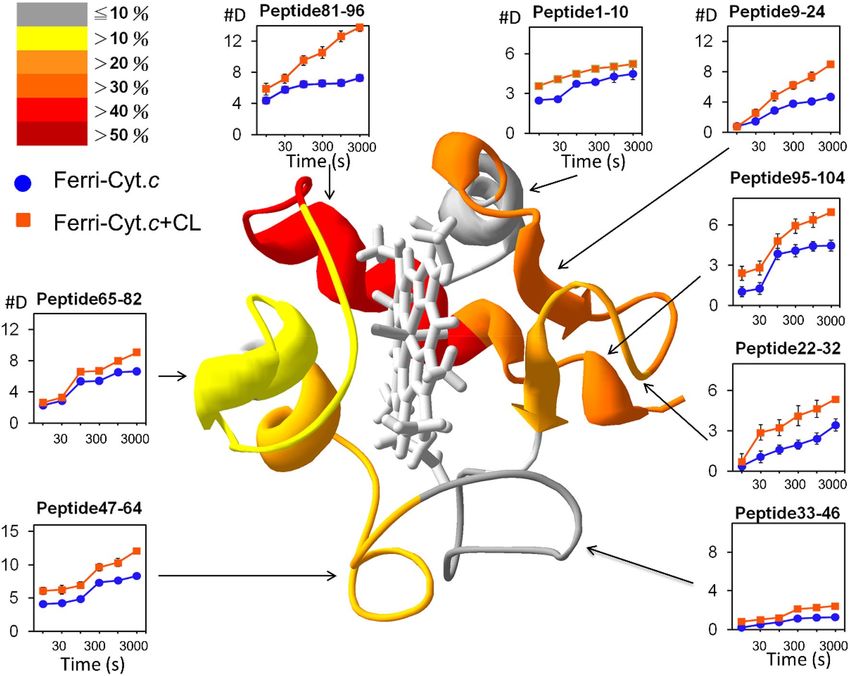
HDXMS study of CL‑bound cyt c. HDXMS analyses were conducted to investigate the structural change
caused by CL binding. Figure 5 displays the deuteration level of ferric cyt c (blue) and the CL-bound ferric cyt c
(orange) as functions of the time period of deuteration and peptide fragments. Generally, the deuteration level
increased by 1–50% upon CL binding. The C-terminal helix in particular exhibited drastic increases near the
thiol side of heme, including a 46.2% increase in regions 81–96, part of the A-site, and 32.5% increase in regions
Scientific Reports | (2021) 11:1090 | https://doi.org/10.1038/s41598-020-79905-8 5
Vol.:(0123456789)www.nature.com/scientificreports/
Figure 5. Deuteration level of ferric cyt c (blue) and the CL-bound ferric cyt c (orange) represented by peptide
fragments. Enhancement of deuteration caused by CL binding is illustrated in percentages and displayed
in different colors (scale shown in the top-left corner). The time-course deuterium number in each peptide
fragment with the corresponding region of cyt c is presented (the ribbon diagram shown in the center of the
figure).
95–104. The Loop 9–24 and Loop 22–32 on the L-site exhibited increases of 30.6% and 26.1%, respectively.
Because the two significantly affected regions were not physically in contact with each other, CL binding pre-
sumably distorted both regions simultaneously. The increase of cyt c deuteration indicated that CL binding did
not block the solvent accessibility in the binding regions, but increased the flexibility of cyt c with an extended
conformation.
By contrast, the deuteration increase of ferrous cyt c caused by CL binding was limited (Fig. 6), which could
be attributed to a compact structure. A minimal change occurred in the deuteration level of the N-terminus and
the His18-containing loop upon CL binding. Regions 9–24 in ferrous cyt c were stable and therefore CL binding
did not affect this heme coordination region. The deuteration level changed substantially in the regions 95–104
(28.9%) at C-helix and Loop 22–32 (30.1%). Regions 47–64 and 65–82 exhibited minor changes at 16.5% and
21.6%, respectively. Overall, the deuteration-enhanced regions and amplitude were similar to those of ferric
cyt c. Crucially, regions 9–24 exhibited a 30.6% change in ferric cyt c, compared with only 10.6% in ferrous cyt
c, which indicated that CL binding disturbed heme coordination with His18 in ferric cyt c, but not in ferrous
form. This also suggested that CL interacted with the A-site and L-site in ferric cyt c, but only with the A-site in
ferrous form. An alternating current voltammetric study on a cyt c-immobilized electrode also supported this
conclusion (Supplementary Fig. S7), in which the potential shift (24.1 mV) of ferric cyt c induced by CL binding
was greater than 9.20 mV of ferrous cyt c. Furthermore, the redox potential of cyt c, principally acted by heme,
shifted cathodically, which indicated a relatively facile electron transfer occurred upon CL binding.
Discussion
The results are summarized as follows: (i) CL binding had a different effect on ferric and ferrous cyt c in C-helix
and Loop 9–24. (ii) Loop 9–24, containing Fe coordination residue His18 and the thioether covalent bonding
residues Cys14 and Cys17, stabilized the relative position of heme and the protein structure. (iii) CL interac-
tion with ferric cyt c not only affected Met80 but also destabilized His18 interaction with heme, which was not
observed in ferrous cyt c. (iv) The C-helix on ferric cyt c was close to full deuteration after 30 min of deuteration,
which indicated a high exposure of this region; however, such behavior was not observed in ferrous cyt c. The
Scientific Reports | (2021) 11:1090 | https://doi.org/10.1038/s41598-020-79905-8 6
Vol:.(1234567890)www.nature.com/scientificreports/
Figure 6. Deuteration level of ferrous cyt c (red) and the CL-bound ferrous cyt c (green) represented by peptide
fragments. Enhancement of deuteration caused by CL binding is illustrated in percentages and displayed in
different colors (scale is shown in the top-left corner). The time-course deuterium number in each peptide
fragment with the corresponding region of cyt c is presented (the ribbon diagram shown in the center of the
Figure).
structured extension of C-helix also highlighted the conclusion revealed by F RET11. (v) The contacted N-helix
did not exceed a 10% difference, which indicated the interaction between the N-helix and C-helix remained
intact in this extended conformation.
Although studies on the activation mechanisms of phospholipase A 2 on membranes have indicated that
membrane association and penetration mostly cause decreased deuteration31,33,34, Skinner et al. proved that H/D
exchange depends primarily on the hydrogen bonding status of the amide hydrogen; only a minor contribution
is from solvent accessibility50,51. Thus, the increasing deuteration revealed in the current study was probably
because of the results of conformational changes and because of blocking solvent accessibility. Although either
the insertion of cyt c into CL/DOPC48,49 or the extended CL anchorage accommodated into cyt c52 was proposed,
our results suggested that cyt c did not, if any, only occurred in the very beginning association (within a couple
seconds), substantially penetrate into the hydrophobic motif of liposome.
On the basis of the aforementioned results, a model was proposed. In a healthy cell, the mitochondrial
intermembrane space full of protons is in an oxidizing state53. Therefore, protons compete with cyt c to associate
with CL54. Free ferric cyt c can therefore transfer electrons from ETC III to ETC IV. Under oxidative stress or
mitochondrial damage, the loss of proton gradient and electron transfer results in a low concentration of proton
and ferrous cyt c. Without competition from proton and ferrous cyt c, ferric cyt c tightly associates with CL. CL
binds to both the A- and L-sites of flexible ferric cyt c and triggers the structural extension of ferric cyt c, which
further activates cyt c. Less compact and extended cyt c exposes the active site on the CL-liposomal surface to
oxidize CL55. The oxidized CL inhibits the cyt c interacting with the mitochondrial inner membrane, leading to
the release of cyt c from mitochondria and the subsequent apoptosis process.
Methods
Chemicals and materials. Cyt c (from equine heart), phosphatidylcholine (eggPC, from egg yolk), 3-Mer-
captopropionic acid, 6-Mercaptohexanol, potassium chloride (KCl), sodium l-ascorbate, ethanol, 1-Octa-
decanethiol (ODT), trifluoroacetic acid (TFA), acetonitrile (ACN), and sinapinic acid were purchased from
Sigma (St. Louis, MO). The lipids 1,2-dipalmitoyl-sn-glycero-3-phosphocholine (DPPC) and 1′,3′-bis[1,2-diole-
Scientific Reports | (2021) 11:1090 | https://doi.org/10.1038/s41598-020-79905-8 7
Vol.:(0123456789)www.nature.com/scientificreports/
oyl-sn-glycero-3-phospho]-glycerol (18:1, CL) were obtained from Avanti Polar Lipids (Alabaster, AL). Sodium
dodecyl sulfate (SDS) was purchased from Merck (Darmstadt, Germany). Deuterium oxide (D2O, 99.9%) was
obtained from Cambridge Isotope Laboratories (Tewksbury, MA). Immobilized pepsin on 6% agarose beads
was purchased from Thermo Scientific (Waltham, MA). A protein assay dye reagent concentrate was purchased
from Bio-Rad (Hercules, CA). All aqueous solutions were prepared using ultrapure water (18.2 MΩ cm) from a
Milli-Q purification system (Millipore, Burlington, MA). A CL binding dye, 10-nonyl acridine orange (NAO),
was obtained from Enzo Life Sciences (Farmingdale, NY).
Preparation of CL/DPPC liposome. We adopted 20 mol% of (18:1)4CL/DPPC as the experimental sys-
tem. Considering the critical micelle concentration (CMC) difference between DOPC and DPPC56–58, the DPPC
liposome can be formed readily. Plus, lipids containing lower saturation of the fatty acyl chains were considered
to exist in inner membrane contact sites59. Furthermore, the literature also showed that 20 mol% of DPPC/CL
formed the most thermodynamically stable binary monolayer60. CL-containing liposome was prepared by dis-
solving DPPC (7.56 mg) and 18:1 CL (3.75 mg) at a molar ratio of 4:1 in chloroform in a glass vial. The chloro-
form was then evaporated using a rotary evaporator at 45 °C, leaving a liposomal gel film. The dried constituents
were reconstituted with 1 mL of 100 mM KCl (for HDXMS) or 50 mM Tris–HCl (pH 7.0, for QCM-D), and
sonicated at 60 °C for 30 min. The resulting liposome was sequentially extruded through a polycarbonate filter
(100 nm, Whatman) to form liposomal capsules. Before HDXMS experiments, the CL/DPPC liposome was
equilibrated in a 30 °C water bath for 30 min.
Matrix‑assisted laser desorption/ionization (MALDI‑TOF) analysis. A gold-coated silicon wafer
was used as the substrate in MALDI-TOF measurement. The wafer was treated with ODT (0.1 mM), which was
then fixed on the MALDI target plates and precooled on ice. The target plate was customized to compensate for
the thickness (1 mm) of the silicon wafer. The sample for MOLDI-TOF analysis was prepared by mixing 1 μL
each of cyt c and sinapinic acid. The mixture was then spotted onto the cooled substrate and dried in a moderate
vacuum. The dried sample was immediately analyzed using MALDI-TOF (Microflex, Bruker) at 4.2 × 10⁻⁶ bar,
70% laser energy (79 μJ), and 10 scan/sec for 30 s. The data were acquired and analyzed using the Mmass pro-
gram.
QCM‑D measurement. A QCM-D instrument (Q-sense E1, Q-sense, Gothenburg, Sweden) was used to
monitor the interaction between cyt c and CL. An SiO2-coated quartz crystal (QSX 303, Q-sense) sensor was
first cleaned by immersion in 2% SDS for 30 min, followed by UV ozone treatment for 10 min, before being
installed into the QCM-D chamber. To form lipid bilayers on the surface of the S iO2 sensors, a CL-containing
liposomal solution (1 mg/mL, equilibrated in 50 mM Tris–HCl buffer, pH 7.4) was pumped (200 µL/min) over
the SiO2 sensor surface for 2 h. Subsequently, the flow liquid was changed to 50 mM Tris–HCl buffer to remove
excess liposomes. Then, either a ferric or ferrous cyt c solution (50 µM) was drawn (200 µL/min) over the CL-
containing lipid bilayer for 4 h. Nonspecifically adsorbed cyt c was subsequently removed using the Tris–HCl
buffer (50 mM, pH 7.4). QCM-D measurement was performed at overtones 1, 3, 5, 7, 9, 11, and 13 of a fun-
damental frequency in 5 MHz at 25 °C. The dynamic shifts on both frequency and dissipation were acquired.
The hydrated mass and shear modulus were estimated using Q-tools (Biolin Scientific, Gothenburg, Sweden)
software based on the Kelvin–Voigt model, with densities of the lipid membrane and protein of 1.1 and 1.35 g/
cm3, respectively61.
Preparation of deuterated samples. Prior to hydrogen/deuterium (H/D) exchange experiments, 60 μL
of cyt c (16.6 mg/mL) was mixed with 40 μL of the prepared liposomal solution and incubated at 30 °C for
10 min. H/D exchange experiments were initiated by mixing 5 μL of the aforementioned mixture with 20 μL of
95% D2O buffer (125 mM Tris, 50 mM NaCl, pH7.5) to a final concentration of 76% D2O at pH 7.5 and 125 μM
lipid vesicles. The samples were incubated at 23 °C for an additional 10, 30, 100, 300, 1000, or 3000 s. The deu-
terium exchange was quenched by adding 175 μL of TFA (0.1%). The samples were then immediately digested
using pepsin-bound agarose beads on ice for 5 min and quickly vortexed every 30 s.
Electrospray ionization (ESI)‑MS/MS analysis. The pepsin-digested cyt c was manually injected and
trapped by the Trap column (Optimize, 3 mm cartridge). The deuterated peptides were subsequently separated
using a high-performance liquid chromatography C18 column (Biobasic 5 μm 50 mm × 1 mm, Thermo Scien-
tific) and then sequentially analyzed through ESI–MS or ESI–MS/MS (Esquire 6000, Bruker, Billerica, MA). The
gradient of the mobile phase was varied from 0% A solution (0.1% TFA) and 100% B solution (0.01% TFA, 80%
ACN) to 100% A in 40 min at a flow rate of 0.1 mL/min. The buffer, column, and tubing were immersed in ice
escribed29. Back exchange levels were calculated based on 24-h fully deuterated samples as
water as previously d
previously reported62.
Data analysis. An intensity threshold (5000-count) of the peptides was first filtered using Data Analysis 3.4
(Bruker Corporation). The sequence of the peptides was identified through MS/MS analysis in triplicate. Peptide
identification was performed on an X!Tandem parser 1.7.7 followed by further manual examination of product
ions. The peptides that were recognized more than twice and with an excellent ion match in the product ion
spectrum were selected into the pool. HDexaminer 1.3 (Sierra Analytics) was used for the mass spectra analysis,
which was similar to a previously described v ersion29. The results were incorporated into HDexaminer, which
retrieved the charges, sequences, and retention times from the mass data. The software evaluated the match
Scientific Reports | (2021) 11:1090 | https://doi.org/10.1038/s41598-020-79905-8 8
Vol:.(1234567890)www.nature.com/scientificreports/
between the experimental data and theoretical mass envelopes, and provided a score for each peptide fragment.
Every mass envelope was further manually examined to ensure the mass envelope was identified correctly. The
mass shifts at different time points of 0, 10, 30, 100, 300, 1000, and 3000 s were calculated individually. The
deuteration level of each peptide was determined using the ratio of the incorporated deuteron number to the
maximum possible deuteration number. Because of the fast off-exchange rate of the two N-terminal residues,
those residues could not retain any deuterons after liquid chromatography and therefore were not included in
the calculation.
Conclusions
The differential conformational change of cyt c during CL-association was confirmed by the results from the
QCM-D and HDXMS analyses. The data indicated that ferric cyt c, not ferrous cyt c, exhibited an extended and
partially unfolded structure on the lipid surface. The domains of cyt c were not inserted into the liposome; if
they did, it would likely occur at the initial stage for a few seconds. This was highlighted by the increasing deu-
teration and dissipation shift in the initial interaction. The CL molecule was proposed to be extracted out of the
lipid aggregates to act as the substrate for a cyt c-induced peroxidation, which presumably caused the decreasing
dissipation observed in the beginning stage of interaction (Section III).
Received: 16 July 2020; Accepted: 4 December 2020
References
1. Jain, R., Agarwal, M. C., Kumar, R., Sharma, D. & Kumar, R. Effects of lyotropic anions on thermodynamic stability and dynamics
of horse cytochrome c. Biophys. Chem. 240, 88–97 (2018).
2. Bozelli, J. C. Jr. & Epand, R. M. Determinants of lipids acyl chain specificity: A tale of two enzymes. Biophys. Chem. 265, 106431
(2020).
3. Kalanxhi, E. & Wallace, C. J. A. Cytochrome c impaled: Investigation of the extended lipid anchorage of a soluble protein to mito-
chondrial membrane models. Biochem. J. 407, 179–187. https://doi.org/10.1042/Bj20070459 (2007).
4. Sinibaldi, F. et al. Insights into cytochrome c-cardiolipin interaction. Role played by ionic strength. Biochemistry 47, 6928–6935.
https://doi.org/10.1021/bi800048v (2008).
5. Lesnefsky, E. J., Slabe, T. J., Stoll, M. S. K., Minkler, P. E. & Hoppel, C. L. Myocardial ischemia selectively depletes cardiolipin in
rabbit heart subsarcolemmal mitochondria. Am. J. Physiol. Heart Circ. Physiol. 280, H2770–H2778 (2001).
6. Paradies, G. et al. Decrease in mitochondrial complex I activity in ischemic/reperfused rat heart—Involvement of reactive oxygen
species and cardiolipin. Circ. Res. 94, 53–59. https://doi.org/10.1161/01.Res.0000109416.56608.64 (2004).
7. Paradies, G., Petrosillo, G. & Ruggiero, F. M. Cardiolipin-dependent decrease of cytochrome c oxidase activity in heart mitochon-
dria from hypothyroid rats. Biochim. Biophys. Acta Bioenergy 1319, 5–8. https://doi.org/10.1016/S0005-2728(97)00012-1 (1997).
8. Belikova, N. A. et al. Peroxidase activity and structural transitions of cytochrome c bound to cardiolipin-containing membranes.
Biochemistry 45, 4998–5009. https://doi.org/10.1021/bi0525573 (2006).
9. Ott, M., Zhivotovsky, B. & Orrenius, S. Role of cardiolipin in cytochrome c release from mitochondria. Cell Death Differ. 14,
1243–1247. https://doi.org/10.1038/sj.cdd.4402135 (2007).
10. Bergstrom, C. L., Beales, P. A., Lv, Y., Vanderlick, T. K. & Groves, J. T. Cytochrome c causes pore formation in cardiolipin-containing
membranes. Proc. Natl. Acad. Sci. U.S.A. 110, 6269–6274. https://doi.org/10.1073/pnas.1303819110 (2013).
11. Hanske, J. et al. Conformational properties of cardiolipin-bound cytochrome c. Proc. Natl. Acad. Sci. U.S.A. 109, 125–130. https
://doi.org/10.1073/pnas.1112312108 (2012).
12. Hong, Y. N., Muenzner, J., Grimm, S. K. & Pletneva, E. V. Origin of the conformational heterogeneity of cardiolipin-bound
cytochrome c. J. Am. Chem. Soc. 134, 18713–18723. https://doi.org/10.1021/ja307426k (2012).
13. Gentry, K. A. et al. Kinetic and structural characterization of the effects of membrane on the complex of cytochrome b 5 and
cytochrome c. Sci. Rep. 7, 1–15 (2017).
14. Yang, J. et al. Prevention of apoptosis by Bcl-2: Release of cytochrome c from mitochondria blocked. Science 275, 1129–1132. https
://doi.org/10.1126/science.275.5303.1129 (1997).
15. Green, D. R. Apoptotic pathways: Ten minutes to dead. Cell 121, 671–674. https://doi.org/10.1016/j.cell.2005.05.019 (2005).
16. Lan, W. X. et al. Structural basis for cytochrome c Y67H mutant to function as a peroxidase. PLoS ONE https://doi.org/10.1371/
journal.pone.0107305 (2014).
17. Rytomaa, M. & Kinnunen, P. K. Evidence for two distinct acidic phospholipid-binding sites in cytochrome c. J. Biol. Chem. 269,
1770–1774 (1994).
18. Kawai, C. et al. pH-dependent interaction of cytochrome c with mitochondrial mimetic membranes—The role of an array of
positively charged amino acids. J. Biol. Chem. 280, 34709–34717. https://doi.org/10.1074/jbc.M412532200 (2005).
19. Sinibaldi, F. et al. Role of lysines in cytochrome c-cardiolipin interaction. Biochemistry 52, 4578–4588. https://doi.org/10.1021/
bi400324c (2013).
20. Rajagopal, B. S., Silkstone, G. G., Nicholls, P., Wilson, M. T. & Worrall, J. A. R. An investigation into a cardiolipin acyl chain inser-
tion site in cytochrome c. Biochim. Biophys. Acta Bioenergy 780–791, 2012. https://doi.org/10.1016/j.bbabio.2012.02.010 (1817).
21. Takano, T. & Dickerson, R. E. Conformation change of cytochrome c. II. Ferricytochrome c refinement at 1.8 A and comparison
with the ferrocytochrome structure. J. Mol. Biol. 153, 95–115. https://doi.org/10.1016/0022-2836(81)90529-5 (1981).
22. Takano, T. & Dickerson, R. E. Conformation change of cytochrome c. I. Ferricytochrome c structure refined at 1.5 A resolution.
J. Mol. Biol. 153, 79–94. https://doi.org/10.1016/0022-2836(81)90529-5 (1981).
23. Qi, P. X. R., Beckman, R. A. & Wand, A. J. Solution structure of horse heart ferricytochrome c and detection of redox-related
structural changes by high-resolution H-1 NMR. Biochemistry 35, 12275–12286. https://doi.org/10.1021/bi961042w (1996).
24. Volkov, A. N., Vanwetswinkel, S., Van de Water, K. & van Nuland, N. A. J. Redox-dependent conformational changes in eukaryotic
cytochromes revealed by paramagnetic NMR spectroscopy. J. Biomol. NMR 52, 245–256. https://doi.org/10.1007/s10858-012-
9607-8 (2012).
25. Berghuis, A. M. & Brayer, G. D. Oxidation state-dependent conformational-changes in cytochrome-C. J. Mol. Biol. 223, 959–976.
https://doi.org/10.1016/0022-2836(92)90255-I (1992).
26. Shah, R. & Schweitzer-Stenner, R. Structural changes of horse heart ferricytochrome c induced by changes of ionic strength and
anion binding. Biochemistry 47, 5250–5257. https://doi.org/10.1021/bi702492n (2008).
27. Brown, G. C. & Borutaite, V. Regulation of apoptosis by the redox state of cytochrome c. Biochim. Biophys. Acta Bioenergy 1777,
877–881. https://doi.org/10.1016/j.bbabio.2008.03.024 (2008).
Scientific Reports | (2021) 11:1090 | https://doi.org/10.1038/s41598-020-79905-8 9
Vol.:(0123456789)www.nature.com/scientificreports/
28. Bradley, J. M., Silkstone, G., Wilson, M. T., Cheesman, M. R. & Butt, J. N. Probing a complex of cytochrome c and cardiolipin by
magnetic circular dichroism spectroscopy: Implications for the initial events in apoptosis. J. Am. Chem. Soc. 133, 19676–19679.
https://doi.org/10.1021/ja209144h (2011).
29. Hamuro, Y. et al. Mapping intersubunit interactions of the regulatory subunit (RI alpha) in the type I holoenzyme of protein kinase
A by amide hydrogen/deuterium exchange mass spectrometry (DXMS). J. Mol. Biol. 340, 1185–1196. https://doi.org/10.1016/j.
jmb.2004.05.042 (2004).
30. Mendillo, M. L. et al. Probing DNA- and ATP-mediated conformational changes in the MutS family of mispair recognition proteins
using deuterium exchange mass spectrometry. J. Biol. Chem. 285, 13170–13182. https://doi.org/10.1074/jbc.M110.108894 (2010).
31. Burke, J. E. et al. A phospholipid substrate molecule residing in the membrane surface mediates opening of the lid region in group
IVA cytosolic phospholipase A(2). J. Biol. Chem. 283, 31227–31236. https://doi.org/10.1074/jbc.M804492200 (2008).
32. Burke, J. E. et al. Interaction of group IA phospholipase A2 with metal ions and phospholipid vesicles probed with deuterium
exchange mass spectrometry. Biochemistry 47, 6451–6459. https://doi.org/10.1021/bi8000962 (2008).
33. Hsu, Y. H., Burke, J. E., Li, S., Woods, V. L. & Dennis, E. A. Localizing the membrane binding region of group VIA Ca2+-independ-
ent phospholipase A(2) using peptide amide hydrogen/deuterium exchange mass spectrometry. J. Biol. Chem. 284, 23652–23661.
https://doi.org/10.1074/jbc.M109.021857 (2009).
34. Cao, J., Hsu, Y. H., Li, S., Woods, V. L. & Dennis, E. A. Lipoprotein-associated phospholipase A(2) interacts with phospholipid
vesicles via a surface-disposed hydrophobic alpha-helix. Biochemistry 50, 5314–5321. https://doi.org/10.1021/bi101916w (2011).
35. Englander, J. J. et al. Protein structure change studied by hydrogen-deuterium exchange, functional labeling, and mass spectrometry.
Proc. Natl. Acad. Sci. U.S.A. 100, 7057–7062. https://doi.org/10.1073/pnas.1232301100 (2003).
36. Hochrein, J. M., Lerner, E. C., Schiavone, A. P., Smithgall, T. E. & Engen, J. R. An examination of dynamics crosstalk between
SH2 and SH3 domains by hydrogen/deuterium exchange and mass spectrometry. Protein Sci. 15, 65–73. https://doi.org/10.1110/
ps.051782206 (2006).
37. Hook, F., Rodahl, M., Kasemo, B. & Brzezinski, P. Structural changes in hemoglobin during adsorption to solid surfaces: Effects
of pH, ionic strength, and ligand binding. Proc. Natl. Acad. Sci. U.S.A. 95, 12271–12276. https://doi.org/10.1073/pnas.95.21.12271
(1998).
38. Jonsson, M. P., Jonsson, P. & Hook, F. Simultaneous nanoplasmonic and quartz crystal microbalance sensing: Analysis of bio-
molecular conformational changes and quantification of the bound molecular mass. Anal. Chem. 80, 7988–7995. https://doi.
org/10.1021/ac8008753 (2008).
39. Molino, P. J., Higgins, M. J., Innis, P. C., Kapsa, R. M. I. & Wallace, G. G. Fibronectin and bovine serum albumin adsorption and
conformational dynamics on inherently conducting polymers: A QCM-D study. Langmuir 28, 8433–8445. https: //doi.org/10.1021/
la300692y (2012).
40. Bailey, C. M. et al. Size dependence of gold nanoparticle interactions with a supported lipid bilayer: A QCM-D study. Biophys.
Chem. 203, 51–61 (2015).
41. Pandidan, S. & Mechler, A. Membrane morphology effects in quartz crystal microbalance characterization of antimicrobial peptide
activity. Biophys. Chem. 262, 106381 (2020).
42. Li, J. et al. The behavior of the adsorption of cytochrome C on lipid monolayers: A study by the Langmuir-Blodgett technique and
theoretical analysis. Biophys. Chem. 205, 33–40 (2015).
43. Choi, S. & Swanson, J. M. Interaction of cytochrome c with cardiolipin: An infrared spectroscopic study. Biophys. Chem. 54,
271–278 (1995).
44. Yamamoto, K., Caporini, M. A., Im, S.-C., Waskell, L. & Ramamoorthy, A. Transmembrane interactions of full-length mammalian
bitopic cytochrome-P450-cytochrome-b 5 complex in lipid bilayers revealed by sensitivity-enhanced dynamic nuclear polarization
solid-state NMR spectroscopy. Sci. Rep. 7, 1–13 (2017).
45. Zhang, M., Huang, R., Im, S.-C., Waskell, L. & Ramamoorthy, A. Effects of membrane mimetics on cytochrome P450-cytochrome
b5 interactions characterized by NMR spectroscopy. J. Biol. Chem. 290, 12705–12718 (2015).
46. Negrerie, M., Cianetti, S., Vos, M. H., Martin, J. L. & Kruglik, S. G. Ultrafast heme dynamics in ferrous versus ferric cytochrome
c studied by time-resolved resonance Raman and transient absorption spectroscopy. J. Phys. Chem. B 110, 12766–12781. https://
doi.org/10.1021/jp0559377 (2006).
47. Nelson, D. L., Lehninger, A. L. & Cox, M. M. Lehninger Principles of Biochemistry. fifth editiom edn, (Freeman, 2008).
48. Gorbenko, G. P. Structure of cytochrome c complexes with phospholipids as revealed by resonance energy transfer. Biochim.
Biophys. Acta Biomembr. 1420, 1–13. https://doi.org/10.1016/S0005-2736(99)00082-6 (1999).
49. Muenzner, J., Toffey, J. R., Hong, Y. N. & Pletneva, E. V. Becoming a peroxidase: Cardiolipin-induced unfolding of cytochrome c.
J. Phys. Chem. B 117, 12878–12886. https://doi.org/10.1021/jp402104r (2013).
50. Skinner, J. J., Lim, W. K., Bedard, S., Black, B. E. & Englander, S. W. Protein dynamics viewed by hydrogen exchange. Protein Sci.
21, 996–1005. https://doi.org/10.1002/pro.2081 (2012).
51. Skinner, J. J., Lim, W. K., Bedard, S., Black, B. E. & Englander, S. W. Protein hydrogen exchange: Testing current models. Protein
Sci. 21, 987–995. https://doi.org/10.1002/pro.2082 (2012).
52. Sinibaldi, F. et al. Extended cardiolipin anchorage to cytochrome c: a model for protein–mitochondrial membrane binding. J. Biol.
Inorg. Chem. 15, 689–700 (2010).
53. Hu, J., Dong, L. & Outten, C. E. The redox environment in the mitochondrial intermembrane space is maintained separately from
the cytosol and matrix. J. Biol. Chem. 283, 29126–29134 (2008).
54. Parui, P. P. et al. Determination of proton concentration at cardiolipin-containing membrane interfaces and its relation with the
peroxidase activity of cytochrome c. Chem. Sci. 10, 9140–9151 (2019).
55. Kagan, V. E. et al. Cytochrome c acts as a cardiolipin oxygenase required for release of proapoptotic factors. Nat. Chem. Biol. 1,
223–232 (2005).
56. Chen, B., Han, A., McClements, D. J. & Decker, E. A. Physical structures in soybean oil and their impact on lipid oxidation. J. Agric.
Food Chem. 58, 11993–11999 (2010).
57. Cui, L., Kittipongpittaya, K., McClements, D. J. & Decker, E. A. Impact of phosphoethanolamine reverse micelles on lipid oxidation
in bulk oils. J Am Oil Chem Soc 91, 1931–1937 (2014).
58. Smith, R. & Tanford, C. The critical micelle concentration of l-α-dipalmitoylphosphatidylcholine in water and water/methanol
solutions. J. Mol. Biol. 67, 75–83 (1972).
59. Ardail, D. et al. Mitochondrial contact sites. Lipid composition and dynamics. J. Biol. Chem. 265, 18797–18802 (1990).
60. Phan, M. D. & Shin, K. Effects of cardiolipin on membrane morphology: A Langmuir monolayer study. Biophys. J. 108, 1977–1986
(2015).
61. Edvardsson, M. et al. QCM-D and reflectometry instrument: Applications to supported lipid structures and their biomolecular
interactions. Anal. Chem. 81, 349–361. https://doi.org/10.1021/ac801523w (2009).
62. Hsu, Y. H. et al. Calcium binding rigidifies the C2 domain and the intradomain interaction of GIVA phospholipase A(2) as revealed
by hydrogen/deuterium exchange mass spectrometry. J. Biol. Chem. 283, 9820–9827. https://doi.org/10.1074/jbc.M708143200
(2008).
Scientific Reports | (2021) 11:1090 | https://doi.org/10.1038/s41598-020-79905-8 10
Vol:.(1234567890)www.nature.com/scientificreports/
Acknowledgements
The Ministry of Science and Technology Taiwan supported this work under contracts MOST 107-2113-M-029-
007-MY2, MOST 109-2113-M-029-005-MY3, MOST 109-2113-M-029-006, MOST 108-2113-M-029-008, MOST
107-2113-M-029-008.
Author contributions
Y.-H. and M.-C. conceived the study, developed the project, and edited the manuscript. H.-W. and Y.-T. con-
ducted HDXMS experiments and made data collection. S.-C. conducted QCM-D experiments and data analyses.
Competing interests
The authors declare no competing interests.
Additional information
Supplementary Information The online version contains supplementary material available at https://doi.
org/10.1038/s41598-020-79905-8.
Correspondence and requests for materials should be addressed to M.-C.C. or Y.-H.H.H.
Reprints and permissions information is available at www.nature.com/reprints.
Publisher’s note Springer Nature remains neutral with regard to jurisdictional claims in published maps and
institutional affiliations.
Open Access This article is licensed under a Creative Commons Attribution 4.0 International
License, which permits use, sharing, adaptation, distribution and reproduction in any medium or
format, as long as you give appropriate credit to the original author(s) and the source, provide a link to the
Creative Commons licence, and indicate if changes were made. The images or other third party material in this
article are included in the article’s Creative Commons licence, unless indicated otherwise in a credit line to the
material. If material is not included in the article’s Creative Commons licence and your intended use is not
permitted by statutory regulation or exceeds the permitted use, you will need to obtain permission directly from
the copyright holder. To view a copy of this licence, visit http://creativecommons.org/licenses/by/4.0/.
© The Author(s) 2021
Scientific Reports | (2021) 11:1090 | https://doi.org/10.1038/s41598-020-79905-8 11
Vol.:(0123456789)You can also read