The stable carbon isotope signature of methane produced by saprotrophic fungi
←
→
Page content transcription
If your browser does not render page correctly, please read the page content below
Biogeosciences, 17, 3891–3901, 2020
https://doi.org/10.5194/bg-17-3891-2020
© Author(s) 2020. This work is distributed under
the Creative Commons Attribution 4.0 License.

The stable carbon isotope signature of methane
produced by saprotrophic fungi
Moritz Schroll1 , Frank Keppler1,2 , Markus Greule1 , Christian Eckhardt3 , Holger Zorn4 , and Katharina Lenhart5,6
1 Institute of Earth Sciences, Heidelberg University, Im Neuenheimer Feld 236, 69120 Heidelberg, Germany
2 Heidelberg   Center for the Environment (HCE), Heidelberg University, Im Neuenheimer Feld 229,
69120 Heidelberg, Germany
3 Department of Plant Ecology, Justus Liebig University Giessen, IFZ, 26–32, 35392 Giessen, Germany
4 Institute of Food Chemistry and Food Biotechnology, Justus Liebig University Giessen, IFZ, 58, 35392 Giessen, Germany
5 Centre for Organismal Studies (COS), Im Neuenheimer Feld 230, 69120 Heidelberg, Germany
6 Bingen University of Applied Sciences, Berlinstraße 109, 55411 Bingen, Germany

Correspondence: Moritz Schroll (moritz.schroll@geow.uni-heidelberg.de) and Katharina Lenhart (k.lenhart@th-bingen.de)

Received: 25 March 2020 – Discussion started: 2 April 2020
Revised: 9 June 2020 – Accepted: 24 June 2020 – Published: 31 July 2020

Abstract. Methane (CH4 ) is the most abundant organic com-          similar δ 13 CH4 source values when grown on pine wood,
pound in the atmosphere and is emitted from many biotic and         δ 13 CH4 source values differed substantially between the two
abiotic sources. Recent studies have shown that CH4 produc-         fungal species when they were grown on grass or corn. We
tion occurs under aerobic conditions in eukaryotes, such as         found that the source values of δ 13 CH4 emitted by sapro-
plants, animals, algae, and saprotrophic fungi. Saprotrophic        trophic fungi are highly dependent on the fungal species
fungi play an important role in nutrient recycling in terrestrial   and the metabolized substrate. The source values of δ 13 CH4
ecosystems via the decomposition of plant litter. Although          cover a broad range and overlap with values reported for
CH4 production by saprotrophic fungi has been reported,             methanogenic archaea, the thermogenic degradation of or-
no data on the stable carbon isotope values of the emitted          ganic matter, and other eukaryotes.
CH4 (δ 13 C-CH4 values) are currently available. In this study,
we measured the δ 13 C values of CH4 and carbon dioxide
(δ 13 C-CO2 values) emitted by two saprotrophic fungi, Pleu-
rotus sapidus (oyster mushroom) and Laetiporus sulphureus           1   Introduction
(sulphur shelf), cultivated on three different substrates, pine
wood (Pinus sylvestris), grass (mixture of Lolium perenne,          Methane (CH4 ) is an important greenhouse gas that is emit-
Poa pratensis, and Festuca rubra), and corn (Zea mays),             ted by several abiotic sources (e.g. fossil fuel, biomass
which reflect both C3 and C4 plants with distinguished bulk         burning, and geological processes) and biotic sources (e.g.
δ 13 C values. Applying Keeling plots, we found that the δ 13 C     wetlands, agriculture and waste, and fresh waters) to the
source values of CH4 emitted from fungi cover a wide range          atmosphere (Kirschke et al., 2013; Saunois et al., 2016,
from −40 to −69 mUr depending on the growth substrate               2020). In the past, biotic CH4 production has been attributed
and fungal species. Whilst little apparent carbon isotopic          exclusively to strictly anaerobic microorganisms, such as
fractionation (in the range from −0.3 to 4.6 mUr) was cal-          methanogens, that are ubiquitous in wetlands, rice pad-
culated for the δ 13 C values of CO2 released from P. sapidus       dies, landfills, and the intestines of termites and ruminants
and L. sulphureus relative to the bulk δ 13 C values of the         (Kirschke et al., 2013). The discovery of CH4 emissions from
growth substrates, much larger carbon isotopic fractionations       dead and living plants under oxic conditions (Keppler et al.,
(ranging from −22 to −42 mUr) were observed for the for-            2006, 2009) paved the way for the search for new biogenic
mation of CH4 . Although the two fungal species showed              CH4 sources. Since then, several previously unknown CH4
                                                                    sources have been discovered, including the endothelial cells

Published by Copernicus Publications on behalf of the European Geosciences Union.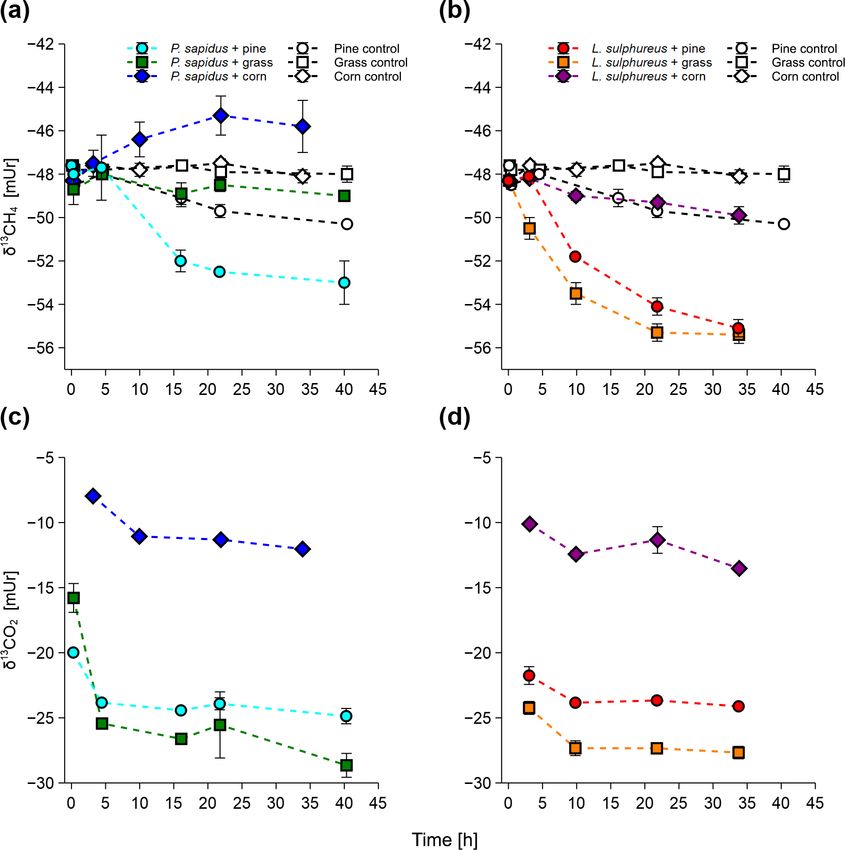
3892                                                                     M. Schroll et al.: The stable carbon isotope signature

of rat liver (Boros and Keppler, 2019; Ghyczy et al., 2008),       (−52 to −69 mUr; Keppler et al., 2006), and abiotic UV-
plant cell cultures (Wishkerman et al., 2011), marine algae        induced CH4 formation by plants (−52 to −67 mUr; Vigano
(Klintzsch et al., 2019; Lenhart et al., 2016), marine and ter-    et al., 2009) also need to be considered.
restrial cyanobacteria (Bižić et al., 2020), humans (Keppler         In this study, we investigated the stable carbon isotope
et al., 2016), and saprotrophic fungi (Lenhart et al., 2012).      source signatures of CH4 and CO2 released by the two ba-
   Fungi play a central role in ecosystems by decomposing          sidiomycetes Pleurotus sapidus (white rot fungus) and Laeti-
organic matter, thereby recycling formerly bound carbon and        porus sulphureus (brown rot fungus). Both fungi were cul-
nutrients (Grinhut et al., 2007). This process is especially im-   tivated under sterile conditions on three different substrates
portant in forests where fungi are essential for wood decay        (pine wood, grass, and corn) with varying bulk δ 13 C values.
and have a great impact on the carbon and nitrogen cycles          We examined the influence of fungal species and growth sub-
(Ralph and Catcheside, 2002). White rot fungi (e.g. Tram-          strate on δ 13 C-CH4 and δ 13 C-CO2 values and compared the
etes versicolor or Pleurotus ostreatus) are able to decom-         δ 13 C-CH4 values from the two fungal species with those of
pose the chemically complex structural component lignin,           other known sources reported in the literature.
whereas brown rot fungi (e.g. Serpula lacrymans or Gloeo-
phyllum trabeum) mainly metabolize cellulose and hemicel-
lulose (Ten Have and Teunissen, 2001; Leonowicz et al.,            2     Material and methods
1999; Valášková and Baldrian, 2006). Fungi have already
                                                                   2.1    Selected fungi
been determined to be involved in the synthesis of CH4
during wood decay (Beckmann et al., 2011; Mukhin and               P. sapidus (Pleurotaceae, DSMZ 8266) and L. sulphureus
Voronin, 2007, 2008) via the breakdown of large macro-             (Polyporacaeae, DSMZ 1014) were chosen for this experi-
molecules to smaller molecules, thereby providing bacteria         ment because of their capability to emit CH4 (Lenhart et al.,
and archaea with essential substrate. Elevated levels of CH4       2012), their ecological and physiological characteristics (P.
were found in fungus-infected wood stems with oxygen con-          sapidus is a white rot fungus and L. sulphureus is a brown
centrations ranging from 1 % to 14 % (Hietala et al., 2015).       rot fungus), and their well-established practical handling un-
Here, CH4 production was associated with anoxic microsites         der laboratory conditions.
in the xylem, indicating that at least part of the CH4 was
produced by methanogenic archaea. Nevertheless, Lenhart et         2.2    Cultivation of fungi and incubation experiments
al., 2012 demonstrated that basidiomycetes are able to pro-
duce CH4 under aerobic conditions without the presence of          Pine wood (Pinus sylvestris), grass (mixture of Lolium
methanogenic archaea. Therefore, fungi might be an under-          perenne, Poa pratensis, and Festuca rubra) and corn (Zea
estimated source of CH4 in the global CH4 cycle.                   mays) were selected as growth substrates. Pine wood was
   Stable carbon isotopes (expressed as δ 13 C values) have of-    chosen to investigate if white rot and brown rot fungi differ
ten been used to investigate sources and sinks of CH4 on the       with respect to the δ 13 C-CH4 and δ 13 C-CO2 values released
global scale (Whiticar, 1993). As different CH4 sources have       during wood decay. Therefore, dead pine wood branches
characteristic δ 13 C values, δ 13 C-CH4 values might be used      were collected from the forest floor and shredded to small
to quantify the individual contributions of various sources re-    wood chips with a length of about 5 cm (Natura 1800L;
gionally and/or globally (Dlugokencky et al., 2011; Hein et        Gloria, Witten, Germany). The wood chips were dried at
al., 1997; Nisbet et al., 2016; Quay et al., 1999; Tyler, 1986;    60 ◦ C for 48 h and stored in a flask (WECK GmbH, Hanau,
Whiticar, 1999). The short lifetime of CH4 in the atmosphere       Germany). Grass (C3 plant) and corn (C4 plant) were se-
(from 9.7 ± 1.5 to 11.2 ± 1.3 years; Naik et al., 2013; Prather    lected because of their different stable isotope values. As the
et al., 2012; Voulgarakis et al., 2013) assures that global iso-   metabolic pathway for carbon fixation is biochemically dif-
topic δ 13 C-CH4 patterns represent the average of recent in-      ferent in C3 and C4 plants, plant biomass differs with respect
puts by various sources and allows for the quantification of       to δ 13 C values, which, in turn, might lead to different δ 13 C
respective source strengths (Mikaloff Fletcher et al., 2004a,      values of CH4 and CO2 released by fungi. Therefore, typi-
b).                                                                cal garden lawn was manually cut, dried at 70 ◦ C, and stored
   Additionally, stable isotopes provide information about         in a flask. The corn substrate consisted of conventional corn
the formation processes of CH4 . Traditionally, three for-         flour.
mation categories of δ 13 C-CH4 values have been identi-              The substrates were autoclaved, filled into 2.7 L flasks
fied: biogenic, with typical δ 13 C-CH4 values ranging from        (WECK GmbH, Hanau, Germany), and inoculated with pure
∼ −55 to −70 mUr; thermogenic, with typical δ 13 C-CH4             fungal submerged cultures under sterile conditions follow-
values ranging from ∼ −25 to −55 mUr; and pyrogenic, with          ing Lenhart et al. (2012). After the addition of the fungi, the
typical δ 13 C-CH4 values ranging from ∼ −13 to −25 mUr            flasks were closed with lids and a rubber band sealing. To
(Kirschke et al., 2013). However, stable isotope values of         allow gas exchange during the fungal growth period (about
recently identified CH4 sources, i.e. human CH4 emissions          2 weeks), a hole in the centre of every lid was fitted with
(−56 to −95 mUr; Keppler et al., 2016), plant-derived CH4          a cotton stopper. Before the start of the incubation experi-

Biogeosciences, 17, 3891–3901, 2020                                                   https://doi.org/10.5194/bg-17-3891-2020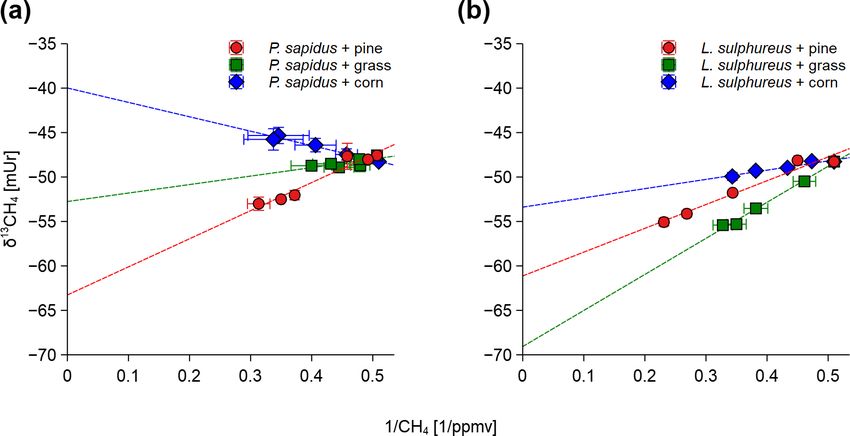
M. Schroll et al.: The stable carbon isotope signature                                                                            3893

ments, the flasks were aerated under sterile conditions in or-       2.4   Definition of δ values and isotope apparent
der to start the incubation at atmospheric CH4 mixing ratios.              fractionation
Additionally, to create an airtight seal, the flask’s cotton stop-
pers were replaced by sterile silicone stoppers (Saint-Gobain        In this paper, all stable carbon isotope ratios are expressed
Performance Plastics, Charny, France).                               in the conventional “delta” (δ) notation, meaning the relative
   For the incubation experiments, P. sapidus and L. sul-            difference of the isotope ratio of a substance from the stan-
phureus were incubated on the three substrates, while                dard substance Vienna Peedee Belemnite (V-PDB):
uninoculated substrates were also incubated as control treat-                  13
                                                                                 C
                                                                               12 C
ments. Before the incubation experiments, the substrates              13              sample
were sterilized by autoclaving at 121 ◦ C and 2 bar pressure         δ C =  13               −1                                  (1)
                                                                                  C
                                                                               12 C
for 20 min. The incubation experiments were conducted us-                           V-PDB
ing three replicates per treatment. The duration of the incuba-      The apparent fractionation (εapp ) between fungal δ 13 C-CH4
tion accounted for up to 40 h. All incubations were conducted        or δ 13 C-CO2 values and the δ 13 C values of the substrates was
at room temperature (23 ± 1.5 ◦ C). At every sampling point,         calculated according to Eq. (2):
40 mL of air was taken from the flasks for gas concentration
measurements and an additional 40 mL was taken for δ 13 C-                                     (δ 13 C + 1)fungal CH4 or CO2
                                                                     εapp CH4 or CO2 =                                       −1    (2)
CH4 stable isotope ratio mass spectrometry (IRMS) analysis.                                          (δ 13 C + 1)substrate
The gas samples were taken with airtight 60 mL PE syringes           We follow the proposal of Brand and Coplen (2012) and use
(Plastipak, BD, Franklin Lakes, USA) and transferred into            the term “urey” (Ur) as the isotope delta unit, in order to
12 mL evacuated Exetainer vials (Labco, High Wycombe,                conform with the guidelines for the International System of
UK). Subsequently, a volume of atmospheric air equivalent            Units (SI). Hence, isotope delta values that were formerly
to the volume of the removed sample was added into each              given as −70 ‰ are expressed as −70 mUr.
flask directly after sampling. Mixing ratios and stable isotope
values of CH4 were corrected according to the dilution.              2.5   Measurements of δ 13 CH4 and δ 13 CO2 values
   When calculating the fungal CH4 and CO2 production
rates, we subtracted substrate-derived CH4 and CO2 produc-           Stable carbon isotope values of CH4 and CO2 were measured
tion rates (determined using the control treatments) from the        using a continuous flow isotope mass spectrometry system
respective fungi-containing samples. Additionally, only sam-         (CF-IRMS). A HP 6890N GC (Agilent, Santa Clara, USA)
ple points showing a linear increase in CH4 and CO2 were             was linked to a pre-concentration unit for CH4 measure-
considered in the calculation of the fungal production rates.        ments and an A200S autosampler (CTC Analytics, Zwingen,
   To account for differences in the metabolic activity of the       Switzerland) for CO2 analysis. The GC was equipped with
fungi, we additionally measured respiration rates, assuming          a CP-PoraPLOT Q capillary column (27.5 m × 0.25 mm i.d.,
that metabolic activity correlates with respiration and, there-      film thickness 8 µm; Varian, Palo Alto, USA). The GC was
fore, the CO2 emissions of the fungi. Hence, we related              operated with an injector temperature of 200 ◦ C, an isother-
fungus-derived CH4 emissions to respiration by calculating           mal oven temperature of 30 ◦ C, split injection (10 : 1), and a
the CH4 : CO2 emission ratio.                                        constant carrier gas flow of 1.8 mL min−1 (methane-free he-
                                                                     lium). The GC was coupled to a DeltaPLUS XL isotope ratio
2.3   Analysis of CH4 and CO2 via gas chromatography                 mass spectrometer (ThermoQuest Finnigan, Bremen, Ger-
                                                                     many) via an oxidation reactor and a GC Combustion III
Samples were analysed using a gas chromatograph (GC,                 interface (ThermoQuest Finnigan, Bremen, Germany). The
Bruker Greenhouse Gas Analyser 450-GC) equipped with                 oxidation reactor was employed with the following proper-
a flame ionization detector (FID) and an electron capture            ties: a ceramic tube (Al2 O3 ; length 320 mm, 1.0 mm i.d.)
detector (ECD) for the detection of CH4 and CO2 respec-              with Ni/Pt wires inside activated by oxygen and a reactor
tively. The detector temperatures were set at 300 ◦ C (FID)          temperature of 960 ◦ C.
and 350 ◦ C (ECD). Five reference gases (Deuste Steininger              For CH4 measurements with the pre-concentration unit,
GmbH) were used to calibrate the GC system. The reference            headspace gas samples were transferred to an evacuated
gases were in the range from 1 ppmv (parts per million by            40 mL sample loop. Methane was trapped on HayeSep D,
volume) to 21 and from 304 to 40 000 ppmv for CH4 and                separated from other compounds by the GC, and then intro-
CO2 respectively. Gas peaks were integrated using Galaxie            duced into the IRMS system via an open split. The moni-
software (Varian Inc., Palo Alto, CA, USA).                          tor gas was carbon dioxide of high purity (carbon dioxide
                                                                     4.5, Messer Griesheim, Frankfurt, Germany) with a known
                                                                     δ 13 C value of −23.6 mUr (calibrated at the Max Planck In-
                                                                     stitute for Biogeochemistry in Jena, Germany). All δ 13 C val-
                                                                     ues were corrected using two CH4 reference standards (Iso-
                                                                     metric instruments, Victoria, Canada) with δ 13 C values of

https://doi.org/10.5194/bg-17-3891-2020                                                         Biogeosciences, 17, 3891–3901, 2020
3894 M. Schroll et al.: The stable carbon isotope signature
−23.9±0.2 and −54.5±0.2 mUr that were calibrated against plots. Corrected δ 13 C-CH4 source values for P. sapidus and
International Atomic Energy Agency (IAEA) and National L. sulphureus are given as the arithmetic mean of the three
Institute of Standards and Technology (NIST) reference sub- individual flasks per treatment with their standard deviations
stances. The normalization of the sample values was carried (n = 3).
out according to Paul et al. (2007). The determination coefficient (R 2 ) of the Keeling plots
showed values higher than 0.93 except for P. sapidus grown
2.6 Bulk isotope analysis of fungal substrates on grass (R 2 = 0.51). The lower R 2 value for P. sapidus
grown on grass is probably a result of the marginal changes
Stable carbon isotope values of the bulk substrate were mea- in the δ 13 C-CH4 values due to the small increase in the CH4
sured using an FlashEA 1112 elemental analyser (Thermo mixing ratio compared with the background CH4 mixing ra-
Fisher Scientific, Germany) coupled to a Delta V IRMS tio. Therefore, the low R 2 does not necessarily indicate a
(Thermo Fisher Scientific, Germany). Therefore, 0.06 mg of weaker relationship between the CH4 mixing ratio and the
the substrate was put into a tin cup and combusted in the δ 13 C-CH4 value.
elemental analyser. The resulting gases were separated in
a GC by a CP-PoraPLOT Q capillary column (27.5 m × 2.8 Statistics
0.25 mm i.d., film thickness 8 µm; Varian, Palo Alto, USA)
and then reached the Delta V IRMS via a Conflo IV univer- Mixing ratios and production rates of CH4 , CO2 , δ 13 C-CH4
sal continuous flow interface (Thermo Fisher Scientific, Ger- values, and δ 13 C-CO2 values as well as δ 13 C source values
many). Isotope values were corrected using USGS 40 and are presented as the arithmetic mean of three independent
USGS 41 standards. replicates with their standard deviations (n = 3). Linear re-
gression analysis, the arithmetic means, and their standard
2.7 Determination of isotopic source signature of CH4 deviations were calculated using Microsoft Excel (Microsoft
and CO2 applying Keeling plots Excel for Office 365 MSO). Two-way analysis of variance
(ANOVA) tests (SigmaPlot 12.2.0.45, USA) were carried out
For the determination of δ 13 C source values of CH4 and CO2 , to test for species- and substrate-related effects on the δ 13 C-
the Keeling plot method was used (Keeling, 1958; Pataki et CH4 and δ 13 C-CO2 source values for each treatment. Differ-
al., 2003): ences at the p < 0.05 level were referred to as significant.
1
δ 13 Ca = cb δ 13 Cb − δ 13 Cs + δ 13 Cs , (3)
ca 3 Results and discussion
where ca is the mixing ratio of CH4 /CO2 in the headspace,
In this section, we firstly present the results of CH4 and CO2
δ 13 Ca is the δ 13 C value of CH4 /CO2 in the headspace, cb is
production from the two fungal species grown on the three
the mixing ratio of background CH4 /CO2 , δ 13 Cb is the δ 13 C
different substrates. This includes emission rates of CH4 and
value of background CH4 /CO2 , and δ 13 Cs is the δ 13 C source
CO2 from the control treatments of pine wood, grass, and
value of the CH4 /CO2 . For a more detailed description of
corn as well as the molar ratio of CH4 and CO2 . Secondly,
the application of Keeling plots for the determination of the
we then present the respective stable isotope values measured
CH4 source signature, we refer to the study by Keppler et
for CH4 and CO2 during the incubation experiments and cal-
al. (2016).
culate the stable isotope source values of CH4 and CO2 re-
δ 13 C-CH4 source signatures were calculated following the
leased by the fungi applying Keeling plots. We then compare
Keeling plot method for each flask. Results of the Keeling
these values with stable carbon isotope values of the bulk
plots are then given as the arithmetic mean of the three in-
organic matter by calculating the apparent fractionation. Fi-
dividual flasks per treatment with their standard deviations
nally, we compare δ 13 C source values of fungus-derived CH4
(n = 3).
with known values for other CH4 sources from the literature.
The δ 13 C-CH4 source signatures of each flask of P.
sapidus and L. sulphureus grown on pine were corrected for 3.1 Release of CH4 and CO2 from P. sapidus and L.
CH4 emissions and δ 13 C-CH4 values of the “pine” control sulphureus
samples using the following mass balance approach:
All incubation experiments in which fungi were grown on
δ 13 Cfungi corrected =
different substrates showed a significant increase in CH4
P (CH4 )fungi · δ 13 Cfungi − (P (CH4 )pine · δ 13 Cpine )
compared with the respective substrate control (Fig. 1a, c).
, (4) Calculated emission rates for CH4 and CO2 are presented in
(P (CH4 )fungi − P (CH4 )pine )
Table 1. L. sulphureus grown on grass (7.5 ± 1.3 nmol h−1 )
where P (CH4 )fungi/pine wood is the CH4 emitted by the fungi showed the highest emission rate of CH4 , followed by L.
or pine wood, and δ 13 Cfungi/pinewood is the δ 13 C-CH4 source sulphureus grown on pine (6.2 ± 0.3 nmol h−1 ), P. sapidus
signature of the fungi or pine wood derived from the Keeling grown on corn (4.4 ± 1.9 nmol h−1 ), L. sulphureus grown
Biogeosciences, 17, 3891–3901, 2020 https://doi.org/10.5194/bg-17-3891-2020M. Schroll et al.: The stable carbon isotope signature 3895
real-time polymerase chain reaction), Lenhart et al. (2012)
clearly showed that no methanogenic archaea were present
in the same method of cultivation of fungi and incubation
experiments that were performed in this study. Furthermore,
CH4 and CO2 release and the CH4 : CO2 emission ratios in
our incubations are similar to the experiments of Lenhart
et al. (2012) and do not indicate microbial contamination.
Therefore, we assume that no contamination with bacteria or
methanogenic archaea was present in our investigations.
For P. sapidus grown on corn and L. sulphureus grown on
grass, no further linear increase in CH4 was observed after
22 and 10 h respectively. This might be due to the reduced
decay of organic matter and slower fungal metabolism owing
to higher CO2 and lower O2 mixing ratios.
A drastic increase in CO2 mixing ratios relative to the con-
trols was observed in all flasks containing fungi (Fig. 1b, d).
The CO2 emission rates are shown in Table 1. CO2 produc-
tion rates ranged from 176 ± 4 to 2910 ± 410 µmol h−1 for
P. sapidus grown on grass and P. sapidus grown on corn re-
spectively. These highly variable CO2 production rates might
reflect different fungal biomass and metabolic activity (min-
Figure 1. Mixing ratios of CH4 and CO2 of P. sapidus (a, c) and eralization of organic matter). In the control treatments, tiny
L. sulphureus (b, d) grown on pine wood, grass, and corn. Mixing increases in the CO2 mixing ratio were detected ranging
ratios are presented as mean values with their standard deviation from 0.64 ± 0.12 to 0.91 ± 0.14 µmol h−1 . Only one flask
(n = 3).
(corn control) showed a somewhat higher increase in CO2
(7.76 µmol h−1 ), which was most likely caused by microbial
contamination of the flask. However, no increase in the CH4
on corn (2.6 ± 0.1 nmol h−1 ), P. sapidus grown on pine mixing ratio was detected (see Supplement). Therefore, this
(2.5 ± 0.2 nmol h−1 ), and P. sapidus grown on grass (1.4 ± control flask was excluded from further calculations.
0.5 nmol h−1 ). Please note that CH4 and CO2 emission rates Mean CH4 and CO2 emission rates and CH4 : CO2 emis-
are not related to fungal biomass. Therefore, differences in sion ratios of all treatments are presented in Table 1. Higher
the emission rates might be due to varying fungal biomass of ratios indicate a higher CH4 production during decay of
the subsamples. Instead, CH4 production was related to CO2 the substrates. Therefore, both fungal species and substrate
production by determining the molar emission ratio between affect the CH4 : CO2 emission ratio (p < 0.001). For P.
CH4 and CO2 (µmol CH4 : mol CO2 ). Thus, CO2 production sapidus, CH4 : CO2 emission ratios are more variable (1.4 to
reflects the amount of fungal biomass and is also an indicator 8.0 µmol CH4 /mol CO2 ) compared with L. sulphureus (6.7–
of the metabolic activity of the fungi. 9.6 µmol CH4 /mol CO2 ). This variation might be due to dif-
The control flasks did not show significant changes in ferences in the fungi’s enzyme sets required for organic mat-
their CH4 and CO2 mixing ratios over time, except for CH4 ter decay, as P. sapidus is a white rot fungus and L. sul-
in pine wood controls (1.3 ± 0.1 nmol h−1 ). However, small phureus is a brown rot fungus. At present, the biochemical
CH4 emission rates of 0.25 ± 0.01 nmol h−1 were observed pathways that lead to CH4 are still unknown, although com-
in the control flasks of corn, and the CH4 mixing ratio pounds such as the sulfur-bound methyl-group of methionine
slightly decreased over time in the grass control (−0.05 ± and glucose have been identified to act as carbon precursors
0.04 nmol h−1 ). Whilst the pine wood and corn control flasks of fungus-derived CH4 (Lenhart et al., 2012).
showed a small increase in the CH4 mixing ratio, they did not Lenhart et al., 2012 found CH4 : CO2 ratios of
show an increase in the CO2 mixing ratios. These data rule fungi that ranged between 8 µmol CH4 /mol CO2 and
out contamination by microbial heterotrophs, as this would 17 µmol CH4 /mol CO2 , which is in the same order of mag-
cause a measurable CO2 increase within the flasks. The nitude as the CH4 : CO2 ratios determined in this study. It
CH4 increase in the substrate controls might be attributed to should be noted that, for better comparability, the CH4 : CO2
CH4 release by dead plant material, as was already shown ratios of Lenhart et al. (2012; given in ppbv CH4 : % CO2 )
by Keppler et al. (2006) and Vigano et al. (2009). Within were converted to fit the CH4 : CO2 ratio units used in this
the scope of these experiments, no analytic test for micro- study (µmol CH4 : mol CO2 ).
bial contamination was conducted. Nevertheless, using three
different methods (fluorescence in situ hybridization, FISH;
confocal laser scanning microscopy, CLSM; and quantitative
https://doi.org/10.5194/bg-17-3891-2020 Biogeosciences, 17, 3891–3901, 20203896 M. Schroll et al.: The stable carbon isotope signature
Table 1. CH4 and CO2 production rates and molar CH4 : CO2 emission ratios of the fungi incubated on different substrates. Values are
presented as mean values of three independent replicates with their standard deviation (n = 3), except for the control “corn” (n = 2).
Fungi Substrate CH4 production rate CO2 production rate CH4 : CO2 ratio
(nmol h−1 ) (µmol h−1 ) (µmol mol−1 )
P. sapidus Pine 2.5 ± 0.2 901 ± 79 2.8 ± 0.4
Grass 1.4 ± 0.5 176 ± 4 8.0 ± 2.8
Corn 4.4 ± 1.9 2910 ± 419 1.4 ± 0.5
L. sulphureus Pine 6.2 ± 0.3 724 ± 42 8.6 ± 1.0
Grass 7.5 ± 1.3 771 ± 103 9.6 ± 0.5
Corn 2.6 ± 0.1 385 ± 20 6.7 ± 0.4
Control Pine 1.3 ± 0.1 0.64 ± 0.12 –
Grass −0.05 ± 0.04 0.91 ± 0.14 –
Corn 0.25 0.66 –
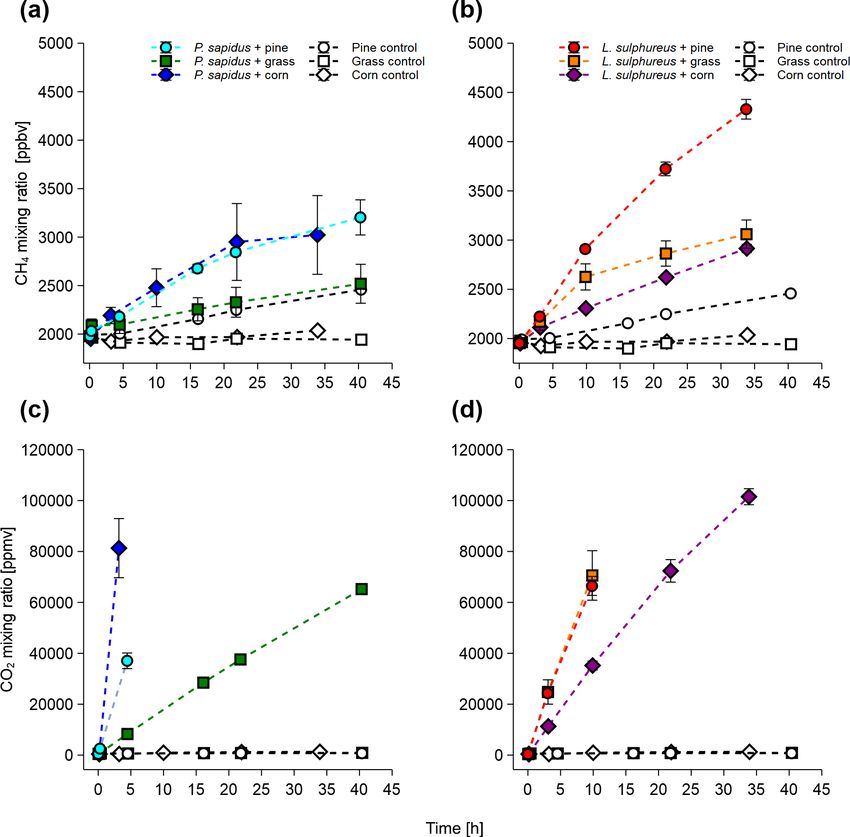
(for the incubation of P. sapidus grown on corn and L. sul-
phureus grown on pine/grass/corn) to −53.0 ± 0.7 mUr (for
P. sapidus grown on pine), −48.7 ± 0.3 mUr (for P. sapidus
grown on grass), −45.8 ± 1.2 mUr (for P. sapidus grown on
corn), −55.1 ± 0.4 mUr (for L. sulphureus grown on pine),
−55.4 ± 0.4 mUr (for L. sulphureus grown on grass), and
−49.9±0.4 mUr (for L. sulphureus grown on corn). The con-
trols showed no significant shift in δ 13 C-CH4 values except
for the pine control, where an increase in the CH4 mixing
ratio along with more negative values of δ 13 C-CH4 values
occurred over time. This was accounted for when calculating
the δ 13 C-CH4 source signatures for P. sapidus grown on pine
and L. sulphureus grown on pine (see Sect. 2.7).
The δ 13 C-CO2 values showed a trend towards more neg-
ative values within the first 3–4 h of incubation (Fig. 2c, d).
After this time, only minor changes in the δ 13 C-CO2 val-
ues occurred. Final δ 13 C-CO2 values of the incubation were
−24.9 ± 0.6 mUr (for P. sapidus grown on pine), −28.6 ±
0.9 mUr (for P. sapidus grown on grass), −12.0 ± 0.3 mUr
(for P. sapidus grown on corn), −24.1 ± 0.1 mUr (for L. sul-
phureus grown on pine), −27.7 ± 0.5 mUr (for L. sulphureus
Figure 2. Stable carbon isotope values of CH4 and CO2 of P. grown on grass), and −13.0 ± 0.5 mUr (for L. sulphureus
sapidus (a, c) and L. sulphureus (b, d) grown on pine, grass, and grown on corn).
corn. Values are presented as mean values with their standard devi-
ation (n = 3), except for δ 13 CO2 values of L. sulphureus grown on 3.3 δ 13 C-CH4 and δ 13 C-CO2 source signatures of fungi
corn (n = 2).
The δ 13 C-CH4 source signatures determined via a Keeling
plot analysis (Fig. 3) that ranged from −69.2 ± 1.9 mUr (for
3.2 Stable carbon isotope values of CH4 and CO2 L. sulphureus grown on grass) to −39.8 ± 2.0 mUr (for P.
sapidus grown on corn) are presented in Table 2. Average
Stable carbon isotope values of CH4 and CO2 measured from δ 13 C-CH4 source signatures for each fungal species, con-
the incubation experiments are presented in Fig. 2. All in- sidering all three substrates, are −52.6 mUr for P. sapidus
cubations show a trend towards more negative δ 13 C-CH4 and −61.3 mUr for L. sulphureus. These results suggest that
values (less 13 C) with time except for P. sapidus grown on the fungal species significantly influence the isotopic values
corn, where a tendency towards more positive δ 13 C-CH4 val- of the emitted CH4 (p < 0.001). A possible explanation for
ues was observed (Fig. 2a, b). During the incubation, δ 13 C- this observation could be the different enzyme sets of both
CH4 values changed from −47.7 ± 0.1 mUr (for the incuba- fungi that decompose different components of the growth
tion of P. sapidus grown on pine/grass) and −48.2 ± 0.1 mUr substrates, as P. sapidus belongs to white rot fungi and L.
Biogeosciences, 17, 3891–3901, 2020 https://doi.org/10.5194/bg-17-3891-2020M. Schroll et al.: The stable carbon isotope signature 3897
Table 2. Calculated δ 13 C-CH4 and δ 13 C-CO2 source signatures, δ 13 C values of the substrates, and εapp CH4 and εapp CO2 . Values are
presented as mean values with their standard deviation (n = 3).
Fungi Substrate δ 13 C-CH4 δ 13 C-CO2 δ 13 C substrate εapp CH4 εapp CO2
source (mUr) source (mUr) (mUr) (mUr) (mUr)
P. sapidus Pine −65.3 ± 1.1 −24.1 ± 0.1 −38.4 ± 1.2 4.0 ± 0.1
Grass −52.9 ± 1.6 −27.4 ± 1.3 −21.8 ± 1.7 4.6 ± 1.3
Corn −39.8 ± 2.0 −12.0 ± 0.3 −28.5 ± 2.0 −0.3 ± 0.3
L. sulphureus Pine −61.4 ± 0.5 −25.0 ± 0.5 −34.4 ± 0.6 3.0 ± 0.4
Grass −69.2 ± 1.9 −29.0 ± 0.5 −38.6 ± 2.0 2.9 ± 0.5
Corn −53.4 ± 1.1 −12.8 ± 0.3 −42.2 ± 1.1 −1.1 ± 0.3
Control Pine −28.0 ± 0.5
Grass −31.5 ± 0.6
Corn −11.7 ± 0.1
Figure 4. Calculated source signatures of δ 13 C-CH4 values (a) and
Figure 3. Keeling plots shown for P. sapidus (a) and L. sul-
δ 13 C-CO2 values (b) from P. sapidus, L. sulphureus as well as the
phureus (b) grown on the three substrates. Sample points in the
δ 13 C values of the substrate. The data points represent the mean
graphs are given as the arithmetic mean of the δ 13 C-CH4 or δ 13 C-
values of the individual Keeling plots with their standard deviation
CO2 values with their standard deviation (n = 3) on the y axis and
(n = 3).
the arithmetic mean of the inverted mixing ratio of CH4 or CO2
with their standard deviation (n = 3) on the x axis.
sulphureus is a brown rot fungus. However, detailed investi- The comparison of calculated δ 13 C-CH4 source signatures
gations of the metabolic pathways leading to CH4 formation with measured bulk δ 13 C values of the substrates shows
were beyond the scope of this study. that CH4 emitted by both fungi is generally depleted in 13 C
Furthermore, a significant effect of the growth substrate compared with the respective substrates (Fig. 4a). Based
on δ 13 C-CH4 source signatures was observed (p < 0.001). on these data, we further calculated the apparent fraction-
δ 13 C-CH4 source signatures from P. sapidus were more pos- ation (εapp CH4 ) between the δ 13 C-CH4 source signatures
itive compared with those of L. sulphureus when grown on and the bulk δ 13 C values of the growth substrates. The ap-
grass (1 = 16.3 mUr) and corn (1 = 13.6 mUr) (Fig. 4). parent fractionation was calculated as no metabolic path-
When grown on pine wood, δ 13 C-CH4 source signatures way for the formation of CH4 in fungi is presently known;
were similar, with P. sapidus showing slightly more nega- therefore, only the initial δ 13 C signatures of the substrates
tive values (1 = −3.9 mUr). Methane emitted by both fungi and the calculated δ 13 C-CH4 source signatures of the fungi
grown on corn was generally more enriched in 13 C (less can currently be compared. The values of εapp CH4 that
negative δ 13 C-CH4 source values) compared with the fungi range from −21.8 mUr (for P. sapidus grown on grass) to
grown on pine wood and grass. This might be easily ex- −42.2 mUr (for L. sulphureus grown on corn) are presented
plained by the δ 13 C values of the corn growth substrates in Table 2. When grown on pine wood, εapp CH4 values
(−11.7 mUr, which is typical for C4 plants) being roughly are similar for P. sapidus (−38.4 ± 1.2 mUr) and L. sul-
20 mUr less negative in their δ 13 C values compared with the phureus (−34.4 ± 0.6 mUr). The differences in εapp CH4 val-
C3 plants, pine wood (−28.0 mUr) and grass (−31.5 mUr). ues between both fungal species are distinct when grown on
grass (P. sapidus: −21.8 ± 1.7 mUr; L. sulphureus: −38.6 ±
https://doi.org/10.5194/bg-17-3891-2020 Biogeosciences, 17, 3891–3901, 20203898 M. Schroll et al.: The stable carbon isotope signature
2.0 mUr) and corn (P. sapidus: −28.5 ± 2.0 mUr; L. sul-
phureus: −42.2 ± 1.1 mUr).
The calculated δ 13 C-CO2 source signatures of both fungi
(Table 2) range from −29.0 ± 0.5 mUr (for L. sulphureus
grown on grass) to −12.0 ± 0.3 mUr (for P. sapidus grown
on corn). δ 13 C-CO2 source signatures are in a similar range
for both fungi for all three substrates. However, CO2 emit-
ted by L. sulphureus is slightly more depleted in 13 C for all
three substrates compared with P. sapidus. Hence, the ef-
fect of fungal species on the stable carbon isotope values
of CO2 is significant (p = 0.008). Moreover, the substrates
used were found to influence δ 13 C-CO2 values significantly
(p < 0.001).
The δ 13 C-CO2 source signatures of the fungi show only
small deviations from the bulk δ 13 C values of the respective
substrates (Fig. 4b). However, for both fungi grown on pine
wood and grass, δ 13 C-CO2 values are slightly less negative
Figure 5. The range of δ 13 C-CH4 values of microbial CH4 sources
(a few mUr) compared with the bulk substrate. This obser-
(red), abiotic CH4 sources (grey), eukaryotic CH4 sources (green),
vation is rather unexpected, as δ 13 C-CO2 values are usually atmospheric CH4 (blue), and fungal CH4 from this study (orange).
more negative with respect to δ 13 C values of growth sub- The red and grey dashed bar indicates a mixture of microbial and
strates due to fractionation during metabolism (Bowling et abiotic CH4 formation processes for gas hydrates (Kvenvolden,
al., 2008). However, when grown on corn δ 13 C-CO2 source 1995). Data were taken from Brownlow et al. (2017), Keppler et
signatures from both fungi are more negative compared with al. (2006, 2016), Kvenvolden (1995), Nisbet et al. (2016), Quay et
the substrate, and calculated εapp CO2 values (Table 2) are al. (1999), and Vigano et al. (2009).
−1.1±0.3 mUr and +4.6±1.3 mUr for L. sulphureus grown
on corn and P. sapidus grown on grass respectively.
The results of the incubation experiments show that there archaea) CH4 sources with emissions from wetlands, rumi-
are distinct differences in the δ 13 C-CH4 and δ 13 C-CO2 val- nants, landfills, and rice paddies where δ 13 C-CH4 values usu-
ues released by both fungi. While the δ 13 C-CO2 source sig- ally range from −85 to −40 mUr. Abiotic CH4 sources (in-
natures are similar to the δ 13 C values of the substrate (with cluding thermogenic or pyrolytic processes) stemming from
εapp CO2 values of up to 4.6 mUr), the δ 13 C-CH4 source sig- natural gas, coal mining, and biomass burning are charac-
natures deviate strongly from the respective substrate, with terized by less negative δ 13 C values usually ranging from
εapp CH4 values of up to −42.2 mUr. This either indicates −55 to −20 mUr. In addition, gas hydrates, which might be
that metabolic pathways leading to the formation of CH4 formed by both microbial and abiotic processes, cover a wide
and CO2 have different fractionation and/or that fungal CH4 range of δ 13 C values (−29 to −73 mUr) depending on their
and CO2 are derived from different precursor compounds of formation mechanisms (Kvenvolden, 1995). The δ 13 C source
the respective substrate. The growth substrates used for this signatures of plant-derived CH4 have been reported to be in
study (pine wood, grass, and corn) contain distinct amounts the range of −72 to −45 mUr (Keppler et al., 2006; Vigano et
of cellulose, hemicellulose, lignin, and other compounds in al., 2009) depending on their photosynthetic pathways (C3 ,
different proportions (in contrast to only using pure glu- C4 , or CAM). Furthermore, there was a tendency towards
cose or cellulose as the growth substrate). Hence, the δ 13 C- more negative δ 13 C-CH4 values when the respective plant
CH4 and δ 13 C-CO2 source signatures depend on the specific was treated with UV radiation (Vigano et al., 2009). δ 13 C-
metabolic pathways used by the fungal species as well as the CH4 source signatures of humans, which might include for-
chemical composition of the growth substrate. The selected mation by microbes in the gut as well as formation by cellu-
fungi and the growth substrates used provide a first solid ba- lar processes, show a rather wide range with values between
sis for the potential range of δ 13 C-CH4 values that might oc- −95 and −56 mUr (Keppler et al., 2016). The results of our
cur in nature. experiments conducted with two fungal species and three dif-
ferent growth substrates provide a range of δ 13 C-CH4 source
3.4 Fungal δ 13 C-CH4 values compared with known values from −69 to −40 mUr. This range overlaps with other
CH4 sources eukaryotic sources, most microbial CH4 sources, and even
some abiotic CH4 sources such as natural gas or emissions
Figure 5 compares the δ 13 C-CH4 values emitted by fungi in from coal mining.
relation to other known CH4 sources in the environment that
have been reported in the literature. The red bars indicate typ-
ical biogenic (formerly only considered to be produced by
Biogeosciences, 17, 3891–3901, 2020 https://doi.org/10.5194/bg-17-3891-2020M. Schroll et al.: The stable carbon isotope signature 3899
4 Conclusions Acknowledgements. We thank Anette Giesemann for analytical
measurements of stable carbon isotope values of the bulk substrates.
This study provided the first analysis of stable carbon isotope We are grateful to Bianka Daubertshäuser for technical support with
values of CH4 emitted by two saprotrophic fungi that were the cultivation of the fungi and to Lukas Kohl for encouraging us to
grown on three different substrates. δ 13 C-CH4 and δ 13 C- perform this study. We acknowledge financial support from the Ger-
CO2 source values were found to be dependent on the fungal man Research Foundation (Deutsche Forschungsgemeinschaft).
species as well as the substrates decomposed by the fungi.
δ 13 C-CH4 source values of the fungi were found to be in
the range of −69 to −40 mUr and, therefore, overlap with Financial support. This research has been supported by the Ger-
man Research Foundation (DFG grant nos. KE 884/8-2, KE 884/16-
δ 13 C-CH4 values reported for other CH4 sources such as
2 and LE3381/1-1).
methanogenic archaea, eukaryotes, and from abiotic CH4
sources (e.g. natural gas and coal mining). Stable carbon iso-
tope values of CH4 in combination with flux measurements
Review statement. This paper was edited by Tina Treude and re-
are often applied for a better understanding of regional and viewed by Lukas Kohl and one anonymous referee.
global CH4 cycling. However, in recent years it has become
clear that many biogenic CH4 sources include complex CH4
formation processes, resulting in different isotopic fraction-
ation patterns depending on several biochemical and abiotic References
factors. Thus, studying ecosystems in which more than one
Beckmann, S., Krüger, M., Engelen, B., Gorbushina, A. A., and
major CH4 source has to be expected (e.g. methanogenic Cypionka, H.: Role of bacteria, archaea and fungi involved in
archaea, fungi, cyanobacteria, or plants) becomes increas- methane release in abandoned coal mines, Geomicrobiol. J., 28,
ingly complicated, as distinguishing between each individual 347–358, https://doi.org/10.1080/01490451.2010.503258, 2011.
source based solely on stable carbon isotope values might be Bižić, M., Klintzsch, T., Ionescu, D., Hindiyeh, M. Y., Gün-
highly challenging. Therefore, additional tools are needed to thel, M., Muro-Pastor, A. M., Eckert, W., Urich, T.,
better identify the sources but also to disentangle sources and Keppler, F., and Grossart, H. P.: Aquatic and terrestrial
sinks. In future research, stable hydrogen isotopic values of cyanobacteria produce methane, Sci. Adv., 6, eaax5343,
CH4 (δ 2 H-CH4 values) or even applications of clumped iso- https://doi.org/10.1126/sciadv.aax5343, 2020.
topes might prove to be suitable tools to better distinguish Boros, M. and Keppler, F.: Methane production and bioactivity-
A link to oxido-reductive stress, Front. Physiol., 10, 1244,
between different CH4 sources and, thus, to better constrain
https://doi.org/10.3389/fphys.2019.01244, 2019.
the global CH4 budget.
Bowling, D. R., Pataki, D. E., and Randerson, J. T.: Carbon isotopes
in terrestrial ecosystem pools and CO2 fluxes, New Phytol., 178,
24–40, https://doi.org/10.1111/j.1469-8137.2007.02342.x, 2008.
Data availability. The data used in this study are avail- Brand, W. A. and Coplen, T. B.: Stable isotope deltas: Tiny, yet
able from heiDATA, which is an institutional repos- robust signatures in nature, Isotopes Environ. Health Stud., 48,
itory for research data of the Heidelberg University 393–409, https://doi.org/10.1080/10256016.2012.666977, 2012.
(https://doi.org/10.11588/data/DQYPMC, Schroll et al., 2020). Brownlow, R., Lowry, D., Fisher, R. E., France, J. L., Lanoisellé,
M., White, B., Wooster, M. J., Zhang, T., and Nisbet, E.
G.: Isotopic Ratios of Tropical Methane Emissions by Atmo-
Supplement. The supplement related to this article is available on- spheric Measurement, Global Biogeochem. Cy., 31, 1408–1419,
line at: https://doi.org/10.5194/bg-17-3891-2020-supplement. https://doi.org/10.1002/2017GB005689, 2017.
Dlugokencky, E. J., Nisbet, E. G., Fisher, R., and Lowry, D.: Global
atmospheric methane: Budget, changes and dangers, Philos. T. R.
Author contributions. MS, KL, and FK conceived the study and Soc. A, 369, 2058–2072, https://doi.org/10.1098/rsta.2010.0341,
designed the experiments. HZ provided fungal cultures. MS per- 2011.
formed the experiments under the supervision of FK and KL. CE Ghyczy, M., Torday, C., Kaszaki, J., Szabó, A., Czóbel, M.,
helped with gas measurements. MG measured stable isotope values and Boros, M.: Hypoxia-induced generation of methane in
of greenhouse gases. MS, FK, and KL analysed the data. MS, FK, mitochondria and eukaryotic cells – An alternative approach
HZ, MG, and KL discussed the results, and MS, KL and FK wrote to methanogenesis, Cell. Physiol. Biochem., 21, 251–258,
the paper. https://doi.org/10.1159/000113766, 2008.
Grinhut, T., Hadar, Y., and Chen, Y.: Degradation and trans-
formation of humic substances by saprotrophic fungi: pro-
Competing interests. The authors declare that they have no conflict cesses and mechanisms, Fungal Biol. Rev., 21, 179–189,
of interest. https://doi.org/10.1016/j.fbr.2007.09.003, 2007.
Hein, R., Crutzen, P. J., and Heimann, M.: An inverse mod-
eling approach to investigate the global atmospheric
methane cycle, Global Biogeochem. Cy., 11, 43–76,
https://doi.org/10.1029/96GB03043, 1997.
https://doi.org/10.5194/bg-17-3891-2020 Biogeosciences, 17, 3891–3901, 20203900 M. Schroll et al.: The stable carbon isotope signature Hietala, A. M., Dörsch, P., Kvaalen, H., and Solheim, H.: modeling of source processes, Global Biogeochem. Cy., 18, 1– Carbon dioxide and methane formation in norway spruce 17, https://doi.org/10.1029/2004GB002223, 2004a. stems infected by white-rot fungi, Forests, 6, 3304–3325, Mikaloff Fletcher, S. E., Tans, P. P., Bruhwiler, L. M., https://doi.org/10.3390/f6093304, 2015. Miller, J. B., and Heimann, M.: CH4 sources estimated Keeling, C. D.: The concentration and isotopic abundances of at- from atmospheric observations of CH4 and its 13 C/12 C mospheric carbon dioxide in rural areas, Geochim. Cosmochim. isotopic ratios: 2. Inverse modeling of CH4 fluxes from Ac., 13, 322–334, https://doi.org/10.1016/0016-7037(58)90033- geographical regions, Global Biogeochem. Cy., 18, 1–15, 4, 1958. https://doi.org/10.1029/2004GB002224, 2004b. Keppler, F., Hamilton, J. T. G., Braß, M., and Röck- Mukhin, V. A. and Voronin, P. Y.: Methane emission during mann, T.: Methane emissions from terrestrial plants wood fungal decomposition, Dokl. Biol. Sci., 413, 159–160, under aerobic conditions, Nature, 439, 187–191, https://doi.org/10.1134/S0012496607020202, 2007. https://doi.org/10.1038/nature04420, 2006. Mukhin, V. A. and Voronin, P. Y.: A new source of methane Keppler, F., Boros, M., Frankenberg, C., Lelieveld, J., McLeod, A., in boreal forests, Appl. Biochem. Microbiol., 44, 297–299, Pirttilä, A. M., Röckmann, T., and Schnitzler, J. P.: Methane for- https://doi.org/10.1134/S0003683808030125, 2008. mation in aerobic environments, Environ. Chem., 6, 459–465, Naik, V., Voulgarakis, A., Fiore, A. M., Horowitz, L. W., Lamar- https://doi.org/10.1071/EN09137, 2009. que, J.-F., Lin, M., Prather, M. J., Young, P. J., Bergmann, D., Keppler, F., Schiller, A., Ehehalt, R., Greule, M., Hartmann, J., Cameron-Smith, P. J., Cionni, I., Collins, W. J., Dalsøren, S. B., and Polag, D.: Stable isotope and high precision concentra- Doherty, R., Eyring, V., Faluvegi, G., Folberth, G. A., Josse, B., tion measurements confirm that all humans produce and ex- Lee, Y. H., MacKenzie, I. A., Nagashima, T., van Noije, T. P. C., hale methane, J. Breath Res., 10, https://doi.org/10.1088/1752- Plummer, D. A., Righi, M., Rumbold, S. T., Skeie, R., Shindell, 7155/10/1/016003, 2016. D. T., Stevenson, D. S., Strode, S., Sudo, K., Szopa, S., and Zeng, Kirschke, S., Bousquet, P., Ciais, P., Saunois, M., Canadell, J. G., G.: Preindustrial to present-day changes in tropospheric hydroxyl Dlugokencky, E. J., Bergamaschi, P., Bergmann, D., Blake, D. radical and methane lifetime from the Atmospheric Chemistry R., Bruhwiler, L., Cameron-Smith, P., Castaldi, S., Chevallier, and Climate Model Intercomparison Project (ACCMIP), At- F., Feng, L., Fraser, A., Heimann, M., Hodson, E. L., Houwel- mos. Chem. Phys., 13, 5277–5298, https://doi.org/10.5194/acp- ing, S., Josse, B., Fraser, P. J., Krummel, P. B., Lamarque, J. 13-5277-2013, 2013. F., Langenfelds, R. L., Le Quéré, C., Naik, V., O’doherty, S., Nisbet, E. G., Dlugokencky, E. J., Manning, M. R., Lowry, D., Palmer, P. I., Pison, I., Plummer, D., Poulter, B., Prinn, R. G., Fisher, R. E., France, J. L., Michel, S. E., Miller, J. B., White, J. Rigby, M., Ringeval, B., Santini, M., Schmidt, M., Shindell, D. W. C., Vaughn, B., Bousquet, P., Pyle, J. A., Warwick, N. J., Cain, T., Simpson, I. J., Spahni, R., Steele, L. P., Strode, S. A., Sudo, M., Brownlow, R., Zazzeri, G., Lanoisellé, M., Manning, A. C., K., Szopa, S., Van Der Werf, G. R., Voulgarakis, A., Van Weele, Gloor, E., Worthy, D. E. J., Brunke, E. G., Labuschagne, C., M., Weiss, R. F., Williams, J. E., and Zeng, G.: Three decades Wolff, E. W., and Ganesan, A. L.: Rising atmospheric methane: of global methane sources and sinks, Nat. Geosci., 6, 813–823, 2007–2014 growth and isotopic shift, Global Biogeochem. Cy., https://doi.org/10.1038/ngeo1955, 2013. 30, 1356–1370, https://doi.org/10.1002/2016GB005406, 2016. Klintzsch, T., Langer, G., Nehrke, G., Wieland, A., Lenhart, K., Pataki, D. E., Ehleringer, J. R., Flanagan, L. B., Yakir, D., Bowl- and Keppler, F.: Methane production by three widespread ma- ing, D. R., Still, C. J., Buchmann, N., Kaplan, J. O., and Berry, J. rine phytoplankton species: release rates, precursor compounds, A.: The application and interpretation of Keeling plots in terres- and potential relevance for the environment, Biogeosciences, 16, trial carbon cycle research, Global Biogeochem. Cy., 17, 1022, 4129–4144, https://doi.org/10.5194/bg-16-4129-2019, 2019. https://doi.org/10.1029/2001GB001850, 2003. Kvenvolden, K. A.: A review of the geochemistry of methane Paul, D., Skrzypek, G., and Fórizs, I.: Normalization of mea- in natural gas hydrate, Org. Geochem., 23, 997–1008, sured stable isotopic compositions to isotope reference scales https://doi.org/10.1016/0146-6380(96)00002-2, 1995. – a review, Rapid Commun. Mass Spectrom., 21, 3006–3014, Lenhart, K., Bunge, M., Ratering, S., Neu, T. R., Schüttmann, I., https://doi.org/10.1002/rcm.3185, 2007. Greule, M., Kammann, C., Schnell, S., Müller, C., Zorn, H., and Prather, M. J., Holmes, C. D., and Hsu, J.: Reactive greenhouse Keppler, F.: Evidence for methane production by saprotrophic gas scenarios: Systematic exploration of uncertainties and the fungi, Nat. Commun., 3, https://doi.org/10.1038/ncomms2049, role of atmospheric chemistry, Geophys. Res. Lett., 39, L09803, 2012. https://doi.org/10.1029/2012GL051440, 2012. Lenhart, K., Klintzsch, T., Langer, G., Nehrke, G., Bunge, M., Quay, P., Stutsman, J., Wilbur, D., Snover, A., Dlugokencky, Schnell, S., and Keppler, F.: Evidence for methane production by E., and Brown, T.: The isotopic composition of atmo- the marine algae Emiliania huxleyi, Biogeosciences, 13, 3163– spheric methane, Global Biogeochem. Cy., 13, 445–461, 3174, https://doi.org/10.5194/bg-13-3163-2016, 2016. https://doi.org/10.1029/1998GB900006, 1999. Leonowicz, A., Matuszewska, A., Luterek, J., Ziegenhagen, D., Ralph, J. P. and Catcheside, D. E. A.: Biodegradation by White-Rot Wojtaś-Wasilewska, M., Cho, N. S., Hofrichter, M., and Rogal- Fungi, in: Industrial Applications, Springer Berlin Heidelberg, ski, J.: Biodegradation of lignin by white rot fungi, Fungal Genet. 303–326, 2002. Biol., 27, 175–185, https://doi.org/10.1006/fgbi.1999.1150, Saunois, M., Bousquet, P., Poulter, B., Peregon, A., Ciais, P., 1999. Canadell, J. G., Dlugokencky, E. J., Etiope, G., Bastviken, D., Mikaloff Fletcher, S. E., Tans, P. P., Bruhwiler, L. M., Miller, J. Houweling, S., Janssens-Maenhout, G., Tubiello, F. N., Castaldi, B., and Heimann, M.: CH4 sources estimated from atmospheric S., Jackson, R. B., Alexe, M., Arora, V. K., Beerling, D. J., Berga- observations of CH4 and its 13 C/12 C isotopic ratios: 1. Inverse maschi, P., Blake, D. R., Brailsford, G., Brovkin, V., Bruhwiler, Biogeosciences, 17, 3891–3901, 2020 https://doi.org/10.5194/bg-17-3891-2020
M. Schroll et al.: The stable carbon isotope signature                                                                                    3901

  L., Crevoisier, C., Crill, P., Covey, K., Curry, C., Frankenberg, C.,   Ten Have, R. and Teunissen, P. J. M.: Oxidative mechanisms in-
  Gedney, N., Höglund-Isaksson, L., Ishizawa, M., Ito, A., Joos, F.,        volved in lignin degradation by white-rot fungi, Chem. Rev., 101,
  Kim, H.-S., Kleinen, T., Krummel, P., Lamarque, J.-F., Langen-            3397–3413, https://doi.org/10.1021/cr000115l, 2001.
  felds, R., Locatelli, R., Machida, T., Maksyutov, S., McDonald,         Tyler, S. C.: Stable carbon isotope ratios in atmospheric methane
  K. C., Marshall, J., Melton, J. R., Morino, I., Naik, V., O’Doherty,      and some of its sources, J. Geophys. Res., 91, 13232,
  S., Parmentier, F.-J. W., Patra, P. K., Peng, C., Peng, S., Peters,       https://doi.org/10.1029/jd091id12p13232, 1986.
  G. P., Pison, I., Prigent, C., Prinn, R., Ramonet, M., Riley, W.        Valášková, V. and Baldrian, P.: Degradation of cellulose and
  J., Saito, M., Santini, M., Schroeder, R., Simpson, I. J., Spahni,        hemicelluloses by the brown rot fungus Piptoporus betuli-
  R., Steele, P., Takizawa, A., Thornton, B. F., Tian, H., Tohjima,         nus – Production of extracellular enzymes and characteriza-
  Y., Viovy, N., Voulgarakis, A., van Weele, M., van der Werf, G.           tion of the major cellulases, Microbiology, 152, 3613–3622,
  R., Weiss, R., Wiedinmyer, C., Wilton, D. J., Wiltshire, A., Wor-         https://doi.org/10.1099/mic.0.29149-0, 2006.
  thy, D., Wunch, D., Xu, X., Yoshida, Y., Zhang, B., Zhang, Z.,          Vigano, I., Röckmann, T., Holzinger, R., van Dijk, A., Keppler,
  and Zhu, Q.: The global methane budget 2000–2012, Earth Syst.             F., Greule, M., Brand, W. A., Geilmann, H., and van Weelden,
  Sci. Data, 8, 697–751, https://doi.org/10.5194/essd-8-697-2016,           H.: The stable isotope signature of methane emitted from plant
  2016.                                                                     material under UV irradiation, Atmos. Environ., 43, 5637–5646,
Saunois, M., Stavert, A. R., Poulter, B., Bousquet, P., Canadell, J.        https://doi.org/10.1016/j.atmosenv.2009.07.046, 2009.
  G., Jackson, R. B., Raymond, P. A., Dlugokencky, E. J., Houwel-         Voulgarakis, A., Naik, V., Lamarque, J.-F., Shindell, D. T., Young, P.
  ing, S., Patra, P. K., Ciais, P., Arora, V. K., Bastviken, D., Berga-     J., Prather, M. J., Wild, O., Field, R. D., Bergmann, D., Cameron-
  maschi, P., Blake, D. R., Brailsford, G., Bruhwiler, L., Carl-            Smith, P., Cionni, I., Collins, W. J., Dalsøren, S. B., Doherty,
  son, K. M., Carrol, M., Castaldi, S., Chandra, N., Crevoisier, C.,        R. M., Eyring, V., Faluvegi, G., Folberth, G. A., Horowitz, L.
  Crill, P. M., Covey, K., Curry, C. L., Etiope, G., Frankenberg,           W., Josse, B., MacKenzie, I. A., Nagashima, T., Plummer, D.
  C., Gedney, N., Hegglin, M. I., Höglund-Isaksson, L., Hugelius,           A., Righi, M., Rumbold, S. T., Stevenson, D. S., Strode, S. A.,
  G., Ishizawa, M., Ito, A., Janssens-Maenhout, G., Jensen, K.              Sudo, K., Szopa, S., and Zeng, G.: Analysis of present day and
  M., Joos, F., Kleinen, T., Krummel, P. B., Langenfelds, R. L.,            future OH and methane lifetime in the ACCMIP simulations, At-
  Laruelle, G. G., Liu, L., Machida, T., Maksyutov, S., McDon-              mos. Chem. Phys., 13, 2563–2587, https://doi.org/10.5194/acp-
  ald, K. C., McNorton, J., Miller, P. A., Melton, J. R., Morino,           13-2563-2013, 2013.
  I., Müller, J., Murguia-Flores, F., Naik, V., Niwa, Y., Noce, S.,       Whiticar, M. J.: Stable Isotopes and Global Budgets, in: Atmo-
  O’Doherty, S., Parker, R. J., Peng, C., Peng, S., Peters, G. P.,          spheric Methane: Sources, Sinks, and Role in Global Change,
  Prigent, C., Prinn, R., Ramonet, M., Regnier, P., Riley, W. J.,           Springer Berlin Heidelberg, 138–167, 1993.
  Rosentreter, J. A., Segers, A., Simpson, I. J., Shi, H., Smith, S.      Whiticar, M. J.: Carbon and hydrogen isotope systematics of bacte-
  J., Steele, L. P., Thornton, B. F., Tian, H., Tohjima, Y., Tubiello,      rial formation and oxidation of methane, Chem. Geol., 161, 291–
  F. N., Tsuruta, A., Viovy, N., Voulgarakis, A., Weber, T. S.,             314, https://doi.org/10.1016/S0009-2541(99)00092-3, 1999.
  van Weele, M., van der Werf, G. R., Weiss, R. F., Worthy, D.,           Wishkerman, A., Greiner, S., Ghyczy, M., Boros, M., Rausch, T.,
  Wunch, D., Yin, Y., Yoshida, Y., Zhang, W., Zhang, Z., Zhao,              Lenhart, K., and Keppler, F.: Enhanced formation of methane
  Y., Zheng, B., Zhu, Q., Zhu, Q., and Zhuang, Q.: The Global               in plant cell cultures by inhibition of cytochrome c oxidase,
  Methane Budget 2000–2017, Earth Syst. Sci. Data, 12, 1561–                Plant Cell Environ., 34, 457–464, https://doi.org/10.1111/j.1365-
  1623, https://doi.org/10.5194/essd-12-1561-2020, 2020.                    3040.2010.02255.x, 2011.
Schroll, M., Keppler, F., Greule, M., Eckhardt, C., Zorn,
  H., and Lenhart, K.: The stable carbon isotope signa-
  ture of methane produced by saprotrophic fungi [Dataset],
  https://doi.org/10.11588/data/DQYPMC, 2020.

https://doi.org/10.5194/bg-17-3891-2020                                                            Biogeosciences, 17, 3891–3901, 2020
You can also read