Larval retention, entrainment, and accumulation in the lee of a small headland: Recruitment hot spots along windy coasts
←
→
Page content transcription
If your browser does not render page correctly, please read the page content below
Limnol. Oceanogr., 56(1), 2011, 161–178
E  2011, by the American Society of Limnology and Oceanography, Inc.
doi:10.4319/lo.2011.56.1.0161

Larval retention, entrainment, and accumulation in the lee of a small headland:
Recruitment hot spots along windy coasts
Steven G. Morgan,a,b,* Jennifer L. Fisher,a and John L. Largiera,b
a Bodega     Marine Laboratory, University of California Davis, Bodega Bay, California
b Department    of Environmental Science and Policy, University of California Davis, Davis, California

                Abstract
                   We surveyed crustacean larvae in the plankton in the lee of Bodega Head, California, for 2 months during late
                spring and summer and cross-correlated the larval abundance and stage of development of 16 taxa with 8
                indicators of upwelling–relaxation conditions. Larvae in all stages of development for 11 of these taxa were
                entrained and accumulated in a recirculation feature in Bodega Bay, found in the lee of this small headland as
                soon as upwelling-favorable winds began, and persisted until winds weakened. The remaining taxa were more
                prevalent during relaxation events when the recirculation feature dissipated and a poleward coastal current
                transported larvae into and through the bay. During upwelling conditions, a vertically sheared flow occurs in the
                lee of the headland that accounts for the accumulation of plankton. However, larval behavior did not have a
                substantial effect on density and persistence in the lee of the headland, regardless of whether taxa were more
                prevalent during upwelling or relaxation conditions or whether they developed entirely nearshore or migrated
                offshore later in development. Thus, larvae and postlarvae of many, diverse taxa are concentrated in the plankton
                in the lee of small headlands in upwelling areas, which is consistent with previously reported recruitment hot spots
                in small upwelling bays. These headland-related hot spots increase spatial structure in population density and
                community structure in recruitment-limited upwelling regions and other wind-driven coasts.

   Larval transport is a key determinant of the dynamics                     Largier 2004). Larvae that originate in the lee of capes
and structure of marine populations and communities.                         could be retained there and those originating in other areas
Temporal and spatial variation in upwelling has been                         could be entrained into recirculation features for as long as
proposed to regulate the intensity of settlement and                         equatorward winds persist. When prevailing winds weaken,
postsettlement interactions among invertebrates along the                    larvae are transported poleward around capes, supplying
western margins of continents (Yoshioka 1982; Broitman et                    larvae to recruitment-limited populations along the open
al. 2001; Menge et al. 2004). Strong winds coupled with the                  coast (Wing et al. 1995, 2003; Lundquist et al. 2000).
Coriolis effect drive an offshore flow of waters in the                         Recruitment hot spots also occur in the lee of small
surface boundary layer, known as Ekman transport (Dever                      headlands (Roughan et al. 2005; Mace and Morgan 2006b).
et al. 2006). This offshore transport of larvae may limit the                A recirculation feature forms in the lee of the small
number of recruits to coastal communities and subsequent                     promontory of Bodega Head, California (Roughan et al.
interactions among them in regions of persistent upwelling.                  2005), and more invertebrate larvae are recruited there than
Peak recruitment onshore was proposed to occur infre-                        on the adjacent open coast (Mace and Morgan 2006b). The
quently and episodically when winds weaken (relax) or                        low-lying headland does not entirely block prevailing
reverse, delivering postlarvae (final larval stage before                    winds, so that surface waters still move equatorward, but
settlement) onshore and poleward alongshore (Farrell et al.                  recirculation occurs at depth (Roughan et al. 2005). The
1991; Wing et al. 1995, Connolly et al. 2001). Subsequent                    equatorward flow over the shelf separates from the
studies have shown that most species remain close to shore                   shoreline at the southern end of Bodega Head, forming a
throughout development (Poulin et al. 2002; Morgan et al.                    shear zone that entrains water from the bay (Fig. 1a).
2009a; Shanks and Shearman 2009) and recruit onshore                         Onshore winds and flow at the southern boundary of the
during upwelling conditions (Mace and Morgan 2006a;                          bay form a poleward pressure gradient in the bay
Jacinto and Cruz 2008; Morgan et al. 2009b) or when                          (Roughan et al. 2005). The shear zone and poleward
internal tides are active (Pineda 1994; Shanks 2002, 2006).                  pressure gradient together generate cyclonic (anticlockwise)
Further, spatial and temporal variation in surf zone                         circulation in subsurface waters in the bay (Roughan et al.
hydrodynamics now has been proposed to limit larval                          2005). Thus, upwelled water enters the bay through the
recruitment along upwelling coasts (Bustamante and                           deeper channel in the south and flows northward along the
Branch 1996; Rilov et al. 2008; Shanks et al. 2010).                         eastern side of the bay, potentially transporting larvae from
   Recruitment hot spots occur in otherwise recruitment-                     the outer coast into this recirculation feature (Roughan et
limited regions along upwelling coasts. Recirculation                        al. 2005). In addition, larvae that hatch in the lee of the
features form in the lee of capes during prevailing                          headland could be retained there as long as upwelling-
equatorward currents that are driven by upwelling-favor-                     favorable winds persist. Retention in the recirculation
able winds (Graham and Largier 1997; Wing et al. 1998;                       feature may depend on larvae staying in the lower water
                                                                             column or undertaking diel vertical migrations between
    * Corresponding author: sgmorgan@ucdavis.edu                             surface and bottom currents (Roughan et al. 2005). Larvae
                                                                       161
162 Morgan et al. Fig. 1. Schematic representation of circulation in Bodega Bay deduced from observations of currents and water properties in this study and Roughan et al. (2005). (a) Plan view of circulation, with surface flows represented by solid arrows and circulation at depth represented by dashed arrows; the large block arrow represents wind stress during upwelling; hatching in the northern bay represents wind-driven setdown of the water level, whereas wind-driven setup of water level occurs in the southern bay, which accounts for the northwestward pressure gradient through the bay that drives deeper currents. The dashed line N-S indicates location of section view. (b) Vertical section view of circulation for line N-S down the center of the bay with currents represented by arrows with circles for flow out of the page and crosses for flow into the page; water-level setup and setdown are exaggerated and shown relative to a dotted line representing the still water level. The length of the arrows indicates relative current strength. (c) Location of replicate plankton transects (n 5 3) sampled every other day in the lee of Bodega Head, California from 07 June to 10 August 2005. BML denotes the location of the Bodega Marine Laboratory where salinity was measured, and the squares denote the location of the moored ADCPs. of other species that rise into surface waters may be moderate upwelling years (2001, 2002), when the upwelling transported equatorward and out of the bay, although they index was 155.5 6 9.4 and 150.9 6 10.4 m3 s21 per 100 m of may return onshore later in development (Morgan et al. coastline (Mace and Morgan 2006a). Thus, strong persis- 2009a,c; Morgan and Fisher 2010). tent upwelling produces the mechanism to accumulate Despite these clear patterns of enhanced recruitment in larvae in the lee of small headlands in recruitment-limited the lee of a small headland in an upwelling region, and other wind-driven regions, and recruitment will be understanding of the underlying mechanism requires greater in bays than on the open coast in years of strong plankton studies that can show that larvae are accumulated upwelling. in the headland eddy during active upwelling. Although a The purpose of the present study was to determine previous study did not find that most species were more whether planktonic larvae accumulate in the lee of Bodega concentrated in Bodega Bay than on the adjacent open Head during upwelling events, regardless of whether species coast (Morgan and Fisher 2010), the study was conducted develop entirely nearshore or migrate farther offshore. in a year of below-average upwelling with frequent and Here, we complement our previous spatial comparative prolonged relaxation events (Largier et al. 2006; Morgan et approach (Morgan and Fisher 2010) with concurrent, high- al. 2009b). The upwelling index in 2005 was 115.0 6 10.4 frequency monitoring that resolves upwelling–relaxation SE m3 s21 per 100 m of coastline in an area where it variability, enabling us to determine whether larvae typically ranges between 100 to 200 m3 s21 per 100 m of accumulate in the lee of the headland during upwelling coastline (Morgan et al. 2009b,c). We now report a conditions. Larvae of intertidal and shallow subtidal temporal analysis identifying upwelling events and showing crustaceans were sampled every other day in the lee of greatest larval accumulation in the bay in response to a Bodega Head for 2 months and were identified to species headland eddy during the strongest upwelling events. and developmental stage. Larval abundance should in- Hence during years of strong, persistent upwelling, higher crease in the lee of this small headland as long as upwelling densities are expected in the bay than on the open coast, conditions and the associated headland eddy persist, but which is consistent with observations that postlarvae settled high densities of larvae may extend into relaxation periods more abundantly in the lee of the headland during two depending on how long it takes for the recirculation feature
Larval retention in upwelling                                            163

to dissipate. Larval accumulation in the bay is not expected    Center (NDBC) 46013 (www.ndbc.noaa.gov/station_page.
for species that primarily are delivered to the study area      php?station546013) located 28 km offshore of Bodega
during relaxation events when recirculation in the bay may      Bay. Wind data also were obtained from the Bodega
not occur (Wing et al 1998; Roughan et al. 2005; Kaplan         Marine Laboratory (BML) for comparison (bml.ucdavis.
and Largier 2006). Alternatively, the recirculation feature     edu/boon/wind.html). Along- and cross-shore wind stress
may only retain larvae that are released in the bay or it may   (dynes cm22) were calculated from hourly data and
just detain larvae that are transported into the bay by         adjusted to a height of 10 m above sea level using a neutral
slowing their passage back to the open coast. However,          stability wind profile, and they were rotated in the
neither of these two alternatives would increase larval         alongshore direction to principal axes of 320u and 305u
density in the bay.                                             for NDBC 46013 and BML, respectively (Roughan et al.
                                                                2005). Negative values of alongshore wind stress indicate
Methods                                                         equatorward (upwelling-favorable) wind forcing. Relaxa-
                                                                tion refers to periods of low wind stress and significant
   Study system—Bodega Head is located in one of the            positive values indicate downwelling. Positive cross-shore
windiest regions on the West Coast of North America and         wind stress indicates onshore wind forcing.
is characterized by persistent equatorward winds during the        Daily upwelling indices (m3 s21 per 100 m of coastline)
spring and summer (Dorman et al. 2006; Fig. 1b). Near-          for our region (39uN, 125uW) were obtained from the Paci-
surface waters flow equatorward and offshore over the           fic Fisheries Environmental Laboratory, Pacific Grove,
shelf (Winant et al. 1987; Largier et al. 1993; Dever et al.    California (http://las.pfeg.noaa.gov/las6_5/servlets/dataset?
2006). Shallow depths reduce offshore Ekman transport           catitem51708). These estimates of offshore Ekman transport
and slow alongshore currents over the inner shelf,              are regional-scale aggregates that are calculated from
extending several kilometers from shore (Lentz and              atmospheric pressure data, given that a cross-shore gradient
Chapman 1989; Largier et al. 1993; Dever et al. 2006).          in atmospheric pressure drives geostrophic winds, which in
Equatorward winds blow roughly parallel to the coast, with      turn drive Ekman transport. High positive values indicate
maximum strength in the afternoon and minima at night.          upwelling and offshore transport of surface waters, whereas
Waves generated by these winds are refracted onshore as         low positive values indicate relaxation of upwelling and
they shoal and may be important in transporting larvae          negative values indicate downwelling and onshore Ekman
onshore, especially when upwelling winds are strong and         transport due to poleward wind stress.
persistent (Morgan et al. 2009b). The prevailing northwest-        Vertical profiles of currents, temperature, and salinity
erly winds weaken or reverse about every 4 to 10 d, and         were measured near plankton transects and along the open
flow over the inner shelf reverses within a day or two of       coast. Current velocity was measured continuously using
winds weakening (Send et al. 1987; Largier et al. 1993;         bottom-mounted RDI acoustic Doppler current profilers
Roughan et al. 2006).                                           (ADCP) deployed at 10 m in northeastern Bodega Bay
   Small-scale upwelling in the lee of the headland is active   (1200 kHz) and at 30 m along the open coast off Bodega
where winds blow offshore across the northern shore of the      Head (300 kHz; Fig. 1b). Velocity data were obtained for
bay and surface waters move offshore even more rapidly          1- and 2-m-depth bins and 3- and 10-min ensembles for 10-
than on the open coast (Roughan et al. 2005). Tides are         m and 30-m sites, respectively. Velocity ensembles were
mixed semidiurnal with a tidal range of 1.2 to 2.9 m. The       averaged hourly at both sites and rotated to the alongshore
headland consists of rocky habitat but the bay consists of a    direction of 332.5u inside the bay and 300.4u along the open
mix of sandy beaches (north and south shorelines), rocky        coast, defined by the depth-averaged principal axis.
shore (east shoreline and Bodega Rock), and muddy sand          Positive alongshore flow is poleward (negative equator-
benthic habitats.                                               ward) and positive cross-shore flow is onshore (negative
                                                                offshore). Temperature at 9-m depth was recorded every
   Sampling—A time series of larval densities was generat-      6 min using an Onsett Optic StowAwayH TidbiT thermistor
ed by collecting plankton every other day in oblique            (6 0.2uC) that was attached 1 m above the bottom to a
plankton tows for 2 months in northern Bodega Bay.              mooring placed alongside the ADCP located inside the bay.
Plankton were collected throughout the water column (10–        Lower temperatures indicate the presence of upwelled
15 m) with a sled-mounted 0.5-m-diameter ring net fitted        water in the bay. Open-coast salinity and temperature data
with 335-mm mesh and a flow meter (General Oceanics             from 5-m depth were also available from a Sea-Bird
model 2030) to determine the volume of water sampled            Electronics thermosalinograph (SBE 45 MicroTSG) de-
(mean 45.2 m3 61 SD 18.6m3). Three replicate tows were          ployed in the BML seawater intake line at Bodega Head
collected parallel to the shoreline and approximately           (Fig. 1b). Higher salinities indicate the presence of up-
0.75 km apart (Fig. 1) on alternate days from 07 June to        welled waters, whereas lower salinities indicate the presence
10 August 2005 (n 5 33 cruises). Sampling conditions were       of offshore or Gulf of Farallones waters (Wing et al. 1998;
classified as upwelling 17 times, relaxation 15 times, and      Roughan et al. 2006).
downwelling once, on the basis of covarying current
velocity, wind velocity, temperature, salinity, significant        Species surveyed—All crustacean larvae were identified
wave height, and upwelling indices.                             to species and stage when possible and counts were
   Wind speed, direction, and significant wave height           standardized to number per volume of water sampled
were obtained from the buoy National Data Buoy                  (m23). The mean larval density across sampling dates and
164 Morgan et al.
Table 1. Life history information for species of crustacean larvae that were collected every other day in oblique plankton tows from
07 June to 10 August 2005 (n 5 33 d) in the lee of Bodega Head, including number of larval stages, larval duration, primary location of
larval release, and cross-shelf larval distributions. Larval durations were obtained from field and laboratory studies that were conducted
at water temperatures that most resembled those of our study region. Sheltered habitats refer to bays, estuaries, and harbors vs. the
open coast.
Cross-shelf
Family Taxa No. stages Duration (d) Primary release site distribution*
Cirripedia Balanus crenatus 7 14–21{(E){ Sheltered–exposed Nearshore
Balanus glandula 7 11–141(L) Sheltered–exposed Nearshore
Balanus nubilus 7 na Sheltered–exposed Outer shelf
Chthamalus spp. 7 18–30I(L) Sheltered–exposed Nearshore
Thalassinidea Neotrypaea californiensis 5 42"(F) Sheltered Nearshore
Hippidae Emerita analoga 6 120#F Sheltered–exposed Unknown
Paguroidea Pagurus spp. 5 26–81**(F) Exposed Nearshore
Unidentified Pagurid 5 49–90**(F) Exposed Mid-shelf
Porcellanidae Pachycheles spp. 3 34–40{{(L) Exposed Nearshore
Petrolisthes spp. 3 32–51{{(L) Sheltered–exposed Nearshore
Pinnotheridae Pinnotheridae 6 30–200**(F) Sheltered–exposed Nearshore
Majidae Mimulus foliatus and 3 45–53**(F) Sheltered–exposed Outer shelf
Pugettia richii
Scyra acutifrons and 3 45–53**(F) Sheltered–exposed Outer shelf
Pugettia producta
Grapsidae Hemigrapsus spp. 6 40–70**(F) Sheltered Mid-shelf
Pachygrapsus crassipes 6 74–142**(F) Sheltered–exposed Mid-shelf
Cancridae Cancer antennarius 6 36–4611(L) Sheltered–exposed Mid-shelf
Cancer magister 6 105–125II(F) Sheltered–exposed Outer shelf
Cancer oregonensis 6 105–140**(F) Sheltered–exposed Outer shelf
Cancer productus 6 97""(L) Sheltered–exposed Outer shelf
Xanthidae Lophopanopeus bellus 5 30–100**(F) Sheltered–exposed Outer shelf
* Morgan et al. 2009a.
{ Morris et al. 1980.
1 Brown and Roughgarden 1985.
I Miller et al. 1989.
" McCrow 1972.
# Johnson and Lewis 1942.
** Lough 1974.
{{ MacMillan 1971.
{{ Gonor 1970.
11 Roesijadi 1976.
II Reilly 1983.
"" Trask 1969.
{ E, estimate; L, lab; F, field; na, not applicable.
the mean larval density per sampling trip were calculated ment (Morgan et al. 2009a). Balanus nubilus mid-late-stage
for each species to report their overall abundance during larvae occur over the outer shelf before the postlarvae
the 2-month sampling period. The percentage of the total return to the nearshore to settle. Chthamalus dalli and
number of larvae collected and the percentage of sampling Chthamalus fissus both occur in the study area but could
days that each taxon was present also were calculated to not be distinguished reliably.
reveal their relative abundance and temporal patchiness. The anomuran and brachyuran crabs in this study, and
The barnacles collected in this study (Balanus crenatus, the mud shrimp, Neotrypaea californiensis, spend weeks to
Balanus glandula, Balanus nubilus, Chthamalus spp.) molt months in the plankton, developing through two to five
through six larval stages and a postlarval stage (cyprid), larval stages and a postlarval stage (megalopa) before
spending about 2 to 4 weeks in the plankton (Table 1). returning to the benthos as juveniles (Table 1). Cancrids
Balanus crenatus releases larvae year-round, Chthamalus reside on the inner shelf with some species ranging to the
spp. releases larvae from spring through fall, and B. outer shelf or slope, and they recruit to Bodega Bay year-
glandula releases larvae from winter through spring in our round, peaking in May and June (Morris et al. 1980).
region (Morris et al. 1980; Strathmann 1987). The timing Grapsids, majids, pagurids, porcellanids, and pinnotherids
and duration of the reproductive season of B. nubilus is not peak from May to August (Morris et al. 1980; Mace and
well known. Adult barnacles of all species in this study Morgan 2006a). Adults of most of these species live within
primarily occur in sheltered bays and estuaries on pier protected bays and estuaries as well as along the exposed
pilings and on rocks along the exposed coast (Morris et al. coast, ranging from the intertidal zone (grapsids, pagurids,
1980). With the exception of B. nubilus, the larvae of all porcellanids) to the inner shelf (majids, pinnotherids;
species of barnacles remain nearshore throughout develop- Morris et al. 1980). The mud shrimp, N. californiensis, isLarval retention in upwelling 165
Table 2. Species of crustacean larvae that were collected every other day in oblique plankton tows from 07 June to 10 August 2005
(n 5 33 d) in the lee of Bodega Head, California. The total mean abundance (61 SE) across sampling dates (n 5 three tows) and the mean
(61 SE) per 2-d sampling period are reported as well as the percentage of the total number of larvae collected and the percentage of
sampling days that each taxa was present.
Total mean Mean trip21
Family Taxa (m2361 SE) (m2361 SE) % Total % Time
Cirripedia Balanus crenatus 934.66190.3 29.167.8 14.2 90.9
Balanus glandula 135.8659.5 4.262.7 2.1 81.8
Balanus nubilus 47.8645.6 1.560.9 0.7 48.5
Chthamalus spp. 84.0634.4 2.661.4 1.3 45.5
Thalassinidea Neotrypaea californiensis 31.1610.4 1.060.3 0.5 60.6
Hippidae Emerita analoga 65.566.6 2.060.7 1.0 78.8
Paguroidea Pagurus spp. 66.3624.0 2.061.1 1.0 63.6
Unidentified Pagurid* 0.660.2 0.160.01 ,0.1 12.1
Porcellanidae Pachycheles spp.{ 317.96232.4 9.468.2 5.0 54.5
Petrolisthes spp.{ 20.6612.7 0.660.4 0.3 39.4
Pinnotheridae Pinnotheridae 4726.262434.5 145.0690.5 72.0 93.9
Majidae Mimulus foliatus and Pugettia richii{ 7.062.0 0.260.1 0.1 48.5
Scyra acutifrons and Pugettia 3.060.6 0.160.03 ,0.1 42.4
producta{
Grapsidae Hemigrapsus spp. 63.4619.9 1.960.7 1.0 90.9
Pachygrapsus crassipes 14.864.1 0.460.2 0.2 51.5
Cancridae Cancer antennarius 16.668.7 0.560.2 0.3 45.5
Cancer magister 5.161.9 0.260.1 0.1 21.2
Cancer oregonensis{ 0.360.2 0.0160.01 0.0 15.2
Cancer productus{ 0.760.5 0.0260.01 0.0 15.2
Xanthidae Lophopanopeus bellus 15.463.0 0.560.1 0.2 57.6
* Too few larvae were collected for analysis.
{ Taxa that were combined for analysis.
found in burrows in muddy bays and estuaries, whereas and P. producta, C. oregonensis, and C. productus) for
Emerita analoga resides in sandy beaches in wave-swept presentation after determining that the relative abundance
bays and on the exposed coast (Morris et al. 1980). The over upwelling–relaxation cycles was similar. The final 16
cross-shelf larval distributions vary among taxa (Morgan et taxa were categorized into groups of larval stages to
al. 2009a,c). All larval stages of the mud shrimp, simplify presentation, except for porcellanids and majids
porcellanids, pinnotherids, and Pagurus spp. occur near- that have only three developmental stages. Taxa that have
shore throughout development. The mid-late stages of an four developmental stages (L. bellus and pagurids, and N.
unidentified pagurid, the grapsids, and Cancer antennarius californiensis) were grouped as follows: I, II–III, IV, and
occur over the midshelf, whereas the mid-late stage larvae postlarva and I, II–III, IV–V, respectively. Taxa that have
of the majids, Lophopanopeus bellus, and three other species six developmental stages (E. analoga, pinnotherids, grap-
of cancrids (Cancer magister, Cancer oregonensis, Cancer sids, cancrids) were categorized as follows: I, II–III, IV–V,
productus) occur over the outer shelf. and postlarva. Barnacles have seven stages and were
Not all anomuran and brachyuran crab larvae could be grouped as follows: I–III, IV–V, VI, and postlarva, because
readily identified to species. Consequently, larvae of the the first three larval stages passed through nets and were
two groups of majids were combined into Mimulus foliatus not collected.
and Pugettia richii and Scyra acutifrons and Pugettia
producta. Five species of porcellanid crabs (Petrolisthes Data analysis—Mean densities of larval stages were used
cinctipes, Petrolisthes eriomerus, Petrolisthes manimaculis, to indicate whether larvae of each of these 16 taxa
Pachycheles rudis, Pachycheles pubescens) and three species completed development nearshore or migrated onto the
of hermit crabs (Pagurus samuelis, Pagurus hirsuitisculus, shelf before recruiting onshore as postlarvae. The presence
Pagurus granosimanus) occur in our study region and were of all larval stages indicates that larvae complete develop-
classified by genus. At least six species of pinnotherid crabs ment nearshore, whereas the presence of primarily first-
occur primarily on the inner shelf in our area (Fabia stage larvae and postlarvae indicates that species develop
subquadrata, Scleroplax granulata, Pinnixa tubicola, Pin- offshore and return onshore to settle.
nixa longipes, Pinnixa franciscana, Pinnixa schmitti) and Fluctuations in larval densities relative to upwelling–
were classified by family, because their larvae cannot be relaxation cycles indicated whether larval densities in-
reliably identified using morphological traits. creased in the lee of Bodega Head primarily during
Twenty of the 21 taxa collected were sufficiently prevailing upwelling-favorable winds or during relaxation
abundant for statistical analysis (Table 2). Four of these events. Larval densities were transformed (log10x + 1) to
20 taxa were combined (Petrolisthes spp. and Pachycheles meet assumptions of normality and were cross-correlated
spp., M. foliatus and Pugettia richii and Scyra acutifrons with environmental variables: alongshore wind stress,Table 3. Cross-correlation of larval density of 16 taxa relative to alongshore wind stress, cross-shore wind stress, surface currents measured off Bodega Head and
averaged for the upper 12 m of the water column, current shear measured in northern Bodega Bay, significant wave height, subsurface bay temperature, open-coast salinity, 166
and Bakun upwelling index. Larvae were collected every other day in oblique plankton tows (n 5 33) for 2 months. Taxa were grouped by the prevalence of larval stages,
indicating whether larvae were retained nearshore throughout development or migrated offshore. Larval stages were analyzed separately and combined after determining that
results were similar. Roman numerals indicate the stage of larval development, and PL indicates the postlarval stage. Lags represent the number of days peak densities
occurred following changes in physical variables, and these peaks can last for multiple days. Positive correlations with alongshore wind stress indicate higher larval density
during weaker winds and negative correlations indicate higher denisities during strong equatorward winds (upwelling-favorable). Positive correlations with cross-shore wind
stress indicate high densities during onshore winds. Negative correlations with open-coast surface currents indicate higher larval densities during equatorward winds and
positive correlations indicate higher larval densities during poleward winds. Negative correlations with current shear inside the bay indicate higher larval densities during
increased shear. Positive correlations with wave height indicate higher larval densities during large waves. Positive correlations with temperature indicate high larval densities
at the same time as warmer water (relaxation) and negative correlations indicate an association with colder water (upwelling). Positive correlations with salinity and upwelling
index indicate high larval densities in saline water and during upwelling winds, respectively. Correlations are significant (p , 0.05) unless denoted by ns.
Alongshore wind Cross-shore wind Open-coast Current shear Upwelling index
stress NDBC stress NDBC surface currents inside the bay Bottom (m3 s21 per 100 m
Species or taxa (dynes cm22) (dynes cm22) (m s21) (m s21) Wave height (m) temperature (uC) Salinity of coastline)
Upwelling Day Value Day Value Day Value Day Value Day Value Day Value Day Value Day Value
Balanus crenatus 0 20.434 0 0.470 0 20.378 0 20.402 0 0.488 0 20.541 0 0.569 0 0.320
II–PL 2 20.407 2 0.454 2 20.347 2 20.414 2 20.437 2 0.386
4 20.254 4 0.275
Balanus glandula 0 20.522 0 0.524 0 20.444 0 20.430 0 0.472 0 20.580 0 0.562 0 0.440
IV–PL 2 20.320 2 0.345 2 20.379 2 20.269 2 0.209 2 20.444 2 0.474
4 20.301 4 20.276 4 0.291
Balanus nubilus 0 20.205 0 0.220 0 20.431 0 20.415 0 0.285 0 20.515 0 0.488 ns
PL 2 0.240 2 20.308 2 20.302 2 20.531 2 0.425
4 0.249 4 20.359 4 20.221 4 20.338 4 0.222
Chthamalus spp. ns ns ns ns ns ns 0 0.237 2 0.215
Morgan et al.
II–VI
Neotrypaea ns 2 0.218 0 20.233 0 20.242 4 0.287 2 20.205 0 0.285 4 0.222
californiensis I
Pagurus spp. 0 20.319 0 0.328 0 20.286 0 20.242 0 0.423 0 20.323 0 0.449 0 0.248
I–PL 2 20.276 2 0.306 2 20.279 2 20.336 2 20.399 2 0.447
4 20.392 4 20.275 4 20.225 4 0.319
Pinnotheridae 0 20.308 0 0.278 0 20.488 0 20.396 0 0.409 0 20.278 0 0.446 0 0.516
I–PL 2 20.409 2 20.446 2 20.271
4 20.247
Hemigrapsus spp. 0 20.219 0 0.258 0 20.500 0 20.424 ns 0 20.383 0 0.471 0 0.283
I 2 20.279 2 20.340 2 20.312 2 0.233
Cancer 0 20.396 0 0.419 0 20.452 0 20.377 0 0.220 0 20.407 0 0.425 0 0.222
antennarius I–II 2 20.446 2 0.479 2 20.296 2 20.298 2 0.290 2 0.315
Cancer 0 20.213 0 0.274 0 20.354 ns 0 0.203 0 20.323 0 0.325 2 0.465
oregonensis and 2 20.518 2 0.500 2 0.309
productus I and
PL
Cancer magister I 0 20.191 ns 0 20.467 0 20.481 ns ns 0 0.196 ns
Relaxation
Emerita analoga I 2 0.203 ns 0 20.246 0 20.322 2 20.406 4 0.279 4 20.206 ns
Majidae I 0 0.224 0 20.205 ns ns 0 20.195 0 0.230 ns nsLarval retention in upwelling 167
cross-shore wind stress, open-coast surface currents, bay
(m3 s21 per 100 m
Upwelling index
20.199
20.220
Value
current shear, significant wave height, bay subsurface
of coastline)
temperature, open-coast salinity, and the Bakun upwelling
index. Previous studies in our region have demonstrated
that these environmental variables are cross-correlated and
Day
ns
ns
ns
ns
2
4
perform well as indicators of upwelling, relaxation, and
downwelling conditions. Equatorward wind stress, cold,
saline water, large waves, and a positive upwelling index are
20.272
20.388
Value
associated with upwelling conditions (Lundquist et al.
Salinity
2000; Wing et al. 2003; Morgan et al. 2009b). Because
sampling occurred every second day, lags resulting from
Day
cross-correlation analyses are resolved in 2-d increments
ns
ns
ns
0
4 (Table 3). Cross-correlations for all developmental stages
of a species were similar and were combined and reanalyzed
0.443
0.380
0.254
0.255
0.421
Wave height (m) temperature (uC)
Value
to simplify presentation, except for B. nubilus and Hemi-
grapsus spp. All data were analyzed using the SAS JMP
Bottom
statistical software package.
Day
ns
ns
ns
0
2
4
2
4
Results
20.216
20.259
20.216
20.208
Value
Physical characteristics of the recirculation feature—
Alongshore winds were predominantly equatorward during
the study, with upwelling-favorable winds over 5 m s21
persisting from 08 to 14 June, 01 to 08 July, and 06 to 10
Day
ns
0
2
0
2
August (events 1, 3, and 7 in Fig. 2a). Briefer upwelling-
favorable wind events occurred from 21 to 22 June, 11 to 12
July, 22 to 24 July, and 31 July to 01 August (events 2, 4, 5,
0.368
20.278
0.343
0.251
Value
inside the bay
Current shear
and 6 in Fig. 2a). At other times, winds were light and
(m s21)
variable. Changes in wind conditions over upwelling and
relaxation cycles were reflected in alongshore currents,
Day
which typically flowed equatorward during upwelling
ns
ns
2
0
2
4
conditions and poleward during relaxation events (Fig. 2b).
Cold, saline waters characterized upwelling conditions, and
0.352
0.335
20.332
20.235
0.356
surface currents
Value
temperature rose and salinity fell during prolonged
Open-coast
relaxation events that occurred in late June and again in
(m s21)
late July (Fig. 2c,d).
Currents in the lee of the headland exhibited strong tidal
Day
ns
0
2
0
0
2
and synoptic variability (Fig. 2e,f). During and immedi-
ately after upwelling-favorable winds, strong vertical shear
was observed, with equatorward flow occurring at the
20.271
20.251
Alongshore wind Cross-shore wind
Value
(dynes cm22)
stress NDBC
surface and poleward flow occurring at depth (Fig. 2e).
Between upwelling events, poleward flow usually occurred
at all depths along the northeastern shore of the bay.
Day
However, brief events of equatorward flow occurred at all
ns
ns
ns
ns
2
4
depths and appeared to be unrelated to local winds (28
June, 19 July, 29 July). The development of the surface-
0.213
Value
current response in the bay depended on wind strength;
(dynes cm22)
stress NDBC
rapid development occurred over a couple of days in events
1 and 5, whereas slow development occurred after several
days of weak winds in events 2 and 3. At this 10-m-deep
Day
ns
ns
ns
ns
2
Continued.
location, the depth of flow reversal was about 5 to 7 m
below the surface once it was fully developed, with near-
Hemigrapsus spp.
surface equatorward flows approaching 0.2 m s21 and
Balanus nubilus
Species or taxa
Lophopanopeus
near-bottom poleward flows approaching closer to
Porcellanidae
Pachygrapsus
crassipes I
Upwelling
0.1 m s21. For some events (e.g., event 1), this sheared
and PL
bellus I
IV–VI
Table 3.
II–PL
bay circulation continued for 2 to 3 d after the weakening
I–PL
of upwelling winds. Weak onshore flow occurred during
upwelling events, and weak offshore flow occurred during
relaxation events (Fig. 2f).168 Morgan et al.
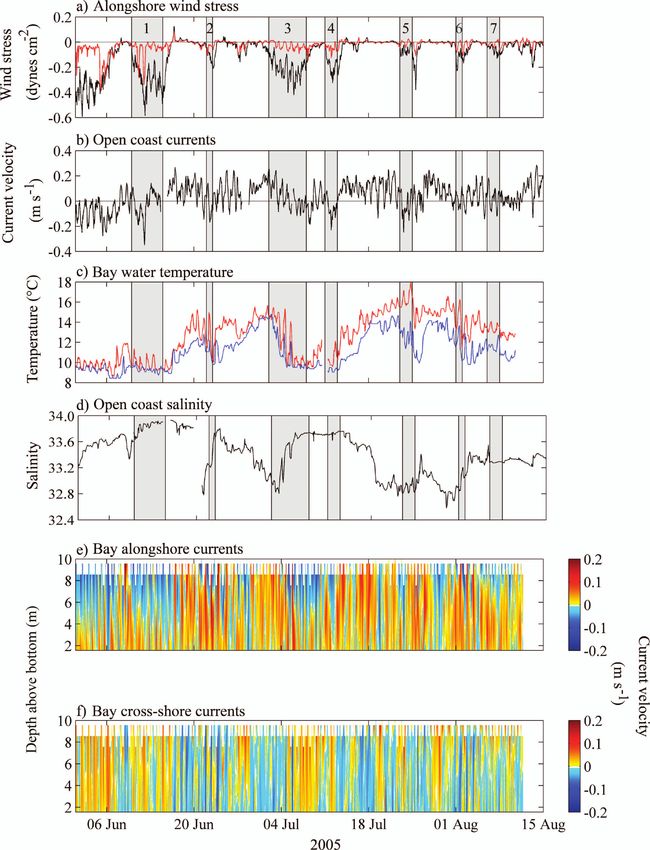
Fig. 2. Time series of (a) wind stress (dynes cm s21) at NDBC 46013 (black) and an onshore
station on Bodega Head (red), (b) average alongshore current velocity (m s21) for the upper 12 m
of the water column measured off Bodega Head, (c) water temperature (uC) at the surface (red)
and bottom (blue) in northern Bodega Bay, (d) salinity measured at Bodega Head, (e) alongshore
and (f) cross-shore current velocity (m s21) measured in northern Bodega Bay from 01 June to 15
August 2005. Positive alongshore wind and current velocities are poleward and positive cross-
shore current velocities are shoreward. Gray shading indicates upwelling conditions (events 1–7),
defined as times when alongshore wind speed exceeded 5 m s21.Larval retention in upwelling 169
Fig. 3. Mean larval density of three taxa of barnacles and five taxa of decapod crustaceans
that were prevalent throughout development in the lee of Bodega Head, California. Roman
numerals represent the stage of larval development, and PL represents the postlarval stage. ND
denotes no data since the barnacle larval stages I–III passed through our nets.
Larval accumulation and retention in the lee of the of Hemigrapsus spp. between early and later stages suggests
headland—Three of the 20 taxa of crustacean larvae that more of these larvae may have been transported away
collected during the 2-month study composed the vast from the study area. Later larval stages did not occur more
majority (91.4%) of all larvae collected (Table 2). The six abundantly for any of these eight taxa, indicating that there
species of pinnotherids composed 72.0% of larvae with a was not an influx of these stages from outlying areas. All
mean of 145 m23 (6 90 SE) per trip followed by B. crenatus larval stages of these taxa also were common close to shore
(14.2%) and Pachycheles spp. (5.0%). Five taxa were in cross-shelf surveys, although late larval stages of
frequently present (. 75% of sampling days) and half the Hemigrapsus spp. and majids also occurred on the mid-
taxa were present more than 50% of the time. An to outer shelf, respectively (Table 1).
unidentified pagurid was the rarest taxon (occurring Larvae of seven taxa were abundant in the lee of
12.1% of the time) and was not analyzed statistically. Bodega Head as early-stage larvae and later stages were
We collected the same number of taxa in the lee of the absent or uncommon (Fig. 4). Larvae of E. analoga, N.
headland that develop nearshore as offshore, indicating californiensis, Pachygrapsus crassipes, L. bellus, and three
that vertical distributions regulating cross-shelf transport taxa of cancrids likely migrated offshore or were advected
do not affect entrainment into the lee of the headland. alongshore away from the study area after hatching.
Differences in the relative abundance of larval stages in the Larval stages of B. nubilus were uncommon and postlarvae
lee of Bodega Head indicated that 8 of 16 taxa were were very abundant, suggesting that most larvae migrated
released nearshore and remained throughout development farther from shore than the other species of barnacles
in the lee of Bodega Head (Fig. 3). Although the first three before recruiting onshore as postlarvae (Fig. 4). Crab
larval stages of barnacles passed through our nets, later postlarvae were uncommon presumably because their
stages of three of the four barnacle taxa (B. crenatus, B. faster swimming speeds enabled them to better avoid nets
glandula, Chthamalus spp.) occurred in high densities. All than larvae in the daytime (Chia et al. 1984). A concurrent
larval stages of pinnotherids, Pagurus spp., porcellanids, study revealed that postlarvae of all five species of the
and majids were abundant as early-stage larvae and crabs recruited to passive collectors that were moored in
steadily declined during development. The steeper decrease the lee of the headland (Morgan et al. 2009b). Later170 Morgan et al.
Fig. 4. Mean larval density of eight taxa that were prevalent only as early-stage larvae or
postlarvae in the lee of Bodega Head, California. Roman numerals represent the stage of larval
development, and PL represents the postlarval stage. ND denotes no data since the barnacle
larval stages I–III passed through our nets.
developmental stages of all of these taxa also occurred during the upwelling event in the beginning of July when
from the mid- to outer shelf in the cross-shelf surveys, water temperatures remained cold for a week (Chthamalus
except for N. californiensis, which was prevalent through- spp., B. crenatus, B. glandula, B. nubilus, Hemigrapsus spp.,
out development nearshore (Table 1). Overall, the cross- Cancer antennarius, C. oregonensis, and C. productus).
shelf transport patterns inferred from the relative abun- Larvae of the 11 taxa are released in exposed and sheltered
dance of larval stages for the 16 taxa were consistent with habitats (Table 1) and likely originated from the adjacent
those found during cross-shelf larval surveys (Table 1), open coast or Bodega Bay and Bodega Harbor. Larvae
and interspecific differences in depth preferences of larvae from the open coast would have been entrained into the
did not appear to affect entrainment into the lee of the bay by the recirculation feature as currents flowed
headland. equatorward past the Bodega headland. Larvae from
Bodega Harbor (and perhaps Tomales Bay) would have
Timing and duration of larval entrainment and retention— been flushed by ebb tides into the adjacent bay where they
Larvae were entrained during prevailing upwelling condi- can be retained by recirculation, whereas larvae released in
tions, suggesting they were entrained by recirculation in the the bay would also be retained by this feature.
lee of the headland (Table 3; Figs. 5, 6). Larvae of 11 of 16 Nine of the 11 taxa, consisting of 79% of all larvae
taxa were most prevalent at the onset of upwelling collected, were well correlated with upwelling conditions,
conditions or shortly thereafter, regardless of whether including B. crenatus, B. glandula, B. nubilus postlarvae, N.
larvae completed development nearshore or migrated californiensis, Pagurus spp., pinnotherids, first-stage Hemi-
offshore. Larvae of all 11 taxa were prevalent in the lee grapsus spp., C. antennarius, and C. productus, and C.
of the headland only as long as upwelling-favorable winds oregonensis (Table 3; Figs. 5, 6). They were correlated with
persisted and were largely absent during prolonged at least seven of the eight physical variables with high
relaxation periods in mid-June and mid-July. Larval densities beginning at the onset of equatorward and
abundance of 9 of the 11 taxa peaked during the strongest onshore wind stress, equatorward surface currents along
upwelling event of the sampling season in early June (all the open coast, increased current shear inside the bay,
except Chthamalus spp., Cancer oregonensis, and C. increased wave height, cold, saline water, and upwelling,
productus). Six of the 11 taxa also increased in abundance and persisting for as long as 4 d. Two taxa were cross-Larval retention in upwelling 171
Fig. 5. Four taxa of barnacle larvae (four lower panels) that were cross-correlated with
upwelling conditions. Mean larval density (black bars) is shown relative to alongshore (a) current
speed along the open coast for the upper 12 m of the water column (solid line), and current shear
in northern Bodega Bay (triangles); (b) bottom temperature (solid line), and salinity (triangles).
Oblique plankton tows were taken every other day in the lee of Bodega Head, California from 07
June to 10 August 2005. Gray shading indicates upwelling conditions, defined as times when
alongshore wind speed exceeded 5 m s21.
correlated with only two and four of the eight physical coastal boundary current. Larvae of 5 of the 16 taxa (E.
variables: Chthamalus spp. and Cancer magister. High analoga, early stage majids, later stages of Hemigrapsus
salinity was the best indicator, with all 11 taxa being cross- spp., Pachygrapsus crassipes, L. bellus) were most prevalent
correlated with this variable, followed by nine taxa being at the onset of relaxation conditions or shortly thereafter.
cross-correlated with along- and cross-shore wind stress, Larval abundance of four of these five taxa peaked or
open-coast surface currents, bay current shear, tempera- increased over a 2-d period during the prolonged relaxation
ture, and the upwelling index, and eight taxa being cross- event in mid-June and was uncommon before this event (all
correlated with wave height. Cross-correlations were based except P. crassipes), suggesting that larvae did not originate
on all larval stages for five of the taxa (B. crenatus, B. in the immediate vicinity of Bodega Head. Two of these
glandula, Chthamalus spp., Pagurus spp., pinnotherids), taxa peaked again during the relaxation event in mid-July
whereas they primarily depended on first-stage larvae or (E. analoga, Hemigrapsus spp.). Pachygrapsus crassipes
postlarvae for six taxa (B. nubilus, N. californiensis, larvae increased in abundance before the onset of upwelling
Hemigrapsus spp., Cancer antennarius, C. productus, and in the beginning of the study and peaked during the
C. oregonensis, C. magister). relaxation event mid-July. Larvae of all five taxa remained
Peak abundance of the five remaining taxa occurred in low numbers throughout the study period after their
during relaxation events (Table 3; Fig. 7), indicating that initial influx into the lee of the headland regardless of
larvae were delivered to the study area by the poleward oceanographic conditions, except later stages of Hemi-172 Morgan et al.
Fig. 6. Seven taxa of decapod crustaceans (seven lower panels) that were cross-correlated
with upwelling conditions. Mean larval density (black bars) is shown relative to alongshore (a)
current speed along the open coast for the upper 12 m of the water column (solid line), and
current shear in northern Bodega Bay (triangles), (b) bottom temperature (solid line), and salinity
(triangles). Oblique plankton tows were taken every other day in the lee of Bodega Head,
California from 07 June to 10 August 2005. Gray shading indicates upwelling conditions, defined
as times when alongshore wind speed exceeded 5 m s21.Larval retention in upwelling 173 Fig. 7. Five taxa of crustaceans that were cross-correlated with relaxation conditions and two taxa that were not related to upwelling–relaxation cycles (seven lower panels). Mean larval density (black bars) is shown relative to alongshore (a) current speed along the open coast for the upper 12 m of the water column (solid line), and current shear in northern Bodega Bay (triangles), (b) bottom temperature (solid line), and salinity (triangles). Oblique plankton tows were taken every other day in the lee of Bodega Head, California from 07 June to 10 August 2005. Gray shading indicates upwelling conditions, defined as times when alongshore wind speed exceeded 5 m s21.
174                                                      Morgan et al.

grapsus spp. only occurred during the prolonged relaxation        Discussion
events in mid-June and mid-July.
   Larvae of these five taxa generally were not as well              Data on time-varying densities of planktonic larvae in
correlated with physical variables as the 11 taxa that were       Bodega Bay showed clear associations with upwelling and
prevalent during upwelling conditions (Table 3, Fig. 7).          relaxation cycles, and peaks in larval abundance occurred as
Furthermore, fewer of these taxa were prevalent at the            specific events. To better understand these events, one can
onset of relaxation conditions than were the taxa that were       identify a variety of transport mechanisms that may be
prevalent at the onset of upwelling conditions. Later stages      responsible for larval import to or retention in the bay.
of Hemigrapsus spp. and majid larvae were cross-correlated        These processes are associated with either the recirculation
with seven or four of the eight physical variables indicating     feature, which was present in the lower water column during
relaxation conditions, respectively, beginning at the onset       upwelling conditions this year as it was during the previous
of relaxation conditions. However, three other taxa were          year (Roughan et al. 2005), or the poleward current, which is
prevalent beginning 2 to 4 d after the onset of relaxation        observed over the inner shelf and in the bay during
conditions and were cross-correlated with four (E. ana-           relaxation periods (Send et al. 1987; Largier et al. 1993;
loga), three (L. bellus), or two (P. crassipes) physical          Roughan et al. 2005). A simple model demonstrated that
variables indicating relaxation conditions. Small waves           larvae could be retained in the circulation feature either by
were the best indicator, with all five taxa being cross-          remaining in the lower water column or by undertaking diel
correlated with wave height, followed by four taxa being          vertical migrations (Roughan et al. 2005), and field studies
cross-correlated with warm temperature, three taxa being          showed that high larval densities are associated with the
cross-correlated with poleward wind stress and low salinity,      waters that flow poleward along this coast during relaxation
two taxa being cross-correlated with offshore wind stress,        (Wing et al. 1998; Papastephanou et al. 2006).
and one taxon being cross-correlated with weak upwelling.            As described by Roughan et al. (2005), near-surface
Cross-correlations were based primarily on first-stage            waters in the bay moved south and out of the bay, whereas
larvae for four taxa (E. analoga, majids, P. crassipes, L.        subsurface waters moved onshore in the southern bay and
bellus) and later stages for Hemigrapsus spp. The two taxa        then northward through the bay. Subsurface waters either
(majids, later stages of Hemigrapsus spp.) peaking at the         upwelled at the north shore and leaked offshore across the
onset of relaxation conditions likely originated nearby from      northern mouth of the bay or recirculated southward along
the south bay, Tomales Bay, or the open coast off Tomales         the western margin of the bay. Thus, larvae may
Point. In contrast, the three taxa (E. analoga, P. crassipes,     accumulate in the bay during upwelling conditions under
L. bellus) peaking 2 to 4 d after the onset of relaxation         the following circumstances: (1) Larvae that remain in the
likely came from a more distant source. All of these taxa         lower water column will accumulate where waters upwell,
develop along the open coast and likely were transported          leading to a convergent larval flux in the northern bay; (2)
from the pool of larvae developing in the coastal boundary        larvae that move vertically between the surface and lower
layer off Point Reyes or even to the south of it, given that it   water column, either through active migrations or passive
takes several days after the onset of relaxation for crab         mixing, will experience weak net transport and may remain
postlarvae from the lee of Point Reyes to be transported to       in the bay for several days (Roughan et al 2005); and (3)
Bodega Head by poleward currents (Wing et al. 1995).              larvae that undertake tidal or diel migrations in association
   Two more taxa appeared to occur in the lee of the              with periodically fluctuating currents will accumulate more
headland primarily during relaxation conditions but were          strongly than in the second scenario if they typically occur
not well correlated with physical variables (Table 3, Fig. 7).    near-surface during times of weaker southward flow, as
Porcellanids occurred during two relaxation events; a very        occurs at night. Larvae that remain very near the surface
large pulse occurred during one day in mid-July with most         will neither be entrained nor retained in the bay. However,
of the rest of them occurring in late June and they were          under strong wind conditions, it is only the strongest
cross-correlated with poleward surface currents along the         swimmers or most buoyant larvae that would be capable of
open coast and reduced current shear inside the bay.              resisting the energetic vertical mixing at these times.
Porcellanid larvae complete development in high densities            During relaxation, the nearshore poleward current
nearshore both north and south of Bodega Head (Morgan             forming close to the coast (Send et al. 1987; Largier et al.
et al. 2009c), where they could be entrained into the             1993; Kaplan et al. 2005) is driven by a combination of
recirculation feature during upwelling or transported to the      barotropic and baroclinic pressure gradients (Pringle and
lee of the headland by a poleward current during relaxation       Dever 2009). During the first couple of days of relaxation,
(Send et al. 1987; Wing et al. 1995). Porcellanid postlarvae      nearshore waters from north of Point Reyes are transport-
previously have been found to recruit to the lee of Bodega        ed into the bay, followed by the arrival of a front and the
Head during both upwelling and relaxation events over a 5-        subsequent arrival of warmer, low-salinity waters from
yr period (Morgan et al. 2009b). The few late-stage larvae        south of Point Reyes (Largier et al. 2006). During
of B. nubilus collected occurred during the relaxation event      relaxation conditions, larvae may be delivered to the bay
in late June, with an even smaller number occurring during        in high or low densities under the following circumstances:
upwelling in early July. Late-stage B. nubilus larvae were        (1) Larvae that occur nearshore along the northern shore of
cross-correlated only with small waves. These larvae were         Point Reyes during upwelling conditions (Morgan et al.
uncommon because they primarily develop farther from              2009c) will be delivered to the bay during the first couple of
shore (Table 1).                                                  days of relaxation; (2) larvae that accumulate at a front by
Larval retention in upwelling                                               175

swimming upward (Shanks and Eckert 2005) will be delivered         flow in the bay. Nine sampling dates have larval densities
to the bay in high densities as the front of the low-salinity      that were an order of magnitude higher than at other times.
waters propagates through the bay; (3) larvae that occupy          Such anomalously high densities indicate that larvae
low-salinity, warm near-surface waters south of Point Reyes        accumulated by a specific convergence mechanism, such
during upwelling conditions (Wing et al. 1998) will be             as a front or the vertically sheared flow observed in the bay.
delivered to the bay 2 to 3 d after the start of relaxation; and   Seven of these nine peaks occurred during peak upwelling
(4) larvae that reside nearshore in the lower water column         conditions on 11 June and 10 August (B. glandula, B.
under calm stratified conditions during relaxation will be         nubilus, Pagurus spp., Pinnotheridae, first-stage Hemigrap-
delivered rapidly to the bay in high densities at the end of the   sus spp., and C. antennarius). The two other anomalous
relaxation event as upwelling resumes.                             peaks appeared to be associated with the arrival of the
   High larval densities of 11 of 16 taxa occurred during          salinity front in the bay on 27 June and 17 July (E. analoga,
strong, persistent upwelling events (1, 3, 7; Figs. 6, 7) that     later stages of Hemigrapsus spp.). Although frontal
are consistent with upwelling-related bay circulation, as          aggregations are common in the bay and open coast in
described above. Larvae accumulated despite differences            this region, the aggregation of larvae in a small bay during
with upwelling-related circulation that entrain larvae and         upwelling has not been shown previously.
other zooplankton in the lee of larger capes (Graham et al.           Mortality likely was responsible for the steady declines
1992; Graham and Largier 1997; Lagos et al. 2005). Five            during development for species that were retained over the
other taxa exhibited maxima during relaxation events that          inner shelf. Larval mortality was estimated to be low during
were associated with the arrival of low-salinity warm waters       the study (White et al. unpubl.), which is consistent with the
in mid-July. However, we found little evidence that behavior       observed steady declines in larvae throughout development.
enhanced retention in the recirculation feature in the lee of      In contrast, larvae of one taxon (Hemigrapsus spp.) showed
Bodega Head more than it does on the open coast. Species           a much steeper decline during development that was greater
that complete development nearshore avoid the shallow              than expected by mortality alone, indicating that more of
Ekman layer or ascend to the surface only at night when            these larvae were transported away from the study area. The
winds subside, whereas those that migrate offshore com-            remaining species were present almost entirely as larvae and
monly reside in the Ekman layer where they are advected            postlarvae, clearly indicating that larvae developed offshore
offshore (Peterson et al. 1979; Batchelder et al. 2002;            and returned to settle in adult habitats.
Morgan et al. 2009a). These interspecific differences in              The accumulation of planktonic larvae in a bay resulting
vertical distributions did not appear to affect whether larvae     in a small-scale recruitment hot spot is due to recirculation
at some stage in development were entrained into the lee of        in the lee of the bay headland (headland eddy) and is likely
the headland or how long they persisted there. Larvae              to be a common feature in upwelling systems and other
released nearshore were entrained into the lee of the small        wind-driven regions. Although previous studies have
headland and remained there briefly, regardless of whether         shown correlations between recruitment and winds in
they were prevalent close to shore throughout development,         upwelling areas (Farrell et al. 1991; Wing et al. 1995) and
only prevalent as early-stage larvae, or were returning to         elsewhere (Archambault and Bourget 1999; Jenkins and
settle as postlarvae. Whether larvae are entrained into the        Hawkins 2003), this study identified a specific mechanism
recirculation feature appears to depend only on their              due to the interaction of wind-driven alongshore flow with
presence nearshore in the vicinity of the headland during          a topographic feature and the subsequent interaction of a
upwelling, and larval residence time in the bay depends only       headland eddy and surface wind stress in the bay. Further,
on the duration of the upwelling event. However, given that        most prior work reported the wind-correlated temporal
the strength and persistence of the larval flux convergence        variability in recruitment, whereas we showed that a
associated with the headland eddy depends on upwelling             distinct spatial pattern is expected on the basis of the effect
strength and persistence, more larvae will be entrained and        of coastline topography on plankton distributions, further
denser concentrations will accumulate during stronger and          supporting the argument that the time dependence of
longer upwelling events, which are more common in typical          recruitment is largely driven by temporal variability in
strong upwelling years. Larvae of the remaining five taxa          transport. Previous studies of topographic eddies include
were delivered to the study area during relaxation events          island wake effects (Wolanski and Hamner 1988) and larger
when the recirculation feature dissipated (Roughan et al.          headland recirculation features (Penven et al. 2000). In
2005; Kaplan and Largier 2006), but there was no evidence          general, small-scale headlands in upwelling regions have
of accumulation in the lee of the headland at these times.         been neglected on the basis of the expectation that surface
   Taking an event-based approach to analyzing larval              wind stress rapidly flushes small bays and precludes the
densities, 24 peaks occurred for the 18 taxa during the            stratification that is typically associated with vertically
study period (Figs. 5–7). Eight of these peaks occurred on         sheared flow and the potential for retention and accumu-
11 June, which was the strongest upwelling event observed.         lation (as in upwelling shadows, Graham and Largier 1997;
Five more peaks were observed while flow was sheared in            Marin et al. 2001; Pinones et al. 2007). We showed that
the bay: three persisted between upwelling events 3 and 4,         larvae do accumulate in smaller bays in upwelling regions,
and two occurred on 10 August. Thus, more than half the            despite strong surface wind stress and the absence of
peaks in larval density among the 18 taxa occurred during          stratification. Indeed, it is the wind stress combined with
the strongest upwelling events, and all of these peaks             the flow reversal due to the headland eddy that produces
coincided with times of well-developed vertically sheared          the vertical circulation and thus the accumulation mecha-
You can also read