Curse or Blessing? Obesity and Income-Related Inequality in the Chinese Labor Force - Frontiers
←
→
Page content transcription
If your browser does not render page correctly, please read the page content below
BRIEF RESEARCH REPORT
                                                                                                                                         published: 26 February 2021
                                                                                                                                    doi: 10.3389/fpubh.2021.606634

                                              Curse or Blessing? Obesity and
                                              Income-Related Inequality in the
                                              Chinese Labor Force
                                              Chengxiang Tang 1† , Xiaocong Yang 1*† , Fei Peng 2 and Xianglian Hu 3
                                              1
                                               Department of Government Administration, School of Public Administration, Guangzhou University, Guangzhou, China,
                                              2
                                               Department of Economics, School of International Economics and Trade, Shanghai Lixin University of Accounting and
                                              Finance, Shanghai, China, 3 Center for Chinese Public Administration Research, School of Government, Sun Yat-sen
                                              University, Guangzhou, China

                                              China owns a huge labor force of around half billion workers in 2018. However, little
                                              is known about the prevalence of obesity and the association between obesity and
                                              economic status in this special population. By employing the concentration index
                                              (CI) and decomposition analysis, this paper addresses this knowledge gap by using
                                              the most recent nationally representative dataset. In specific, this study examines the
                                              prevalence of obesity and the socioeconomic gradient in the probability of obesity among
                                              Chinese workers between 16 and 65. Our results show that the prevalence of obesity is
                            Edited by:        completely different by using a different measure: the overall prevalence of being general
                    Hideki Hashimoto,
        The University of Tokyo, Japan        obesity (measured by body mass index, BMI ≥ 28) varies by gender and residency from
                        Reviewed by:          a minimum of 5.88% to a maximum of 9.46%, whereas abdominal obesity (measured
                    Mariela Deliverska,       by waist circumference, WCmale ≥ 85 cm & WCfemale ≥ 80 cm) prevalence presents a
     Medical University Sofia, Bulgaria
                   Habib Nawaz Khan,
                                              socking level from 64.53% to 67.69%. Moreover, the results show a pro-rich distribution
 University of Science and Technology         of obesity (general and abdominal) among male workers (CIBMI = 0.112; CIWC = 0.057)
                      Bannu, Pakistan         and a pro-poor distribution among female workers (CIBMI = −0.141; CIWC = −0.166). We
                   *Correspondence:           also find that the direction of the contribution of socioeconomic factors to income-related
                       Xiaocong Yang
                  xxy980@hotmail.com          inequalities in obesity differs by gender. These results have substantial implications for the
   † These
                                              measurement of socioeconomic inequality in adiposity and for improving health-related
             authors contributed equally
              and share first authorship      policies targeting the Chinese labor force.
                                              Keywords: obesity, income-related, inequality, Chinese, labor force
                    Specialty section:
          This article was submitted to
                     Health Economics,
                a section of the journal
                                              INTRODUCTION
              Frontiers in Public Health
                                              Obesity is the most common consequence of overnutrition and has long-term negative health
       Received: 15 September 2020            consequences. An increased prevalence of obesity is linked to health risks for numerous
        Accepted: 08 February 2021
                                              non-communicable diseases (NCDs), including cardiovascular diseases, diabetes, and some cancers
        Published: 26 February 2021
                                              (1–4). For instance, increased body mass index (BMI) is associated with an increased risk of
                              Citation:
                                              malignancies caused by alterations in metabolism, insulin levels, and insulin-like growth factors
     Tang C, Yang X, Peng F and Hu X
    (2021) Curse or Blessing? Obesity
                                              (5). In many developed countries, obesity is a major public health concern and increases the
  and Income-Related Inequality in the        public health burden of NCDs as well as economic costs. According to estimates, the annual
                 Chinese Labor Force.         medical economic costs of obesity in the United States were over US$140 billion in 2008, and if
        Front. Public Health 9:606634.        the prevalence of obesity can be held at 2010 levels, almost US$550 billion in medical costs would
     doi: 10.3389/fpubh.2021.606634           be saved by 2030 (4, 6, 7).

Frontiers in Public Health | www.frontiersin.org                                   1                                        February 2021 | Volume 9 | Article 606634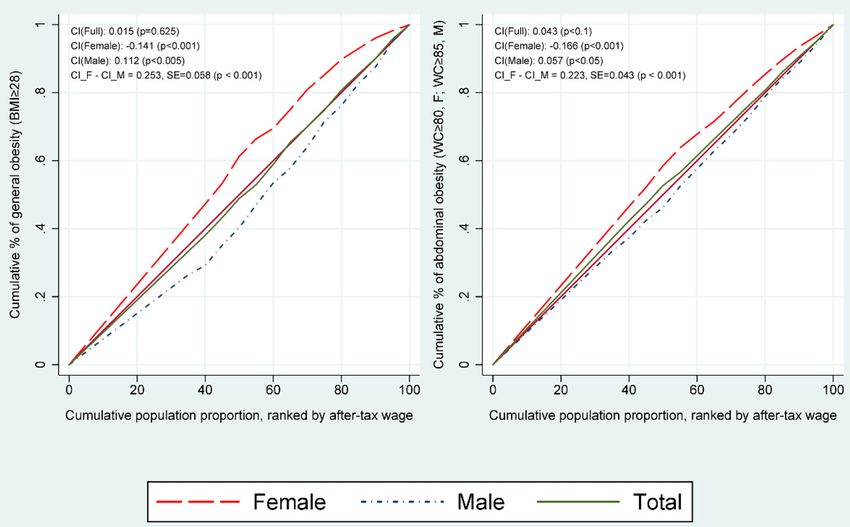
Tang et al.                                                                                                    Obesity and Income-Related Inequality

    The Chinese population has a long history of undernutrition                In China, a few studies have investigated these gradients and
resulting in poor physical and mental health development as                the determinants of inequality in BMI-related variables. Using
well as behavioral abnormalities. Over the last three decades,             a biased sample, Tafreschi reported that the income-bodyweight
the Chinese economy has experienced a long period of growth                gradient changes that have occurred in China from 1991 to 2009
accompanied by a profound transition in the population’s                   are in line with the reversal hypothesis, which states that in poor
lifestyles, wealth, and dietary habits. A wider variety of foods           or developing societies, obese people tend to be relatively wealthy,
and drinks have become available in the Chinese market, thus               whereas in more developed societies, the obese are relatively poor
increasing rates of consumption of fat-rich and energy-dense               (24). In contrast, our study focuses on a specific population of the
foods and sweetened carbonated beverages (8). Over the same                workforce using a representative sample, which is an incremental
period, rapid urbanization and motorization have contributed               contribution. Although previous study results may only reflect
to decreased rates of physical activity during work and leisure            a conditional relationship rather than a causal one, they are
activities (9, 10). Together, these factors have led to a widespread       meaningful concerning the evolution of socioeconomic health
imbalance between energy intake and energy expenditure that                inequalities in China. This is because the shift in higher obesity
has changed the Chinese body weight and composition of                     rates to lower-income individuals may increase the health burden
nutrition. Consequently, being overweight and obese is becoming            on poor people, thus worsening health inequalities. Another
increasingly common in both rural and urban areas. The most                study, using the same dataset, demonstrated that SES is positively
famous longitudinal study on the Chinese population, the China             related to male BMI and concluded that the relationship between
Health and Nutrition Survey (CHNS), demonstrated that the                  SES and obesity is complicated in China (25). Thus, this paper
population’s mean BMI has increased over recent decades (11).              fills the gap existing in the literature regarding Chinese workers’
Specifically, the rates of being overweight and of obesity in              rates of being overweight, especially in association with their SES.
Chinese adults were 30.6 and 12.0%, respectively, in 2010 (12).                The paper proceeds as follows: the next section introduces
    However, a knowledge gap still exists in the related literature        our data, materials, and methods to provide an overview of the
as limited information is available concerning overweight and              employed dataset and a discussion of variables and methodology
obese workers in China. Our study contributes to the existing              used in this study. Section three sets out the key results and
literature in two dimensions. The first contribution of our study          findings and the final section presents a discussion, outlines the
is that we applied the most recently available dataset to examine          policy implications of the results, and offers concluding points.
the prevalence of obesity among Chinese workers. To the best of
our knowledge, it is the first time to explore the prevalence of           METHODS
both general obesity and abdominal obesity in Chinese workers
by using BMI and waist circumference (WC) measures. The                    Data
majority of studies on obesity have focused on children and the            This study employed the third wave (2016) of the China Labor-
general adult population (4, 13–18). Limited empirical evidence            force Dynamics Survey (CLDS), a nationally representative
exists on obesity among the labor force, especially in China,              dataset launched by Sun Yat-Sen University in 2012, which
which has the largest labor market in the world (19). The existing         was the first national longitudinal survey targeted at the
literature has documented that obesity negatively affects the              Chinese labor force. It offers longitudinal social survey data
labor market through two mechanisms. First, the poor health                with rotating panel design, is conducted every 2 years, and
conditions caused by being overweight and by obesity increased             has to date accumulated three waves of data. This dataset
rates of absenteeism and presenteeism and, thus, lower the                 implements a probability-proportional-to-size sampling strategy.
productivity of the labor force (20, 21). Second, workers with             The population size, administrative units, and SES, which
higher BMI or perceived overweight-related problems may also               was provided by the local Bureau of Statistics, were used as
be discriminated against by employers, consequently leading to             the main stratification variables. The first wave of the CLDS
the misallocation of human resources and decreases in workplace            covered 29 provinces/cities/autonomous regions (excluding
productivity (22, 23).                                                     Hong Kong, Macao, Taiwan, Tibet Autonomous Region, and
    Second, this study provides a useful snapshot of the                   Hainan Province) with a total number of 16,253 observations.
determinants of socioeconomic gradients in overweight and                  The next two follow-up waves surveyed the same respondents,
obesity inequalities. In addition to the prevalence of obesity,            plus additional respondents, to provide 23,594 and 21,086
we also analyzed socioeconomic gradients by decomposing                    observations, respectively. The dataset of the third wave provides
inequalities in obesity. The factors and processes that                    both demographic and socioeconomic information, including
affect obesity are multiple and complex, so researchers and                measures of employment status, income, household assets, and
policymakers must often understand both the level of the                   health outcomes. Of particular relevance for this research is
problem and its determinants. A major concern in developed                 that the CLDS not only uses objective health measurements to
countries is related to the formulation of targeted and effective          generate the key independent variables (e.g., BMI and WC) but
health policies that mitigate the disproportionate effects of              also uses the employment status as well as the individual after-tax
adiposity on people with low incomes or socioeconomic status               wage from all sources.
(SES). The rapid growth of the economy in China has influenced                A detailed description of this survey can be found in another
dietary habits, lifestyles, and other health behaviors across              study (26). So far, two studies have used this data to examine
different socioeconomic classes.                                           income-related inequality in health variables. One focused on

Frontiers in Public Health | www.frontiersin.org                       2                                    February 2021 | Volume 9 | Article 606634
Tang et al. Obesity and Income-Related Inequality
health care utilization and the other investigated the self-rated Inequality Measurement
health of migrant workers (27, 28). Our study used the most We constructed a concentration curve to illustrate income
recent (the third) wave of the 2016 CLDS with respondents aged inequality in the probability of being obese and to calculate the
between 16 and 65 years who were working or seeking a job from concentration index (CI) to calibrate the degree and significance
7,212 households within 400 communities or villages across the of income-related inequality regarding the probability of obesity.
nation, providing a total number of 10,267 valid observations A concentration curve lying below the line of absolute equality
suitable for use. Thus, respondents in this study were part of the (the 45-degree line) indicated that obesity was concentrated
current labor force, were aged 16–65 years, and comprised 5,288 among richer workers, whereas a concentration curve that
males and 4,979 females. lies above the line indicates that obesity was concentrated
among poorer workers (32). To estimate the degree and
Dependent and Independent Variables significance of inequality, we used a CI that denoted differences
The first dependent variable in this study was BMI, a widely in obesity according to individual economic status (32). However,
used general obesity indicator, which is calculated as weight normalization is required because the dependent variables in this
in kilograms divided by the square of height in meters. study are a binary outcome (e.g., whether the respondent was
Another obesity indicator is WC measuring individual waist obese or not), so that the concentration index is quantified in
circumference, which was used in many previous studies as the range −1 to +1. We employ the Wagstaff-normalization-
abdominal obesity (20, 29, 30). According to the recommended CI not only because it has a greater emphasis on relative
criteria for Asian and Chinese people (14, 20, 29–31), a BMI of inequality, but also as it tends to work better for the low-
≥28 kg/m2 indicates general obesity for both sexes. Regard to the frequency binary outcome (33). The Wagstaff-normalization-CI
abdominal obesity, we defined respondents’ WC of ≥ 85 cm, and can be demonstrated by the following:
WC ≥ 80 cm was considered as abdominal obesity for males and
2 XN
females, respectively. We recoded the continuous indicator BMI
CIn = Covw [ i=1 Hi Ri − 1 ÷ (1 − µ)] (1)
and WC into two respective binary health outcomes with a value Nµ
of 1 indicating being obese (BMI ≥ 28 kg/m2 ; WC of ≥ 85 cm
for male and WC ≥ 80 cm for female) and a value of 0 indicating where CIn denotes the Wagstaff-normalization-CI for the
otherwise (BMI < 28 kg/m2; WC of < 85 cm for male and WC < probability of being obese (BMI ≥ 28 kg/m2 for both sexes, or
80 cm for female). WC of ≥ 85 cm for male and WC ≥ 80 cm for female) ranging
Independent variables comprised of individual after-tax wage, between −1 (perfect pro-poor inequality) and 1 (perfect pro-
age, gender, health indicators, educational level, marital status, rich inequality). The CI was calculated using the covariance
migrant status, region, insurance status, work status, and lifestyle. between the probability of being obese and the fractional rank
The key independent variable in this study was the individual of the individual’s after-tax wage. Variable Hi is a binary variable
after-tax wage, which was used as a measure of individual indicating whether the ith individual was obese or not, µ stands
economic status to analyze the inequality. Its natural logarithm for the mean rate of actually being obese for the sample, Ri
value was employed in the empirical model to examine its is the fractional rank of the ith individual according to his or
effect on BMI and WC. This study also used a binary health her after-tax wage, for example, i = 1 for the respondent at
outcome of self-rated health (0 = poor; 1 = good) to control the bottom of the income distribution (the poorest) and i =
the unobserved confounding effects on one’s BMI and WC. N for those at the top (the richest). Covw is the covariance
Education level was coded as primary or below, junior secondary, with sampling probability weights, which was provided by the
senior secondary or vocational, and junior college and above. CLDS (34, 35). The 95% confidence intervals for the CIs and
Marital status was classified as single/divorced/widowed, and associated p-values were obtained using the delta method (34,
currently married or cohabits. Previous studies have indicated 36, 37). Therefore, a CI significantly smaller than 0 indicated
that the living environment, working situation, and personal that the greatest proportion of obesity exists among the poorest
lifestyle may affect one’s BMI and WC. Thus, we controlled for workers (or we can say poorer individuals were more likely to
the migrant effect with four dichotomous variables comprising be obese), namely ‘pro-poor’ obesity inequality, whereas a CI
whether the respondents’ migrant statuses were migrant (0 significantly >0 indicated that the greatest proportion of obesity
= N; 1 = Y), non-agricultural Hukou (0 = N; 1 = Y), or exists among the richest workers (or obesity rates occurred more
urban residence (0 = rural; 1 = urban) and if the respondents within wealthier individuals), namely ‘pro-rich’ obesity inequality
were located in the south part of China (0 = north; 1 = (34, 35, 38). We also plotted concentration curves and calculated
south). Three types of binary insurance status variables were CIs according to gender subsamples to investigate any related
controlled for medical, retirement, and other types of insurance. gender differences.
Work status was divided into five groups: seeking or willing
to seek a job (current not working), employee, employer, self- Decomposition of Inequality in Obesity
employed, and agricultural work. The last set of control variables- In the final stage of the analysis, we conducted a decomposition
lifestyle, comprised three binary variables of whether respondents analysis, following previous studies, to assess the extent to
were currently smoking, drinking and participating in physical which factors contribute to inequality in the probability of
activities in the past month, with a value of 1 indicating “Yes” obesity (32, 38–40). Decomposing obesity inequality into the
and 0 indicating “otherwise.” contributions of various explanatory factors was straightforward.
Frontiers in Public Health | www.frontiersin.org 3 February 2021 | Volume 9 | Article 606634Tang et al. Obesity and Income-Related Inequality
According to previously published studies, one’s obesity status socioeconomics k, and individual wage y to the actual
is not only influenced by demographic factors but also by concentration index (CI), respectively. A CI was estimated
one’s social and cultural environment as well as individual for each of the factors, along with important and percentage
economic status. These factors were classified into 10 main contributions to the inequality in the probability of being
groups: 1) demographic factors (age, gender and self-rated obese (CIBMIorWC ). A positive (negative) contribution indicated
health, etc.); 2) educational level (primary or below, junior that the given factor operated toward a pro-rich (pro-poor)
secondary, senior secondary or vocational, and junior college distribution of being obese. We decomposed the CI for the
and above); 3) marital status (single/ divorced/widowed and probability of being obese according to the probit model with
currently married or cohabiting); 4) immigrant status (migrant sample weight applied. Each CI was decomposed into the partial
and resident register: Hukou status); 5) residency status (rural contributions of demographic, educational, marital, migrant,
or urban); 6) regional status (southern or northern China); residency, insurance, work, lifestyle, and individual wage factors.
7) insurance status (presence of medical insurance, retirement Statistical software Stata version 15.1 was used for the analysis.
and other insurance); 8) work status (current not working but
seeking a job, employee, employer, self-employed, or agricultural RESULTS
worker); 9) lifestyle (whether smoking, drinking, and participated
in physical activities in the past month); and 10) individual Descriptive Results
after-tax wage in the past year. Because the dependent variable Table 1 summarizes the characteristics of the individuals
was a binary factor with a value between 0 and 1 (BMI and surveyed by the CLDS 2016. There were 10,267 valid respondents
WC), we employed non-linear approximation rather than a for this study. Overall, ∼7.3% of the total labor force in China
linear method (41). Two advantages exist to using this method: was diagnosed as general obesity, while 44.2% of the sample was
(1) the approximation error of a nonlinear model tends to be diagnosed as abdominal obesity. Specifically, we find that female
smaller and (2) compared with linear decomposition, non-linear workers had significantly (p < 0.001) lower rates of general
decomposition more accurately represents partial contributions. obesity (6.4%) than male workers (8.2%). Although the result
The non-linear approximation of a probit model with partial shows that female workers had slightly higher rates (44.9%) of
effects evaluated at means can be expressed as follows: abdominal obesity than male workers (43.4%), it is statistical
X X insignificance (p = 0.237). The above results imply that the
HBMI or WC = α m + m
j βj Xij ±
m m
k γk Zik + δ yi + εi (2)
measures used for obesity analysis matter and it could result in a
completely different conclusion (20, 29, 30). Moreover, we find a
where HBMIorWC is the obesity indicator(s) defined above; am is piece of preliminary evidence that there is a huge gender wage gap
the intercept; Xij and Zik refer to the jth demographic factors (age, as the mean of individual after-tax wage reveals that male workers
gender, and another health indicator, etc.) and kth socioeconomic have a significantly higher income (26,124.98 Yuan) than female
factors (education, marital status, migrant status, residency, workers (17,190.34 Yuan), and t-test results showed that this
region, insurance status, work status, and lifestyle) of the ith difference is statistical significance. We observe a similar pattern
individual, respectively; yi denotes individual economic status for most of the other variables except the rate of public social
(measured as the logarithm of individual after-tax wage in the welfare status (i.e., medical and retirement insurance status), as
past year); and εi is the error term including approximation listed in Table 1, indicating a significant difference among the
errors (35). Additionally, βjm , γkm , and δ m are the marginal effects majority factors between female and male workers in China.
for the aforementioned factors, dh/dxj , dh/dzk , and dh/dy of each
demographic (x), socioeconomics (z), and individual economic Prevalence of Obesity Among Workers by
factor (y), respectively, evaluated at sample means. Given Eqs. (1) Gender
and (2), the CI can be expressed as follows: In Table 2, the age-adjusted prevalence of being overweight
and of obesity, as well as their 95% confidence intervals, are
X βjm Xj
!
presented as totals and by gender for both rural and urban
m
δ y
CIBMI or WC = Cy + Cj + areas. Both BMI and WC measures are listed. All estimates
µ µ
j were calculated using a weighting variable to accurately represent
!
X γ m Zk GCε the working population of China; thus, the estimates were
k
Ck + (3) made to represent China’s 454.2 million workers, comprising
µ µ
k 218.2 million females and 236.0 million males. Table 2 shows
that the prevalence of being general overweight (BMI ≥ 28
where µ is the mean of HBMIorWC . By employing Eq. (1) and
kg/m2 ) among the labor force was 21.98% (rural) and 24.8%
adjusting it according to Wagstaff ’s method (33), Cy , Cj , and Ck
(urban), whereas the prevalence of general obesity among
denote the CI of yi , xj , and zk , respectively. GCε represents the
workers was 6.265% (rural) and 8.153% (urban). Both results
generalized CI of the error term ε. Additionally, y is the mean
imply that urban workers were more likely to be obese than
individual after-tax wage and Xj and Zk represent the means
rural workers. In terms of the results of overall rates of
of the demographic and socioeconomic factors, respectively.
abdominal overweight among Chinese workers were 19.38%
Moreover, the products βj Xj /µ Cj , γkm Zk /µ Ck , and
m
(rural) and 17.19% (urban), while 64.53% (rural) and 67.69%
δ m y/µ Cy are the contribution of demographic factor j,
(urban) were diagnosed as abdominal obesity. The above results
Frontiers in Public Health | www.frontiersin.org 4 February 2021 | Volume 9 | Article 606634Tang et al. Obesity and Income-Related Inequality
TABLE 1 | Variable statistics description, full, female, and male samplesa .
Variablesb Female Male Total
(N = 4,979) (N = 5,288) (N = 10,267) p-valuec
Key variables
General obesity (BMI≥28) 319 (6.4%) 430 (8.1%) 749 (7.3%) 0.001
Abdominal obesity4 (WCF≥80; WCM≥85) 1,334 (44.0%) 1,350 (43.6%) 2,684 (43.8%) 0.757
Individual after-tax wageTang et al. Obesity and Income-Related Inequality
TABLE 2 | Prevalence of being overweight and of obesity among workers by residency.
Pre-obesity or overweight Obesity
(age-adjusted estimate) % (95% CI) (age-adjusted estimate) % (95% CI)
Both sexes Male Female Both sexes Male Female
BMIa
Rural 21.86 23.79 20.13 6.226 6.589 5.89
[20.36,23.36] [21.64,25.94] [18.23,22.03] [5.458,6.993] [5.480,7.698] [4.877,6.904]
Urban 24.84 28.81 19.79 8.205 9.486 6.306
[22.49,27.19] [26.12,31.51] [16.90,22.68] [6.579,9.832] [7.372,11.60] [4.439,8.173]
t-testc −2.092 −2.869 0.189 2.159 −2.382 −0.383
p-value 0.037 0.004 0.85 0.031 0.017 0.702
WCb
Rural 19.31 19.12 19.07 64.75 65.14 64.83
[17.73,20.89] [17.14,21.10] [17.05,21.10] [62.65,66.84] [62.47,67.82] [61.81,67.84]
Urban 17 18.46 16.67 68.31 69.14 67.65
[15.14,18.86] [16.11,20.81] [14.29,19.06] [65.59,71.04] [66.21,72.07] [64.34,70.95]
t-test 1.859 0.419 1.499 −2.042 −1.995 −1.238
p-value 0.063 0.675 0.134 0.041 0.046 0.216
Sources: CLDS 2016, respondents are labor forces aged 16–65 in China and results are adjusted by sampling weights.
a BMI ≥ 24 kg/m2 for overweight, BMI ≥ 28 kg/m2 for obesity; b For female, WC ≥ 75 cm for overweight, WC ≥ 80 cm for obesity; for male, WC ≥ 80 cm for overweight, WC ≥ 85 cm
for obesity; c t-test for the prevalence difference (overweight or obesity) between rural and urban subsamples.
when considering the BMI measures. However, a significant pro- (logarithmic transferred individual after-tax wage in the past
rich distribution was observed in male workers (CI = 0.112, year) played a key role for pro-rich general obesity in males
p < 0.001). By contrast, a pro-poor distribution was observed (77.68%) and played a similar role for pro-poor distribution
in female workers (CI = −0.141, p < 0.01) with a slightly in females (41.56%). However, its percentage contribution
larger CI value than existed for males (|−0.141| > |0.112|). decreases significantly in the abdominal obese measures for both
The aforementioned results showed that the probability of being male workers (12.13%) and female workers (37.37%). We also
general obese is biased toward wealthier male workers, whereas find that being educated to the senior secondary or vocational
poorer female workers are more likely to be general obese. and above contributed to a pro-poor probability of being obese,
Regarding the WC measures, the result shows that a slightly which was most pronounced for female workers in both generals
significant pro-poor distribution of abdominal obesity (CI = (15.72 and 36.88%) and abdominal (9.43 and 40.86%) obesity.
−0.043, p < 0.1) in the overall labor forces. Specifically, as However, the educational factors were less of a contributing
same as the BMI measures, we also divided into male and factor and played an opposite direction for male workers (from
female subsamples, and the result shows a significant pro- a minimum |−0.702| to a maximum |−21.06|). Moreover,
rich (CI = 0.059, p < 0.1) and a pro-poor (CI = −0.166, some contributing factors displayed different roles for female
p < 0.001) distribution in male workers and female workers, and male workers since their CI curves operate the opposite
respectively. In summary, we employed both BMI and WC to distribution. For instance, another contributor to increased
measure respondent obesity status and their particular relation income-related inequality in general and abdominal obesity was
with individual after-tax wage, even though the values of CIs region status for female respondents (south China, 14.99 and
are different, the results show that the income-related obesity 7.510%), whereas this factor was decreased the income-related
distribution of male worker presents a pro-rich distribution, inequality in both obesity indexes and more influential for male
while for the female worker a pro-poor distribution is shown. workers (south China, −26.20 and −49.85%), implying that the
The result suggests that male workers with higher incomes are male labor forces who were living in the south part of China
more likely to become obese, and conversely, female workers with play a significant role in declining the pre-rich income-related
lower incomes are more likely to become obese. obesity distribution. In addition, one’s employment status, such
Table 3 lists the detailed contributions of all factors to as being an employee, was the main contributor for both male
inequality in the probability of being obese for male and female and female respondents in general obesity (44.25 and 54.78%)
workers in China. A positive (negative) partial contribution but contributed less to abdominal obesity (16.80 and 7.0%).
indicates that the factor increases (decreases) the total inequality However, the results show that involvement in agriculture work
in income-related obesity (CIBMI or CIWC ), with positive decreases the income-related (general and abdominal) obesity
(negative) percentages indicating increases (decreases) in inequality in both male and female workers, especially for female
percentages. We observe that individual economic status workers (−40.13 and −31.92%). Similar results with variations
Frontiers in Public Health | www.frontiersin.org 6 February 2021 | Volume 9 | Article 606634Tang et al. Obesity and Income-Related Inequality
FIGURE 1 | Concentration curve for the probability of being general or abdominal obese (BMI ≥ 28; WC≥80 for females or WC≥85 for males) by total, female, and
male works, China, 2016. X-axis represents the cumulative population proportion, ranked by individual annual after-tax wage; respondents are labor forces aged
16–65 in China and results are adjusted by sampling weights.
(positive or negative contributions) were also observed in the status, work status, education level, work status, residency
other group of variables, such as other migrant status indicators, status, lifestyle, and region were also drivers of this difference.
insurance status indicators, and lifestyle, etc. The details are Specifically, for the female subsample, contributors such as
listed in Table 3. immigrant, insurance and residency statuses accounted for
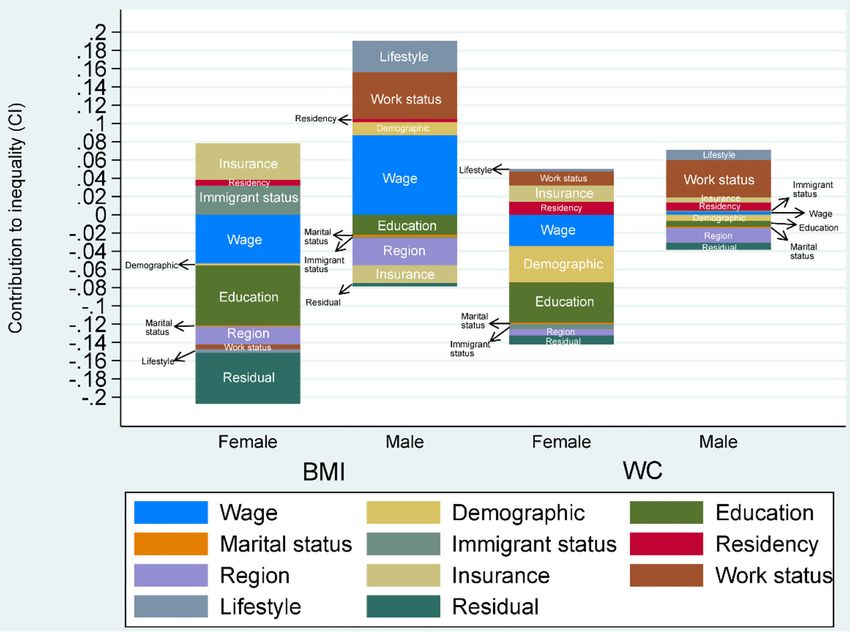
Figure 2 is a graphical depiction of inequality in income- reducing the pro-poor concentration of general obesity, whereas
related general and abdominal obesity decomposed into 11 the other contributors, especial educational level, work status,
determinants. The results are separated by gender as per Table 3, wage, and unexplainable factors (residuals) operated to increase
and the determinants comprise demographics (age, gender, and the pro-poor concentration in general obesity. For males, the
health indicators), educational level, marital status, migrant distribution of pro-rich general obesity was driven by factors
status, residency status, region, insurance status, working status, of residency, work status, lifestyle, and individual economic
lifestyle, individual economic status (wage), and residual terms. status. However, the contribution of education, immigrant,
Figure 2 indicates that inequality was considerably higher for region, insurance, and marital status factors reduced the pro-rich
females than for males, as same as results shown in Figure 1 and inequality in general obesity. We can find a similar result but with
Table 3. some differences in abdominal obesity among male and female
Figure 2 suggests that demographic factors contributed the subsample, respectively.
least to the income-related inequality in general and abdominal
obesity among female and male workers. In addition, as same as
listed in Table 3, this indicates that individual economic status DISCUSSION
and other socioeconomics factors were the main contributors to
the income-related inequality in general and abdominal obesity This paper reveals the fact that the overall prevalence of
for both female and male workers. However, some factors were being overweight and obesity in China is at a high-level as
associated with increased inequality in income-related obesity for a developing country. The overall prevalence of being general
male workers but with decreased inequality for females. Other obesity (measured by BMI) varies by gender and residency from
socioeconomics contributors, such as insurance, immigrant a minimum of 5.88% to a maximum of 9.46%. In contrast,
Frontiers in Public Health | www.frontiersin.org 7 February 2021 | Volume 9 | Article 606634Tang et al. Obesity and Income-Related Inequality
TABLE 3 | Detailed contributions to inequality in the probability of being obese by demographic and socioeconomic factors, and female and male labor forces.
Contribution and percentage contribution BMI WC
Female Male Female Male
Contr. to CI % contr. to CI Contr. to CI % contr. to CI Contr. to CI % contr. to CI Contr. to CI % contr. to CI
CI −0.129 100 0.112 100 −0.092 100 0.033 100
Residual −0.056 43.193 −0.004 −3.147 −0.010 10.640 −0.008 −23.098
After-tax wage (log) −0.054 41.555 0.087 77.676 −0.034 37.365 0.004 12.130
Demographic & socioeconomic factors
Age −0.003 2.107 0.018 15.649 −0.037 40.405 −0.003 −9.817
SRH 0.000 −0.381 −0.003 −2.795 −0.003 2.889 −0.004 −10.913
Education level (ref: primary or below)
Junior secondary 0.002 −1.794 0.002 2.044 0.001 −1.097 −0.000 −0.980
Senior secondary or vocational −0.020 15.722 −0.001 −0.702 −0.009 9.431 −0.002 −6.255
Junior college and above −0.048 36.878 −0.024 −21.063 −0.038 40.858 −0.005 −14.255
Marital status (ref: never married/divorced/widowed)
Currently married or cohabitating −0.001 0.966 −0.003 −2.263 −0.000 0.034 −0.001 −2.282
Migrant status
Migrant 0.004 −3.366 −0.005 −4.684 −0.002 1.876 −0.013 −39.840
Non-agricultural Hukou 0.028 −21.323 0.004 3.416 −0.004 4.291 0.014 41.820
Residency 0.006 −4.995 0.004 3.333 0.014 −15.187 0.009 27.701
Region −0.019 14.994 −0.029 −26.199 −0.007 7.510 −0.016 −49.849
Insurances
Medical insurance 0.000 −0.287 0.001 0.608 0.000 −0.225 0.001 2.002
Retirement insurance 0.002 −1.867 0.005 4.596 0.000 −0.292 0.001 2.833
Other insurances 0.037 −28.675 −0.025 −22.647 0.018 −19.213 0.004 12.074
Work status (ref: not working)
Employee −0.057 44.254 0.061 54.789 −0.015 16.803 0.002 7.002
Employer −0.000 0.232 0.002 1.854 −0.000 0.074 0.000 1.201
Self-employ 0.000 −0.164 −0.002 −1.444 0.001 −1.489 0.001 2.322
Agriculture work 0.052 −40.127 −0.011 −9.814 0.029 −31.921 0.037 114.884
Lifestyle
Smoking −0.000 0.226 0.002 1.849 0.000 −0.330 0.000 0.231
Drinking −0.000 0.007 0.000 0.145 −0.000 0.011 0.000 1.351
Physical activities −0.004 2.847 0.032 28.798 0.002 −2.433 0.010 31.736
Sources: CLDS 2016.
Decomposition based on the results of probit model. Sample weights applied. CIs were calculated and adjusted by the method proposed by Wagstaff (33), as same as shown in Figure 1.
abdominal obesity (measured by WC) prevalence presents a concentrations of income-related inequality in abdominal obesity
socking level from 64.53 to 67.69%. Our study is consistent with among all Chinese labor forces.
another study that also revealed the prevalence of overweight Additionally, the decomposition analysis revealed that
and obesity varies greatly among different population subgroups educational level and individual after-tax wage in the past
(42). We find that there is significant income-related inequality year were the main contributors to inequality in general
in general and abdominal obesity thresholds for both female and abdominal obesity for females, whereas working status,
and male workers in China. The lower-income female workers income, and lifestyle were the main contributors to inequality
are more likely to experience obesity than the richer female in general and abdominal obesity for males. Moreover,
workers, whereas wealthier male workers are more likely to contributors to income-related obesity inequality, such as
be obese than poorer male workers. We also noticed that the immigrant, insurance and residency statuses, were determined
different effects for male and female workers counteract each to reduce the pro-poor concentration of general obesity in
other, thus, the overall result of the Chinese labor force does female workers. These two factors also decreased the pro-rich
not show any pro-rich or pro-poor concentrations of income- concentration of general obesity in males. The aforementioned
related inequality regarding the probability of general obesity, results may indicate that, besides income level, other social
but our result presents that there are slightly significant pro-poor factors such as educational level, immigrant and insurance
Frontiers in Public Health | www.frontiersin.org 8 February 2021 | Volume 9 | Article 606634Tang et al. Obesity and Income-Related Inequality FIGURE 2 | Contributions of Demographic and socioeconomic factors to CI for the probability of obesity (BMI ≥ 28; WC ≥ 80 for females or WC ≥ 85 for males) in China by female and male workers. statuses contributed to the general and abdominal obesity in workers, rather than being an indicator of the validity of the inequality significantly. cut-off point concerning defined body fat. Our study represents one of the first attempts to characterize The inequalities in obesity for men were moderately less the association between obesity and socioeconomic parameters than those for women. This finding is consistent with a related in the Chinese working population. Previous studies from theory about income and obesity (47). A related study also other countries, such as the United States, have highlighted the reported a significant pro-rich inequality for females (48), which medical costs and loss of productivity caused by increased rates is inconsistent with our results, indicating a pro-poor distribution of being overweight and obesity and have estimated that the among female workers. Our findings might be attributed to two aggregated annual cost attributable to obesity among full-time factors. The first is that rich female workers might engage more employees is US$73.1 billion (6, 43). Numerous studies have in fitness-related activities and the second is that poor female shown that obesity or being overweight among workers may workers might have an excessive intake of total carbohydrates. cause adverse occupational consequences such as absenteeism Additionally, the decomposition analysis also indicated that and presenteeism, work limitations, and workplace impairment individual income and education were the main explanatory (44–46). Future studies should explore possible reasons that factors of both general and abdominal obese inequality, especially the labor force, which was the target population in our study, for females. The possible explanation for these two significant is disproportionately affected by central adiposity. Moreover, a factors might be contributed by the “one-child” policy, which large proportion of the working population was observed to be to improve the educational attainment and earnings of Chinese overweight or pre-obese, whereas the prevalence of obesity was females in the past decades, or the so-called “missing girls’ considerably lower. This significant distinction between being effect” (49, 50). Moreover, a recent report shows that the overweight and being obese may indicate rapid growth in obesity percentage of females enrolled in masters-level postgraduate Frontiers in Public Health | www.frontiersin.org 9 February 2021 | Volume 9 | Article 606634
Tang et al.                                                                                                         Obesity and Income-Related Inequality

programs increased from 50.36% in 2010 to 53.14% in 2016,                    Apart from individual income, education, and lifestyle, we
while the percentage of females enrolled in undergraduate                    observe that work-related factors, such as work status, contribute
programs increased from 49.68% in 2010 to 53.44% in 2016 (51).               to inequality in obesity. For health policymakers, understanding
Considering our observed samples are mainly from the latest                  the determinants of being overweight and of obesity may help
labor force in 2016, which means that they were born in the 80s              in designing interventions that promote health and fitness and,
and 90s–the “one-child” policy generation. It is also explaining             consequently, improve associated labor outcomes.
why the educational level at junior college and above among
female workers is greater than male workers as Table 1 shows.                DATA AVAILABILITY STATEMENT
Therefore, compared with male workers, education plays a more
important role in reducing obesity income-related inequality                 Publicly available datasets were analyzed in this study. This data
among female workers. Our results are also in line with those of             can be found at: http://www.cnsda.org/index.php?r=projects/
previous studies that have indicated how income and educational              view&id=75023529.
attainment strongly related to levels of obesity (52). Other factors,
such as working status and lifestyle, were evident contributors to           ETHICS STATEMENT
inequality in obesity for male workers. It is possible as different
work status and lifestyle has been proved that strongly correlated           Ethical review and approval was not required for the
with one’s weight, especial for males (53, 54). In addition, there           study on human participants in accordance with the
is a related paper revealed that a majority of the social gradient           local legislation and institutional requirements. Written
concerning health inequality could be explained by the work                  informed consent for participation was not required for this
environment and lifestyle factors (55).                                      study in accordance with the national legislation and the
    This study also has a couple of limitations. First, two binary           institutional requirements.
obesity indicators measured using BMI and WC may not
completely present all aspects of human obesity index in the                 AUTHOR CONTRIBUTIONS
labor force (18). For example, BMI and WC do not estimate lean
muscle mass. However, an advantage is that both BMI and WC                   CT conceived and designed the experiments. XY performed the
are highly correlated with body fat percentage and is widely used            experiments and analyzed the data. CT and XY wrote the paper.
to define obesity. Second, although the CI has been widely applied           XY and FP restructured, polished, and revised the paper. XH
in the measurements of inequality (56), intense debate exists                contributed this work by providing data access. All authors read
concerning the characteristics and value judgments of this index’s           and approved the final manuscript.
spectrum (57, 58). Nevertheless, no consensus exists about the
indicators that should be used to evaluate inequalities in health or         FUNDING
health-related lifestyle (59). Third, our study presented evidence
of correlation instead of causality. Finally, our data is limited            The authors gratefully acknowledge the financial aids from
to the Chinese labor force, which we considered important as it              the Young Scientists Fund of the National Natural Science
accounts for around one-fifth of the world’s labor force.                    Foundation of China (Grant No. 71704143); the Ministry of
                                                                             Education in China (MOE) Project of Humanities and Social
CONCLUSION                                                                   Sciences for Young Scholars (Grant No. 18YJCZH221); and
                                                                             the research hatch fund of Guangzhou University (Grant No.
To summarize, this study is the first to describe the prevalence of          RP2020012). The funders had no role in study design, data
overweight and obesity in the Chinese labor force. Our research              collection and analysis, decision to publish, or preparation of
is relevant because we focused on the population group that is               the manuscript.
most crucial to productivity and economic development. The
results also have substantial implications for the measurement               ACKNOWLEDGMENTS
of socioeconomic inequalities in adiposity. For example, income
factors play opposite roles in contributing to inequalities                  This research uses data from China Labor-force Dynamic Survey
in obesity between female and male labor forces in China.                    (CLDS). We thank the data collectors in the School of Sociology
Educational level, however, plays a significant role in decreasing           & Anthropology, Sun Yat-Sen University. Neither the original
the obesity income-related inequality for both sexes, especially             collectors nor the distributors of the data bear any responsibility
for female workers. The possible reason could be contributed                 for the analyses or interpretations presented here. All remaining
by the “one-child” policy or the so-called “missing girls’ effect.”          errors are our own.

REFERENCES                                                                   2. Kotchen TA. Obesity-related hypertension: epidemiology, pathophysiology,
                                                                                and clinical management. Am J Hypertens. (2010) 23:1170–8.
 1. Bianchini F, Kaaks R, Vainio H. Overweight, obesity, and cancer             doi: 10.1038/ajh.2010.172
    risk. Lancet Oncol. (2002) 3:565–74. doi: 10.1016/s1470-2045(02)0        3. Nguyen NT, Nguyen XM, Lane J, Wang P. Relationship between obesity
    0849-5                                                                      and diabetes in a US adult population: findings from the National Health

Frontiers in Public Health | www.frontiersin.org                        10                                      February 2021 | Volume 9 | Article 606634
Tang et al. Obesity and Income-Related Inequality
and Nutrition Examination Survey, 1999-2006. Obes Surg. (2011) 21:351–5. 25. Fang C, Liang Y. Social disparities in body mass index (BMI) trajectories
doi: 10.1007/s11695-010-0335-4 among Chinese adults in 1991-2011. Int J Equity Health. (2017) 16:146.
4. Maffetone PB, Laursen PB. The Prevalence of Overfat Adults and Children in doi: 10.1186/s12939-017-0636-5
the US. Front Public Health. (2017) 5:90. doi: 10.3389/fpubh.2017.00290 26. Wang J, Zhou Y, Liu S. China labor-force dynamics survey. Chinese Sociol
5. Renehan AG, Tyson M, Egger M, Heller RF, Zwahlen M. Body- Dialogue. (2017) 2:83–97. doi: 10.1177/2397200917735796
mass index and incidence of cancer: a systematic review and meta- 27. Lu L, Zeng J, Zeng Z. What limits the utilization of health services
analysis of prospective observational studies. Lancet. (2008) 371:569–78. among china labor force? analysis of inequalities in demographic,
doi: 10.1016/S0140-6736(08)60269-X socioeconomic and health status. Int J Equity Health. (2017) 16:30.
6. Finkelstein EA, Trogdon JG, Cohen JW, Dietz W. Annual medical spending doi: 10.1186/s12939-017-0523-0
attributable to obesity: payer-and service-specific estimates. Health Aff. (2009) 28. Shao C, Meng X, Cui S, Wang J, Li C. Income-related health inequality of
28:w822–31. doi: 10.1377/hlthaff.28.5.w822 migrant workers in China and its decomposition: an analysis based on the
7. Finkelstein EA, Khavjou OA, Thompson H, Trogdon JG, Pan L, Sherry B, et al. 2012 China Labor-force Dynamics Survey data. J Chin Med Assoc. (2016)
Obesity and severe obesity forecasts through 2030. Am J Prev Med. (2012) 79:531–7. doi: 10.1016/j.jcma.2016.02.009
42:563–70. doi: 10.1016/j.amepre.2011.10.026 29. Wildman RP, Gu D, Reynolds K, Duan X, He J. Appropriate body mass
8. Wang H, Du S, Zhai F, Popkin BM. Trends in the distribution of body mass index and waist circumference cut-offs for categorization of overweight and
index among Chinese adults, aged 20–45 years (1989–2000). Int J Obes. (2007) central adiposity among Chinese adults. Am J Clin Nutr. (2004) 80:1129–36.
31:272. doi: 10.1038/sj.ijo.0803416 doi: 10.1093/ajcn/80.5.1129
9. Bell AC, Ge K, Popkin BM. The road to obesity or the path to prevention: 30. Zhou BF, Cooperative Meta-Analysis Group of the Working Group on
motorized transportation and obesity in China. Obes Res. (2002) 10:277–83. Obesity. in: C. Predictive values of body mass index and waist circumference
doi: 10.1038/oby.2002.38 for risk factors of certain related diseases in Chinese adults–study on optimal
10. Huang W-Z, Yang B-Y, Yu H-Y, Bloom MS, Markevych I, Heinrich cut-off points of body mass index and waist circumference in Chinese adults.
J, et al. Association between community greenness and obesity in Biomed Environ Sci. (2002) 15:83–96.
urban-dwelling Chinese adults. Sci Total Environ. (2020) 702:135040. 31. Xu W, Zhang H, Paillard-Borg S, Zhu H, Qi X, Rizzuto D. Prevalence of
doi: 10.1016/j.scitotenv.2019.135040 overweight and obesity among chinese adults: role of adiposity indicators and
11. Popkin BM, Du S, Zhai F, Zhang B. Cohort profile: the China health age. Obes Facts. (2016) 9:17–28. doi: 10.1159/000443003
and nutrition survey–monitoring and understanding socioeconomic and 32. O’Donnell O, Van Doorslaer E, Wagstaff A, Lindelow M. Analyzing Health
health change in China, 1989-2011. Int J Epidemiol. (2010) 39:1435–40. Equity Using Household Survey Data: A Guide to Techniques and Their
doi: 10.1093/ije/dyp322 Implementation. Washington, DC: The World Bank (2007).
12. Li XY, Jiang Y, Hu N, Li YC, Zhang M, Huang ZJ, et al. Prevalence 33. Wagstaff A. The bounds of the concentration index when the variable of
and characteristic of overweight and obesity among adults in China, 2010. interest is binary, with an application to immunization inequality. Health
Zhonghua Yu Fang Yi Xue Za Zhi [Chinese Journal of Preventive Medicine]. Econ. (2005) 14:429–32. doi: 10.1002/hec.953
(2012) 46:683–686. 34. Van Doorslaer E, Masseria C. Income-Related Inequality in the Use of Medical
13. He Q, Li X, Wang R. Childhood obesity in China: does Care in 21 OECD Countries. Paris: OECD (2004).
grandparents’ coresidence matter? Econ Hum Biol. (2018) 29:56–63. 35. Kakwani N, Wagstaff A, Van Doorslaer E. Socioeconomic inequalities in
doi: 10.1016/j.ehb.2018.02.001 health: measurement, computation, and statistical inference. J Econom.
14. Xi B, Liang Y, He T, Reilly KH, Hu Y, Wang Q, et al. Secular trends in the (1997) 77:87–103.
prevalence of general and abdominal obesity among Chinese adults, 1993- 36. Koolman X, van Doorslaer E. On the interpretation of a concentration index
2009. Obes Rev. (2012) 13:287–96. doi: 10.1111/j.1467-789X.2011.00944.x of inequality. Health Econ. (2004) 13:649–56. doi: 10.1002/hec.884
15. Ogden CL, Carroll MD, Kit BK, Flegal KM. Prevalence of obesity and trends 37. Rao CR, Statistiker M, Rao CR. Linear statistical inference and its applications.
in body mass index among US children and adolescents, 1999–2010. JAMA. New York, NY: Wiley (1973).
(2012) 307:483–90. doi: 10.1001/jama.2012.40 38. Gonzalo-Almorox E, Urbanos-Garrido RM. Decomposing socioeconomic
16. Yanai M, Kon A, Kumasaka K, Kawano K. Body mass index variations by inequalities in leisure-time physical inactivity: the case of Spanish children.
age and sex, and prevalence of overweight in Japanese adults. Int J Obes Relat Int J Equity Health. (2016) 15:106. doi: 10.1186/s12939-016-0394-9
Metab Disord. (1997) 21:484–8. doi: 10.1038/0800434 39. Roberts K, Cavill N, Hancock C, Rutter H. Social and Economic Inequalities in
17. Maffetone PB, Rivera-Dominguez I, Laursen PB. Overfat adults and children Diet and Physical Activity. London: University of Bath (2013).
in developed countries: the public health importance of identifying excess 40. Wagstaff A, Van Doorslaer E. Measuring and testing for inequity in the
body fat. Front Public Health. (2017) 5:190. doi: 10.3389/fpubh.2017.00190 delivery of health care. J Hum Resour. (2000) 35:716–733. doi: 10.2307/146369
18. Dreher M, Hoffmann SW, Brendel C, Heser D, Simon P. Convenience 41. Saito E, Gilmour S, Yoneoka D, Gautam GS, Rahman MM, Shrestha PK,
behavior and being overweight in adults: development and validation of et al. Inequality and inequity in healthcare utilization in urban Nepal: a
the convenience behavior questionnaire. Front Public Health. (2019) 7:20. cross-sectional observational study. Health Policy Plan. (2016) 31:817–24.
doi: 10.3389/fpubh.2019.00020 doi: 10.1093/heapol/czv137
19. Bonde JP, Viikari-Juntura E. The obesity epidemic in the occupational 42. Zhang L, Wang Z, Wang X, Chen Z, Shao L, Tian Y, et al. Prevalence of
health context. Scand J Work Environ Health. (2013) 39:217–9. overweight and obesity in China: results from a cross-sectional study of
doi: 10.5271/sjweh.3362 441 thousand adults, 2012–2015. Obes Res Clin Pract. (2020) 14:119–126.
20. Mosca I. Body mass index, waist circumference and employment: doi: 10.1016/j.orcp.2020.02.005
evidence from older Irish adults. Econ Hum Biol. (2013) 11:522–33. 43. Finkelstein EA, DiBonaventura M, Burgess SM, Hale BC. The costs
doi: 10.1016/j.ehb.2013.05.002 of obesity in the workplace. J Occup Environ Med. (2010) 52:971–6.
21. Caliendo M, Lee WS. Fat chance! Obesity and the transition from doi: 10.1097/JOM.0b013e3181f274d2
unemployment to employment. Econ Hum Biol. (2013) 11:121–33. 44. Rodbard HW, Fox KM, Grandy S, Shield Study G. Impact of obesity
doi: 10.1016/j.ehb.2012.02.002 on work productivity and role disability in individuals with and at
22. Larose SL, Kpelitse KA, Campbell MK, Zaric GS, Sarma S. Does obesity risk for diabetes mellitus. Am J Health Promot. (2009) 23:353–60.
influence labour market outcomes among working-age adults? Evidence doi: 10.4278/ajhp.081010-QUAN-243
from Canadian longitudinal data. Econ Hum Biol. (2016) 20:26–41. 45. Pollack KM, Sorock GS, Slade MD, Cantley L, Sircar K, Taiwo O, et al.
doi: 10.1016/j.ehb.2015.09.007 Association between body mass index and acute traumatic workplace injury
23. Schmier JK, Jones ML, Halpern MT. Cost of obesity in the workplace. Scand J in hourly manufacturing employees. Am J Epidemiol. (2007) 166:204–11.
Work Environ Health. (2006) 32:5–11. doi: 10.5271/sjweh.970 doi: 10.1093/aje/kwm058
24. Tafreschi D. The income body weight gradients in the developing economy of 46. Hertz RP, Unger AN, McDonald M, Lustik MB, Biddulph-Krentar
China. Econ Hum Biol. (2015) 16:115–34. doi: 10.1016/j.ehb.2014.02.001 J. The impact of obesity on work limitations and cardiovascular
Frontiers in Public Health | www.frontiersin.org 11 February 2021 | Volume 9 | Article 606634Tang et al. Obesity and Income-Related Inequality
risk factors in the US workforce. J Occup Environ Med. (2004) 55. Borg V, Kristensen TS. Social class and self-rated health: can the gradient be
46:1196–203. explained by differences in life style or work environment? Soc Sci Med. (2000)
47. Lakdawalla D, Philipson T. The growth of obesity and technological change. 51:1019–30. doi: 10.1016/s0277-9536(00)00011-3
Econ Hum Biol. (2009) 7:283–93. doi: 10.1016/j.ehb.2009.08.001 56. Zhang Q, Wang Y. Trends in the association between obesity and
48. Ljungvall A, Gerdtham UG. More equal but heavier: a longitudinal analysis of socioeconomic status in U.S. adults: 1971 to 2000. Obes Res. (2004) 12:1622–
income-related obesity inequalities in an adult Swedish cohort. Soc Sci Med. 32. doi: 10.1038/oby.2004.202
(2010) 70:221–31. doi: 10.1016/j.socscimed.2009.10.014 57. Erreygers G, Van Ourti T. Putting the cart before the horse. A comment
49. Chen Y, Li H, Meng L. Prenatal sex selection and missing girls in China. J Hum on Wagstaff on inequality measurement in the presence of binary variables.
Resour. (2013) 48:36–70. doi: 10.3368/jhr.48.1.36 Health Econ. (2011) 20:1161–5. doi: 10.1002/hec.1754
50. Ebenstein AY, Sharygin EJ. The Consequences of the “Missing Girls” of China. 58. Wagstaff A. Correcting the concentration index: a comment. J Health
World Bank Econ Rev. (2009) 23:399–425. doi: 10.1093/wber/lhp012 Econ. (2009) 28:516–20, author reply 521-4. doi: 10.1016/j.jhealeco.2008.
51. Ministry of Education. Ministry of Education of the People’s Republic 12.003
of China, Education Statistics Annual 2010-2017. Number of Female 59. Kjellsson G, Gerdtham UG. On correcting the concentration index for
Students of Schools by Type and Level. Education Statistics Annual 2010- binary variables. J Health Econ. (2013) 32:659–70. doi: 10.1016/j.jhealeco.2012.
2017 Number of Female Students of Schools by Type and Level. (2018). 10.012
Available online at: http://www.moe.gov.cn/s78/A03/moe_560/jytjsj_2015/
2015_qg/201610/t20161012_284506.html (accessed November 16, 2020). Conflict of Interest: The authors declare that the research was conducted in the
52. Costa-Font J, Gil J. What lies behind socioeconomic inequalities in absence of any commercial or financial relationships that could be construed as a
obesity in Spain? A decomposition approach. Food Policy. (2008) 33:61–73. potential conflict of interest.
doi: 10.1016/j.foodpol.2007.05.005
53. Brennan SL, Henry MJ, Nicholson GC, Kotowicz MA, Pasco JA. Copyright © 2021 Tang, Yang, Peng and Hu. This is an open-access article distributed
Socioeconomic status, obesity and lifestyle in men: the Geelong Osteoporosis under the terms of the Creative Commons Attribution License (CC BY). The use,
Study. J Men’s Health. (2010) 7:31–41. doi: 10.1016/j.jomh.2009.10.004 distribution or reproduction in other forums is permitted, provided the original
54. Burgess E, Hassmén P, Pumpa KL. Determinants of adherence to lifestyle author(s) and the copyright owner(s) are credited and that the original publication
intervention in adults with obesity: a systematic review. Clin Obes. (2017) in this journal is cited, in accordance with accepted academic practice. No use,
7:123–135. doi: 10.1111/cob.12183 distribution or reproduction is permitted which does not comply with these terms.
Frontiers in Public Health | www.frontiersin.org 12 February 2021 | Volume 9 | Article 606634You can also read