PUBLIC HEALTH COUNCIL - February 17, 2021 Please standby - the meeting will begin shortly - Mass.gov
←
→
Page content transcription
If your browser does not render page correctly, please read the page content below
PUBLIC HEALTH
                          COUNCIL
                             February 17, 2021
        Please standby – the meeting will begin shortly

Today’s presentation is available on the mass.gov/dph website under “Upcoming Events” by
                  clicking on the February 17 Public Health Council listing
PUBLIC HEALTH
                    COUNCIL
                      February 17, 2021

  Today’s presentation is available on the mass.gov/dph website under
“Upcoming Events” by clicking on the February 17 Public Health Council
                                  listing
Vaccine rollout

                  3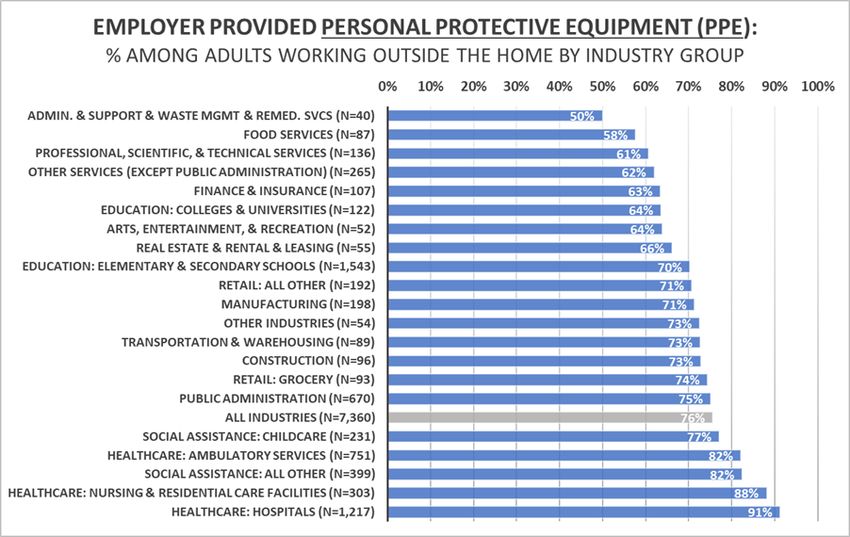
New state public information campaign

•   $2.5M campaign
•   Backed by research
•   Uses trusted messengers
•   Focus on safety and trust
•   TV, radio, digital
•   Assets in 11 languages
•   February to June

                                                   4
COVID Communications Advisory Group
Marlishia Aho           1199 SEIU Massachusetts
Justin Auguste          The Castle Group
Jennifer BerrymanUMASS Medical School
Isabel Gonzales-Webster Worcester Interfaith
Kathleen Jeanty         Boston Public Health Commission
Juan Lopera             Tufts Health Plan
Nick Martin             Office of Mayor Marty Walsh
Sam Melnick             Mass Health & Hospital Association
Yadires Nova-Salcedo    TV Producer and Host
Kerin O’Toole           MA League of Community Health Centers
Christina Peaslee       Cape Cod Healthcare
Colette Phillips        Colette Phillips Communications
Bec Rollins             Pathfinder International
Dawn Sibor              MA Health Officers Association
Tanisha Sullivan        NAACP – Boston Branch
Sharon Torgerson        Mass General Brigham
Katherine (Swift) Udden Massachusetts Medical Society
Gwendolyn Vansant       BRIDGE of the Berkshires
Judith Ward             Baystate Health
Increasing Equity in Vaccine
    Awareness & Access
          February 17, 2021

         Public Health Council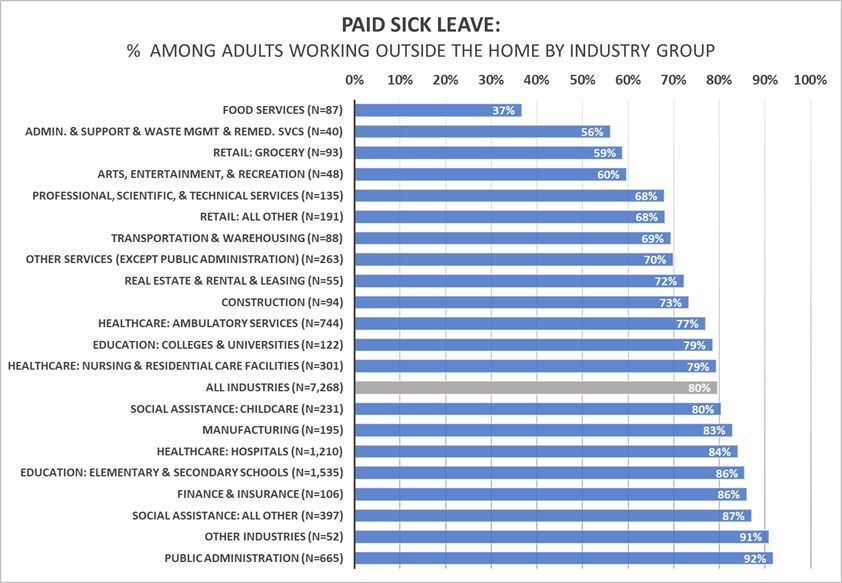
Process to Identify High Need Communities
 Combining the CDC's Social Vulnerability Index (SVI)
 as well as case rates of COVID-19 in communities,
 and giving each equal (50%) weight, helped identify
 potential 'high need' communities in Massachusetts
 • Analysis done in Fall 2020 by McKinsey in
   collaboration with external Vaccine Advisory Group
 • Method uses county level SVI and city-level case
   rates
 • List prioritizes 40% of all communities in the
   Commonwealth (shown in red on this map)
                                                         Massachusetts Communities: Combined
 • List includes cities where case rates may be driven              SVI and Cases
   by congregate care sites, which have been
   prioritized within the phases of the vaccine                       Red: Higher SVI and cases
   deployment                                                        Green: Lower SVI and cases
                                                                                        7
Top 20 Prioritized High Need Communities
N=20 Communities Listed in
Alphabetical Order           1.   Started with all cities and towns with the top SVI/Case Rate for COVID-19
                                  (CDC model, per Advisory Committee, 40% of cities/towns) (n=141)
Boston                       2.   Ranked these by average daily case rate for COVID-19 for cities and towns
Brockton                          (after excluding LTC, CF and towns
Invest in Community
Context: The pandemic is exacerbating pre-existing public health concerns; vaccine confidence
relates to mistrust in the health system and differs by race/ethnicity and income. Engaging trusted
messengers and reducing barriers (ability to receive vaccine from a trusted source, reducing
transportation and language access barriers, etc.) will increase confidence.
Goal: To increase vaccine trust, and access, engage communities most affected by COVID-19 in the
development, testing, and delivery of vaccine messaging, and use feedback to inform targeted
community engagement, public awareness campaign, FAQs, social media, and other
communications materials. Utilize CHWs and other trusted community members to address barriers
to access. Develop tailored vaccination approaches to address logistical and operational
requirements for vaccinations, including focus on cross-cutting populations, such as: indigenous
people, individuals with disabilities and access and functional needs, those living in rural settings.
• Communications Campaign: Trust the Facts. Get the Vax.
• Community Guide to increase ease of access to educational materials and encourage community
  organizations to conduct their own vaccine education/outreach
    • Training webinars scheduled this & next week (~400 participants)
• Vaccine Ambassador program to support community-led education
• Partnership with Community & Faith Based Organizations in hardest hit communities to conduct
  tailored priority population outreach/education (HRiA-led; currently $300k for 20 organizations)
• Partnership with Mass League of Community Health Centers: CHW Vaccine Ambassador program
  ($1M); COVID-19 vaccine community engagement campaign ($50k)
                                                                                                         9
Community-Driven Model
• Implement a community-based and driven system, designed around
  needs and assets for each individual community
• Focused on priority populations
• Designed to address equity needs and efficiency goals
• Introductory calls made 2/16
• Coordination through a DPH Community Liaison for each community
  (beginning Feb 22, 2021)
• Leverage and coordinate resources; existing and growing menu to
  customize support to address vaccine confidence, access and barriers

                                                                     10
DPH Liaison
As part of the outreach, a DPH Community Liaison will work to leverage and coordinate state
resources and customize a menu of options to be offered to each community, which may include:
• Identifying gaps and mapping available resources to reduce barriers to vaccination
• Coordinating and supporting key stakeholders to maximize and align efforts, while synchronizing outreach,
working closely with the Local Board of Health, local Community and Faith Based Organizations, Community
Health Centers, and Community Health Workers who can support grassroots outreach to priority populations
• Developing population specific outreach activities and engagement strategies to help increase vaccine
confidence
• Deploying DPH Vaccine Ambassadors to provide support for town-halls and other community forums to
share information and materials, including a DPH forum guide and toolkit
• Disseminating culturally appropriate translations of communications campaign materials, including: Trust the
Facts. Get the Vax. campaign materials and vaccine FAQs in multiple languages.
• Hiring local residents to provide “boots on the ground” for neighborhood and local business outreach, which
may include a door-knocking campaign to provide information and answer questions about vaccine efficacy
and safety.
11Community-Driven Framework
Vaccination
Providers
CBOs/FBO/Co Healthcare
mmunity providers
partners
Priority
Populations
Communications
and Outreach
LBOH
Engagement
Strategies
12DPH Community Liaison Role
• Meets regularly with representatives from priority communities
• Assesses needs & identifies gaps
• Leverages and coordinates DPH, Command, and community resources
to fill gaps
• Facilitates requests for any communication material
development/review needs
• Identify barriers to vaccine access (transportation, scheduling, etc.)
and inform solutions
• Connect priority populations with available vaccine
13Determination of Need: Request by Emerson Endoscopy and Digestive Health Center, LLC for Substantial Change in Service
M a ssachusetts D e partment o f P u blic H e alth

            COVID-19
C o mmunity Impact Sur vey(CCIS)
          Preliminary Analysis Results
               February 17, 2021

                                                        15
CCIS TEAM MEMBERS
CCIS Project Leads
Lauren Cardoso, Sanouri Ursprung, Beth Beatriz, Glory Song, Caroline Stack, Kathleen Fitzsimmons, Emily Sparer-Fine,
Nicole Daniels, Lisa Bandoian, Heather Nelson, Amy Flynn, Lisa Arsenault
CCIS Analytic Team CCIS Data to Action Workgroup
Beth Beatriz, Glory Song, Caroline Stack, Kathleen Fitzsimmons, Emily Jessica del Rosario, Kim Etingoff, Lisa Bandoian,
Sparer-Fine, Matthew Tumpney, Rebecca Han, Lauren Larochelle, Andrea Mooney, Ben Kingston, Dawn Fukuda
Arielle Coq, Anne Marie Matteucci, Lauren Fogharty, Vera Mouradian,
Melody Kingsley, Ta Wei Lin, Anna Agan, Justine Egan, Allison Guarino,
Elizabeth Showalter, Priyokti Rana, Lauren Cardoso, Sanouri Ursprung
CCIS Steering Committee CCIS Data Dissemination Workgroup
Lauren Cardoso, Sanouri Ursprung, Beth Beatriz, Abbie Averbach, Beth Beatriz, Glory Song, Emily Sparer-
Ruth Blodgett, Ben Wood, Sabrina Selk Fine, Ta Wei Lin, Vera Mouradian
16CCIS COMMUNITY PARTNERS
Many groups that were critical in the success of this effort and gave important input on the development and
deployment of the survey:
● Academic Public Health Volunteer Corps and their ● The 84 Coalitions, including the Lawrence/Methuen
work with local boards of health and on social Coalition
media ● Boys and Girls Clubs, including those in Fitchburg and
● Mass in Motion programs, including Springfield, Leominster and the Metro South area
Malden, and Chelsea ● Chinatown Neighborhood Association
● Cambodian Mutual Assistance ● Father Bill’s
● The Mashpee Wampanoag Tribe ● UTEC
● The Immigrants’ Assistance Center, Inc ● MassCOSH
● Families for Justice as Healing ● Stavros Center for Independent Living
● City of Lawrence Mayor’s Health Task Force ● Greater Springfield Senior Services
17OVERVIEW
1. Purpose and Approach of the Covid-19 Community Impact Survey (CCIS)
2. Preliminary Findings
○ Ability to mitigate individual risk of infection
○ Access to Testing
○ Access to Healthcare
○ Impact on Basic Needs
3. Converting these Data to Action with our partners
4. Appendix
18PURPOSE AND APPROACH
19BACKGROUND
Context
The pandemic is exacerbating pre-existing public health concerns and creating new health
crises to address. Even people who have not become sick with COVID-19 are managing stress,
uncertainty, and isolation during this challenging time. DPH and its partners need real time data
to prioritize resources and inform policy actions.
Goal
DPH conducted a survey to understand the specific needs of populations that have been
disproportionately impacted by the pandemic, including its social and economic impacts.
Actions
DPH will use and share these data to prioritize our pandemic response and to create new,
collaborative solutions with community partners.
20VACCINE DEPLOYMENT: How should we
prioritize certain occupations,
TESTING: How can we make
populations, geographies, etc.? (eg. RESUMING DELAYED CARE - What acute non-
access and awareness more
Who can’t work from home? Who can’t COVID health concerns are increasing? And
equitable? Who doesn’t know
socially distance at work?) for whom? (eg. Where do we need to lower
where/when to go? Who is still
concerned about cost? barriers or communicate better to encourage
folks not to delay care?)
These data could inform...
PSA/COMMUNICATION - Who
MENTAL HEALTH SUPPORTS - still “doesn’t know” info we’ve
What should we deploy to meet pushed out and how can we
acute needs? better reach them?
RISK MITIGATION – Where can YOUTH/SCHOOL SERVICES- What impacts are youth ECONOMIC SUPPORT - Who is facing
we eliminate unfair experiencing beyond educational delays (e.g., the biggest disparities in meeting basic
environmental barriers to social healthcare access, testing for teens in frontline needs? How does this intersect with
distancing? occupations (e.g., grocery), protections for those areas like PPE, testing, etc.?
that work directly with youth)? 21PERCEPTIONS &
EXPERIENCES OF COVID-19 BASIC NEEDS
DEMOGRAPHICS Concern, access to testing,
Access to goods, services,
Age, geography, gender, race, ethnicity, ability to social distance information, social safety nets
sexual orientation, disability status,
education, income
CCIS DOMAINS
ACCESS TO HEALTHCARE
SAFETY
Healthcare needs, types of
Intimate partner violence, care, barriers to care
discrimination
SUBSTANCE USE EMPLOYMENT
MENTAL HEALTH
Change in use, resource needs Changes in employment, barriers to
Trauma, other mental health
employment, ability to work from
challenges, resource needs
home, access to protections
22OVERVIEW OF A PPROACH
● Conducted an online survey between Sept. and Nov. 2020
● Available in 11 languages
● Employed a sampling strategy that ensured we reach key populations
● Weighted results to the state average
● Open ended questions captured previously unknown needs and barriers
● Recruited participants via network of community-based organizations (CBOs)
23We intentionally worked to reach these Priority Populations:
● People of color
● LGBTQ+ individuals
● People with disabilities
● Essential workers
● People experiencing housing instability
● Older adults
● Individuals living in areas hardest hit by COVID-19
24
Preliminary data - 1.7.21 - Not for external distributionRecruitment efforts were overwhelmingly successful
● Over 33,000 adult respondents in the final sample
● More respondents from western and central MA, than in the entire statewide samples of past
surveillance surveys* (eg. BRFSS).
● Compared to past surveillance surveys, CCIS priority population samples reached:
○ 10x as many Alaska Native/Native Americans
○ 10x as many LGBTQ respondents
○ 5x as many residents who speak languages other than English
○ 5x as many Hispanic residents
○ 5x as many Asian residents
○ Over twice as many respondents in other populations including the deaf/hard of hearing and
Black community
• Additional Focus Groups were conducted with the Deaf/Hard of Hearing community
25
*example comparison rates were calculated in comparison to the 2019 Behavioral Risk Factor Surveillance Survey (BRFSS) sample sizesPRELIMINARY RESULTS
Ability to mitigate
Access to testing Access to healthcare Social Determinants of
individual risk of infection
Health
26ABILITY TO MITIGATE
INDIVIDUAL RISK OF
INFECTION
2 7RISK MITIGATION
RISK M ITIGATION
Individuals who are the most worried about becoming infected with COVID-19 (see next slide), are also the least able to
maintain 6 ft. distance from others especially when in retail/grocery stores and at work.
Those who were not able to socially distance were 1.5 times as
likely to be “very” worried about getting COVID -19 Among those who were not able to keep 6 feet distance most
respondents experienced at least 2 of the following top reasons
why:
● “The place where I shop or buy groceries is crowded” (62%)
● “In order to do my work, I need to be physically close to
others” (42%)
● “My workplace is crowded” (23%)
● “The streets where I live are crowded” (20%)
28RISK MITIGATION
Populations most likely to say they
are “very worried” about becoming
infected with COVID-19 include:
• Transgender respondents
• Those who are female or
questioning their gender
identity
• LGBQ+ respondents
• Blind/hard of seeing people
• People with physical or mental
disabilities
• Respondents with lower
income and/or lower
educational attainment
• Persons of color
• Those who speak a language
other than English
29
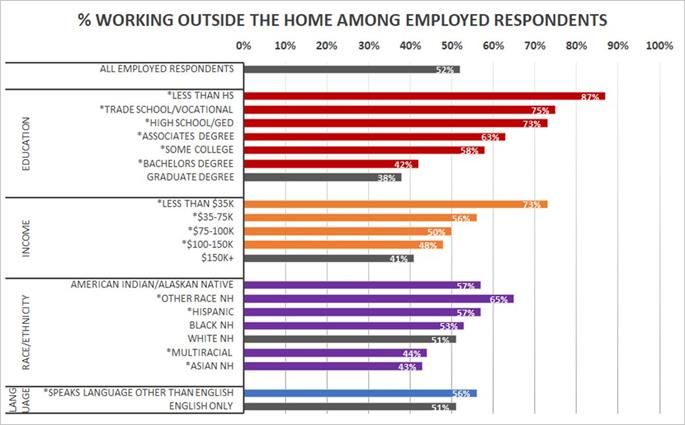
* denotes rate is significantly different compared to the reference groupOver half of those who could not socially distance listed work-related factors as a primary reason.
Some populations were much more likely to work outside of the home and face greater risk of exposure.
Half of all employed
respondents worked a job
outside the home, facing
increased risk of exposure.
Workers in jobs outside the
home tended to have lower
educational attainment, lower
wages, be people of color, and
speak languages other than
English.
30
* denotes rate is significantly different compared to the reference groupRespondents in certain industry groups were much more likely to work outside of the home and thus face
greater risk of exposure.
The percentage varied by
industry ranging from 94% in
Retail: Grocery to 15% in
Education: Colleges and
Universities
Even within certain industries,
the percentage who worked
outside the home varied by
subgroup. For example in
healthcare:
• 88% in Nursing and
Residential Care Facilities
• 67% in Hospitals
• 52% in Ambulatory Services
PRELIMINARY FINDINGS – Statistical
significance testing forthcoming.
Notes: "Retail: Grocery" = CIC 4970 Grocery Stores, 4980 Specialty Food Stores, 5090 Gas Stations [includes those with convenient stores]; "Other Industries" = Mining; 31
Agriculture, Forestry, Fishing and Hunting; Utilities; Wholesale Trade; Management of Companies and Enterprises; MilitaryRISK MITIGATION
Respondents working outside the home in the following industries* were less likely to have employer provided/implemented COVID-19 precautions
such as personal protective equipment, COVID safety training, and implementation of social distancing at work :
• Food Services • Administrative Support and Waste Management Services
• Construction • Arts, Entertainment, and Recreation (e.g. gyms)
• Transportation and Warehousing
1 in 4 respondents worked in 1 in 3 respondents worked in 1 in 2 respondents worked in places
places that did not provide places that did not implement that did not provide additional
PPE. social distancing. health & safety training.
Identifying infections early through testing and lowering barriers to staying home by providing employees with
adequate paid sick leave is essential to mitigating the spread of COVID.
Adults who worked outside the home were more than Access to sick leave varied widely across industries,
two times as likely to report testing positive compared ranging from 37% in food services to 92% in public
to those who worked from home. administration.
32
*PRELIMINARY FINDINGS – Statistical significance testing forthcoming. Full industry breakdowns are provided in the appendix.RISK MITIGATION
The behavior of individuals is one of the most powerful tools we have to stop the spread of COVID-19.
Our behaviors are influenced by:
2. Belief that the behavior is 3. Factors that make the behavior
1. Knowledge about what to do.
important. easier or harder to engage in.
33TESTING ACCESS
34TESTING ACCESS
Among all respondents, 44% reported ever having been tested for COVID.
Key populations prioritized through Massachusetts testing initiatives like Stop the Spread program
reported some of the highest rates of testing, suggesting that these efforts have been successful.
Priority Population % Reported Ever Been
Tested
Suffolk County residents 59%
Essex County residents 47%
Middlesex County residents 47%
Black, Non-Hispanic 52%
residents
Hispanic residents 51%
Residents who speak
Preliminary data - 1.7.21 - Not for external distribution 47% 35TESTING ACCESS
Besides not having symptoms, the top reasons for not getting tested were:
TOP REASONS FOR NOT BEING TESTED
1. Didn't meet testing criteria when had symptoms
2.
2. Didn't
Didn'tknow
knowwhere
wheretotogo
go
3. Lack of perceived exposure
4. Only had mild symptoms
5. Test was too expensive
6. Test wasn’t available where I wanted to get tested
The STS program is currently addressing some of these top barriers through expansion of
sites providing free testing regardless of symptoms/exposure.
Preliminary data - 1.7.21 - Not for external distribution 36TESTING ACCESS
The following groups were more likely to report
not getting tested because they didn’t know
where to go:
● Transgender Respondents
● Males and Non-binary respondents and
respondents questioning their gender
identity
● LGBQ+ people
● Respondents with disabilities
● Am. Indian/Alaska Natives, Multiracial
Respondents, and Asians
● Respondents with lower income
● Respondents who speak languages other
than English
...suggesting that current communication and
dissemination channels may not be as effective
at reaching these populations
* denotes rate is significantly different compared to the reference group
Preliminary data - 1.7.21 - Not for external distribution 37HEALTH CARE ACCESS &
DELAYS
38HEALTH CARE ACCESS & DELAYS
The pandemic has substantially impacted normal healthcare operations and put stress on healthcare capacity.
4 of 5 respondents who 60% of those who needed care However, 1 of 5 respondents are
needed medical care since July received telehealth care via phone or missing either critical urgent care
2020 have gotten the care video, suggesting that the rapid scale- or essential routine care. Some
that they needed. up of telehealth has been crucial. residents have missed both.
39HEALTH CARE ACCESS & DELAYS
Delayed care (both urgent and routine)
is over 1.5X to 2X as high among
subgroups that already face many
healthcare barriers such as cost,
transportation, English proficiency, and
discrimination:
• Respondents with questioning,
undecided, non-binary gender
• Transgender respondents
• LGBQ+ respondents
• Respondents with disabilities
• Am. Indian/Alaska Natives, Black, and
Multiracial respondents
• Younger respondents
• Those with lower incomes
* denotes rate is significantly different compared to the reference group 40DELAY IN EMERGENCY OR URGENT CARE
Delays in seeking or receiving emergency care for acute The pandemic has drastically disrupted healthcare capacity
conditions like pain, chronic disease flare-ups, or severe mental even for people who normally face few barriers to care.
health can lead to serious health consequences…
However, access concerns were still felt most acutely by
...yet nearly 1 in 3 respondents who had delayed care reported populations who already faced healthcare barriers prior to the
having an acute condition delayed. pandemic, and have the highest rates of delayed urgent care
now.
TOP 5 ACUTE CONDITIONS DELAYED TOP 5 REASONS FOR DELAYED URGENT CARE
1. Pain (e.g. chest pain, stomach pain, headaches, back pain) 1. My appointment was cancelled/delayed
2. Chronic disease flare-ups (e.g. diabetes, uncontrolled asthma, 2. The office was closed, told no appointments available, or no
cardiovascular conditions, GI, lupus) one responded to my phone calls
3. Severe mental health (e.g. severe stress, depression, 3. I was worried about getting COVID-19 from in-person care
nervousness, anxiety)
4. I was worried I could not afford the care or my insurance didn't
4. Oral or dental pain cover it
5. Non work-related Injury 5. I didn’t have time or had caretaking responsibilitiesDELAY IN ESSENTIAL AMBULATORY CARE
Essential ambulatory care services are also being delayed, and among those who need them the most.
Nearly who reported delaying regular care said they experienced delays in services like
OB/GYN care and sexual and reproductive health care (e,g. birth control or STI).
Nearly with 1 or more chronic conditions (e.g. asthma, diabetes, obesity) who
reported delaying regular care said they had delays for chronic disease management services.
Limited healthcare capacity was the #1 reason people could not access ambulatory care.
(e.g. office or clinic is closed or told no appointments available, certain services or procedures were being limited
and not available, appointment was cancelled, delayed or the wait was too long, etc.)
42DELAY IN ESSENTIAL AMBULATORY CARE
Although 60% of respondents who needed care were able to get care via telehealth (by phone or video),
technology-related barriers remain a challenge for certain populations.
“I didn’t have good enough phone or These populations were 2X to 4X as likely to have
internet connection” telehealth-related barriers:
“I didn’t have a phone, tablet, ● Less than HS education or $35K income
or computer”
● American Indian/Alaska Natives, Hispanic, and multi-
“I didn’t have a private place for a racial respondents
phone call or video chat” ● Residents of Franklin county
Preliminary data - 1.7.21 - Not for external distribution 43DELAY IN MENTAL HEALTH CARE
The respondents with 15+ days of poor mental health are also the most
likely to experience delays in both routine and urgent mental health care.
Delayed Care by Number of Poor Mental Health Days in the Past 30 Days TOP 5 REASONS FOR DELAYED CARE BY
All Respondents
RESPONDENTS WITH POOR MENTAL HEALTH
0 Days 1. My appointment was cancelled/delayed
40%
1-14 Days 37%*
(59%)
15+ Days
* Subgroup is
2. I was worried about getting COVID-19 from
30% 28%*
significantly different 27% in-person care (27%)
compared to people 24%*
with 0 poor mental
health days 3. I was worried I could not afford the care or
20% 18% 17% my insurance didn't cover it (8%)
16%*
12%* 4. I did not have a private place for a phone
10%
10%
9%*
call or video chat (7%)
2%
3% 5. I did not have safe transportation to get to
0% my appointment (7%)
Didn't get the care needed Delayed ROUTINE mental health care Delayed URGENT mental health care
44
Preliminary data - 1.7.21 - Not for external distributionREQUESTED MENTAL HEALTH RESOURCES
Respondents with 15+ days of poor mental health are seeking health resources at higher rates
compared to those who experienced “0” days or “1-14” days of poor mental health.
Resources Requested by Number of Poor Mental Health Days in the Past 30 Days
30% TOP 5 RESOURCES REQUESTED by
respondents with poor mental health
26%*
25% All Respondents
0 Days
1. Talking to a health professional over video chat
21%*
20%* 1-14 Days
20%*
20% 19%*
15+ Days
16%* 16%*
2. Meeting in person with a health professional
16%
15% 14% 15%* (individual and/or group therapy)
13% 13%*
12% 12%
11%* 11%* * Subgroup is significantly 3. Information on how to see a therapist
9%* different compared to people
10% 9%
with 0 poor mental health days
6%
5% 4% 4% 4%
4. Talking to a health professional on the phone
3% 3%*
3%
1% 2%
0% 1%* 1% 1%
0%
0%
Talking to a health Meeting in person Information on how Talking to a health Using an application Going to a support Suicide prevention Barriers to accessing
5. Using an application on a mobile phone or tablet
professional over
video chat
with a health
professional
to see a therapist professional on the on a mobile phone group using online and crisis resources healthcare (e.g. cost
phone or tablet for mental platform (e.g. Zoom) of services, limited
for mental health support
(individual and/or health support availability of
group therapy) therapists)
45
Preliminary data - 1.7.21 - Not for external distributionMENTAL HEALTH STATUS
1 in 3 of MA adults* reported 15+ days of poor mental health.
All demographic groups in MA are experiencing increases in poor mental health.
MA subpopulations most likely to report 15 or more days of poor
mental health in the past 30 days The percentage of adults who reported poor mental health on
0% 10% 20% 30% 40% 50% 60% 70% 80% this survey is 3X higher than the 11% of adults who reported
*MULTIRACIAL 49% poor mental health on the 2019 MA BRFSS
ETHNICITY
AMERICAN INDIAN/ALASKA NATIVE 38%
RACE/
*HISPANIC/LATINX 35%
In this survey, the following groups experienced the highest
WHITE, NH 33%
rates of poor mental health:
*25-34 43%
AGE GROUP
*35-44 41%
● Multiracial, American Indian/Alaska Natives respondents
*45-64 31%
65+ 20%
*TRANSGENDER 62% ● Transgender respondents, Non-binary respondents, and
GENDER IDENTITY
respondents questioning their gender identity
NOT TRANSGENDER 33%
● LGBQ+ respondents
*QUESTIONING, UNDECIDED, NON-BINARY 68%
*FEMALE 34%
● Respondents with disabilities
MALE 26%
● Respondents with lower income
*QUEER 59%
ORIENTATION
*QUESTIONING OR NOT SURE 58%
SEXUAL
*BISEXUAL 55%
*GAY OR LESBIAN 41%
Similar patterns within and across demographic groups are seen
STRAIGHT 31%
among those who experienced 3+ PTSD-like reactions to
*BLIND OR HARD OF SEEING 49%
NOT BLIND 33%
DISABILITY
*PHYSICAL OR MENTAL DISABILITY 55% COVID-19 in the past 30 days
NO PHYSICAL OR MENTAL DISABILITY 30%
*LESS THAN $35K
COUNTY INCOME
42%
GREATER THAN $150K 26%
HAMPSHIRE COUNTY 38%
HAMPDEN COUNTY 37%
BERKSHIRE COUNTY 36%
FRANKLIN COUNTY 35%
46
Preliminary data - 1.7.21 - Not for external distributionSOCIAL DETERMINANTS
OF HEALTH
4 7DETERMINANTS OF HEALTH: EXPENSES
A regular income is critical in order to afford essential medication, food, and health services, but some populations in the
commonwealth have been harder hit by employment-related changes than others. Even before the pandemic, these same
populations also had less financial reserve as a safety net.
EXPENSES/BILLS RESPONDENTS WERE MOST CONCERNED ABOUT % of
PAYING Respondents
1. Housing (rent, mortgage, property taxes, condo fees, housing 28%
insurance)
2. Utilities (cable, cell, electricity, water, gas, heating) 24%
3. Debt (credit card, student loan, bank fees) 21%
4. Vehicle (lease, car loan payment, car insurance) 15%
5. Insurance (health, disability, life) 11%
Groups experiencing the greatest economic hardship:
• Low income & education • Blind/ hard of seeing
• Hispanics and Blacks • Mental or physical disability
• Speak languages other than • Residents of Hampden, Suffolk,
English Berkshire & Dukes
48
PRELIMINARY FINDINGS – Result may be adjusted after statistical significance testingD E T E R M I NRA INST K
S M
O FI THI EGAAL T
THI O: NC H I L D C A R E
Nearly 1 in 3 of employed adults who
reduced their hours or took leave did so,
at least in part, to take care of children.
Nearly 1 in 5 who lost their jobs cited
needing to take care of children as a
reason.
Females were twice as likely as males,
and Hispanic adults almost twice as
likely as White Non-Hispanic adults to
change the status or nature of their
employment to take care of children.
49
* denotes rate is significantly different compared to the reference groupDETERMINANTS OF HEALTH: FOOD
Food insecurity is directly associated with mortality from obesity, hypertension, diabetes, and heart
disease, which are all also risk factors for more severe COVID-19 illness and mortality.
Economic hardship brought on or exacerbated by the pandemic means that people may not be able to
afford purchasing enough food or healthy food for themselves and their family. The pandemic has also
made accessing groceries more challenging than before, especially among those without safe
transportation and those more vulnerable to COVID-19.
More than 1 in 4 (28%) respondents worried about getting food or groceries in the coming weeks.
However, some populations and communities reported much higher rates:
DISABILITY % ETHNICITY % ETHNICITY %
Blind or hard of seeing 53% Salvadoran 62% Haitian 48%
Physical or mental disability 46% Dominican 62% Vietnamese 48%
SES % Colombian 53% Caribbean Islander 46%
Less than a HS education 56% Cape Verdean 51% Am. Indian/Alaska Native 45%
Income less than $35K 48% Puerto Rican 49%
50DETERMINANTS OF HEALTH: BROADBAND
Fast, stable and affordable internet access has become more critical than ever in connecting people to telehealth, work,
remote learning, and essential goods and services.
Yet, accessing broadband remains a challenge for many residents. Barriers to access can include lack of broadband
infrastructure in many rural areas and lack of affordable options for many urban families. Furthermore, public spaces like
offices, schools, and libraries that once served as many residents' only connection to accessing internet are currently
shut down.
1 in 7 (13%) respondents worried about getting internet in the coming weeks.
However, some populations and communities were more likely to be concerned:
DISABILITY % ETHNICITY % ETHNICITY %
Blind or hard of seeing 27% Dominican 28% Cape Verdean 24%
Physical or mental disability 23% Puerto Rican 26% Hispanic 24%
SES % Am. Indian/Alaska Native 25% Salvadoran 23%
Less than a HS education 27% Caribbean Islander 25% Vietnamese 23%
Income less than $35K 22% Columbian 25% Haitian 20%
51DETERMINANTS OF HEALTH: HOUSING STABILITY
1 in 5 respondents worried that they would have to move out of their home soon.
Among them:
• Nearly 30% said they would need a safe place to stay.
• 25% said having information about their rights as renters/tenants would help.
• The most common reason was if they or a family member got COVID-19.
52DATA TO ACTION
5 3ENGAGEMENT - OVERVIEW
We are getting input from both internal and external stakeholders in order to identify
changes needed now and in future efforts.
• Internal = Bureaus, Offices, work groups
• External = engaged partners (i.e., HEAG,
community partners)
Share findings and ask: Focus on priority populations and geographies
● How does this play out for you? with racial justice reframing:
● How to overcome barriers? ● Who benefits?
● Actions to take now? ● Who decides? Who influences?
● Who could be harmed? How to mitigate?
54ENGAGEMENT – EXAMPLE
Key Finding: Current communication and dissemination channels may not be equally effective at
reaching all populations (eg. Transgender, LGBQ+, Males, those with disabilities , Am. Indian/Alaska
Natives, Multiracial, Asians, low income, and those who speak languages other than English).
…suggesting adjusted media strategies, translations, and tailored community engagement should
be considered for vaccine related communications to better reach these communities.
Heard: COVID-19 vaccine map on mass.gov is Heard: Not all Indigenous people are
not accessible, need a table/grid with same represented in this work, would prefer that DPH
information bring what they are planning to address needs
Action Taken: Word and Excel document to Indigenous people to provide feedback and
available for download, Word document could make suggestions
be hard to read, working to improve it now Action Taken: Engage Tribal Partners Group, to
discuss how best to do this (added to 2/16
meeting agenda)
55QUESTIONS & FEEDBACK?
56APPENDIX
N o te: r esults a r e o n ly w eighted t o t h e st ate a v erage, a n d a s su ch sh ould b e
i n t erpreted w i t h c a u t i on w h en c o m parin g a c r oss s m al l er g e o g raphi es o r s p e ci al
p o pulations
57PERCEPTIONS &
EXPERIENCES OF COVID-19
DEMOGRAPHICS BASIC NEEDS
Concern, access to testing,
Age, geography, gender, race, ethnicity, ability to social distance Access to goods, services,
sexual orientation, disability status, information, social safety nets
education, income
CCIS DOMAINS
ACCESS TO HEALTHCARE
SAFETY
Healthcare needs, types of
Intimate partner violence, care, barriers to care
discrimination
SUBSTANCE USE EMPLOYMENT
MENTAL HEALTH
Change in use, resource needs Changes in employment, barriers to
Trauma, other mental health
employment, ability to work from
challenges, resource needs
home, access to protections
58Survey Questions
Demographics
What city or town do you live in? Were you pregnant during the COVID-19 outbreak or did you give
birth since February 2020?
How many people - adults and children - currently live with you, When did you give birth?
including yourself?
How many people who are over 60 years old currently live with you, After the start of the COVID-19 outbreak, did your birth plans
including yourself? change?
Are you a caretaker of an adult(s) with special needs in your What is the highest grade or year of school you have finished?
household?
Are you a parent/guardian of a child or youth with special health care In 2019, what was your total annual household income before taxes?
needs?
Have you ever been sentenced to stay overnight or longer in any type
Please select all that apply to you: of corrections institution? Examples include a jail or prison.
• I am deaf or hard of hearing.
• I am blind or I have trouble seeing even when I am wearing What is your sexual orientation?
glasses.
• I have trouble concentrating, remembering, or making decisions What is your current gender identity?
because of a physical, mental, or emotional condition.
• I have trouble walking or climbing stairs. Are you transgender or of transgender experience?
• I have trouble getting dressed or taking a bath or shower.
• I have difficulty doing errands alone such as visiting a doctor's Are you Hispanic or Latino?
office or shopping.
• None of the above apply to me. 59Survey Questions
Demographics Perceptions & Experiences of COVID-19
What is your race? Select all that apply. Do you agree or disagree with the following
statements? My community is receiving adequate support to:
What is your ethnicity? Select all that apply. • Prevent the spread of COVID-19
• Protect workers from COVID-19
(For English Survey) Do you speak language(s) other than English at • Ensure medical facilities have the capacity to treat everyone who is
home? sick or injured?
• Help people who have lost income
Which language(s) do you speak at home? • Help businesses recover
Have you had fever and/or cough or shortness of breath and/or
(For Non-English Surveys) How well do you speak English?
muscle aches or loss of sense of taste or smell in the last 30 days?
Did you ever get tested for COVID-19?
Perceptions & Experiences of COVID-19
How worried are you about getting infected with COVID-19 in Why didn't you get tested? Select all that apply.
Massachusetts?
Have you or anyone you know tested positive for COVID-19? Select
Please select the two sources that you go to for the most reliable and all that apply.
up-to-date information about COVID-19.
Has someone close to you died from COVID-19?
When you are outside of the home are you able to keep 6 feet
between yourself and others?
Why not? Check all that apply
60Survey Questions
Healthcare Access Basic Needs
Do you currently have any of the following health conditions? Select all Which of the following basic needs are you worried about getting for
that apply. you and your family? This could be now or in the next couple of
weeks. Select all that apply.
Since July 1, 2020, what has been your experience with trying to see a
• Household Items
doctor, counselor or another medical professional? Select all that
• Healthcare and medication
apply.
• Technology
For the care you did not get, why did you want to see a doctor or • Childcare supplies
counselor at that time? Select all that apply. • Other
What type(s) of regular care or check-up did you need at that time? Which of these would be helpful to you right now? Select all that
Select all that apply. apply. (Food, help getting benefits, knowledge about rights,
accessible services – translation, disability, childcare, other)
What condition(s) did you need emergency or urgent care for at the
time? Select all that apply Which types of expenses or bills are you most worried about paying
in the next few weeks?
Why were you not able to get care at the time? Select all that apply.
Are you worried about any of these that will require you to move out
What type(s) of health insurance do you currently have? Select all that of where you live in the next few months? Select all that apply
apply. Have you applied to any of these financial supports since the
Has your health insurance changed since the COVID-19 outbreak? beginning of the COVID-19 outbreak? What is the status of your
application?
61Survey Questions
Mental Health Substance Use
Now thinking about your mental health, which includes stress, During the past 30 days, have you used any of the following
depression, and problems with emotions, on how many days during products Select all that apply.
the past 30 days was your mental health not good?
Compared to before the COVID-19 outbreak (February 2020), how
In the past month, have you had three or more of the following often are you using these products now?
reactions to things you’ve seen, heard, or experienced related to the
Which of the following resources would be most helpful to you right
COVID-19 outbreak:
now? Select all that apply.
• Had nightmares or thought about it when you did not want to?
• Tried not to think about it or went out of your way to avoid
situations that reminded you of it? Employment/Income
• Been constantly on guard, watchful, or easily startled?
• Felt numb or detached from people, activities, or your Which of the following best describes your current work situation?
surroundings? (Employed, Retired, unemployed, furloughed, etc.)
• Felt guilty or unable to stop blaming yourself or others for it or any
problems it may have caused? What kind of work do/did you do? For example, registered nurse,
janitor, cashier, auto mechanic. If you have more than one job, please
Which of these resources would be most helpful to you right now to answer for your primary job.
help you with your mental health and well-being? Select all that apply.
What kind of business do you work in? For example, hospital,
elementary school, manufacturing, restaurant. If you have more than
one job, please answer for your primary job.
62Survey Questions
Employment/Income Safety
Has your employer given you any of the following to protect you Since COVID-19 began (March 10, 2020), has someone you were
against COVID-19? Select all that apply. dating or married to physically hurt you? (i.e. being shoved, slapped,
If you are currently working, do you have paid sick leave you can use hit, kicked, punched, strangled, forced into sexual activity, or anything
through your employer? that could have caused an injury)
Was your employment status or the nature of your work changed in Since COVID-19 began (March 10, 2020), has someone you were
any of the following ways due to COVID-19? Select all that apply. dating or married to done any of the following: monitored your cell
phone, called or texted you a lot to ask where you were, stopped you
Why did your employment status or the nature of your work change? from doing things with friends, been angry if you were talking to
Select all that apply someone else, or prevented you from going to school or work
(including remotely)?
For which of the following topics would online support be most
helpful to you or someone you know right now? Please select all that
apply:
Discrimination can refer to harmful words and behaviors aimed at you
because of your race or ethnicity. Since the COVID-19 outbreak
began (March 10, 2020), have you experienced any form of
discrimination because of your race or ethnicity?
In what way(s) did you experience discrimination?
63Recruitment among priority populations was unprecedented
2020 CCIS Final Magnitude of
Priority Populations 2018 MA BRFSS
Sample Difference
Overall sample 6,669 33,948 5X
Race/Ethnicity
Hispanic 522 2,506 5X
Black NH 365 1,162 3X
Asian NH 248 1,188 5X
Amer. Ind/Alaska Nat 35 351 10X
Disability Status
Deaf/Hard of hearing 427 922 2X
Blind/Hard to see 258 236
On par
This number ofLesbian, Gay,
responses willBisexual + to conduct
enable us 359the critical subanalysis3,931 10X
needed to understand the specific needs and experiences of
these groups and to prioritize our deployment of resources to address them. 64
Non-English Speakers 158 (in 2 languages) 829 (in 8 languages) 5XRecruitment efforts were overwhelmingly successful
For example, more people responded from western and central MA alone, than in the entire 2019 BRFSS statewide sample.
65Demographics Freq. Percent
Asexual 646 1.92
Demographics of the sample Bisexual 1,252 3.73
Gay/Lesbian 1,352 4.03
Demographics Freq. Percent Sexual Orientation Heterosexual 29,231 84.08ABILITY TO MITIGATE
INDIVIDUAL RISK OF
INFECTION
6 7% “Very Worried” about Being Infected with COVID-19
Demographics Frequency Weighted % Demographics Frequency Weighted % Demographics Frequency Weighted %
Transgender Transgender 97 43% Barnstable 189 24%
Overall 9241 30%
Experience Not Transgender 8801 30% Berkshire 155 25%
American% Not Able to Keep 6 ft. Distance when Outside the Home
Demographics Frequency Weighted % Demographics Frequency Weighted % Demographics Frequency Weighted %
Transgender Transgender 54 22% Barnstable 80 11%
Overall 3559 11% Experience Not Transgender 3358 11% Berkshire 59 9%
American Indian/Alaska% Working Outside of the Home among Employed Residents
Weighted
Demographics Frequency Demographics Frequency Weighted %
%
Transgender Transgender 46 42%
Overall 8786 52%
Experience Not Transgender 8419 52%
American Indian/AlaskaRISK MITIGATION
EMPLOYER PROVIDED PPE
Overall, 76% of adults working
outside the home reported that
their employer provided PPE.
Across industry groups, the
percentage ranged from 50% in
Administrative Support and
Waste Management to 91% in
Healthcare: Hospitals.
Notes: 1) "Retail: Grocery" includes CIC 4970 Grocery
Stores, 4980 Specialty Food Stores, 5090 Gas Stations
[includes those with convenient stores]; 2) Other
Industries includes Mining; Agriculture, Forestry, Fishing
and Hunting; Utilities; Wholesale Trade; Management of
Companies and Enterprises; Military; 3) Estimates were
suppressed for Education: All Other; Accommodation
due to insufficient data;4)Preliminary findings - statistical
significance testing forthcoming.
71E M P L O Y E RR I ISMK PMLI E
T IM
G AETN
I OTNE D S O C I A L
DISTANCING
Overall, 66% of adults working
outside the home reported that
their employer implement social
distancing at work.
Across industry groups, the
percentage ranged from 52% in
Construction to 79% in
Education: Colleges and
Universities.
Notes: 1) "Retail: Grocery" includes CIC 4970 Grocery Stores,
4980 Specialty Food Stores, 5090 Gas Stations [includes
those with convenient stores]; 2) Other Industries includes
Mining; Agriculture, Forestry, Fishing and Hunting; Utilities;
Wholesale Trade; Management of Companies and Enterprises;
Military; 3) Estimates were suppressed for Education: All Other;
Accommodation due to insufficient data; 4)Preliminary findings -
statistical significance testing forthcoming. 72E M P L O Y E RR IPSRK OMVI TI D
I GEA D
T I OAND D I T I O N A L
HEALTH AND SAFETY TRAINING
Overall, 44% of adults working
outside the home reported that
their employer provided additional
health and safety training.
Across industry groups, the
percentage ranged from 22% in
Construction to 62% in
Healthcare: Nursing and
Residential Care Facilities.
Notes: 1) "Retail: Grocery" includes CIC 4970 Grocery Stores,
4980 Specialty Food Stores, 5090 Gas Stations [includes
those with convenient stores]; 2) Other Industries includes
Mining; Agriculture, Forestry, Fishing and Hunting; Utilities;
Wholesale Trade; Management of Companies and Enterprises;
Military; 3) Estimates were suppressed for Education: All Other;
Accommodation due to insufficient data; 4)Preliminary findings -
statistical significance testing forthcoming.
73RISK MITIGATION
PAID SICK LEAVE
Overall, 80% of adults working
outside the home reported they
had paid sick leave.
Across industry groups, the
percentage ranged from 37% in
Food Services to 92% in Public
Administration.
Notes: 1) "Retail: Grocery" includes CIC 4970 Grocery Stores,
4980 Specialty Food Stores, 5090 Gas Stations [includes
those with convenient stores]; 2) Other Industries includes
Mining; Agriculture, Forestry, Fishing and Hunting; Utilities;
Wholesale Trade; Management of Companies and Enterprises;
Military; 3) Estimates were suppressed for Education: All Other;
Accommodation due to insufficient data; 4)Preliminary findings -
statistical significance testing forthcoming.
74TESTING ACCESS
75% Ever been Tested for COVID-19
Demographics Frequency Weighted % Demographics Frequency Weighted % Demographics Frequency Weighted %
Transgender Transgender 133 57% Barnstable 264 37%
Overall 14319 44%
Experience Not Transgender 13731 44% Berkshire 227 34%
AmericanHEALTH CARE ACCESS &
DELAYS
77% Who have not gotten the medical care that they needed since July 2020
Demographics Frequency Weighted % Demographics Frequency Weighted % Demographics Frequency Weighted %
Transgender Transgender 64 34% Barnstable 128 21%
Overall 4326 17%
Experience Not Transgender 4064 17% Berkshire 72 12%
American% 15 or more Poor Mental Health Days in past 30 Days
Demographics Frequency Weighted % Demographics Frequency Weighted % Demographics Frequency Weighted %
Transgender Transgender 134 62% Barnstable 199 29%
Overall 8973 33%
Experience Not Transgender 8480 33% Berkshire 199 36%
AmericanDETERMINANTS OF HEALTH
8 0% Worried about paying for 1 or more types* of expense or bills in the coming few weeks
Demographics Frequency Weighted % Demographics Frequency Weighted % Demographics Frequency Weighted %
Transgender Transgender 131 61% Barnstable 151 40%
Overall 11679 44% Experience Not Transgender 11044 43% Berkshire 174 52%
American Indian/Alaska% Worried about getting food or groceries in the coming weeks
Demographics Frequency Weighted % Demographics Frequency Weighted % Demographics Frequency Weighted %
Transgender Transgender 68 37% Barnstable 164 30%
Overall 6784 28%
Experience Not Transgender 6405 27% Berkshire 165 32%
American% Worried about getting face masks in the coming weeks
Demographics Frequency Weighted % Demographics Frequency Weighted % Demographics Frequency Weighted %
Transgender Transgender 36 16% Barnstable 79 14%
Overall 3787 14%
Experience Not Transgender 3557 14% Berkshire 76 13%
American% Worried about getting medication in the coming weeks
Demographics Frequency Weighted % Demographics Frequency Weighted % Demographics Frequency Weighted %
Transgender Transgender 61 30% Barnstable 80 12%
Overall 3535 14%
Experience Not Transgender 3308 13% Berkshire 90 17%
American% Worried about getting broadband(internet) in the coming weeks
Demographics Frequency Weighted % Demographics Frequency Weighted % Demographics Frequency Weighted %
Transgender Transgender 41 18% Barnstable 81 12%
Overall 3434 13%
Experience Not Transgender 3217 13% Berkshire 113 21%
AmericanNext Meeting: March 10, 2021
You can also read