RESPONSE - Clean Energy BC
←
→
Page content transcription
If your browser does not render page correctly, please read the page content below
Clean Energy Association of B.C.

                 RESPONSE

                       to

     ZAPPED ALLEGATION OF
  OVERSPENDING BILLIONS ON IPPS

                      made in
Zapped: A Review of BC Hydro’s Purchase of Power
        from Independent Power Producers
                 conducted for the
 Minister of Energy, Mines & Petroleum Resources
         by Ken Davidson. February, 2019

                March 21, 2019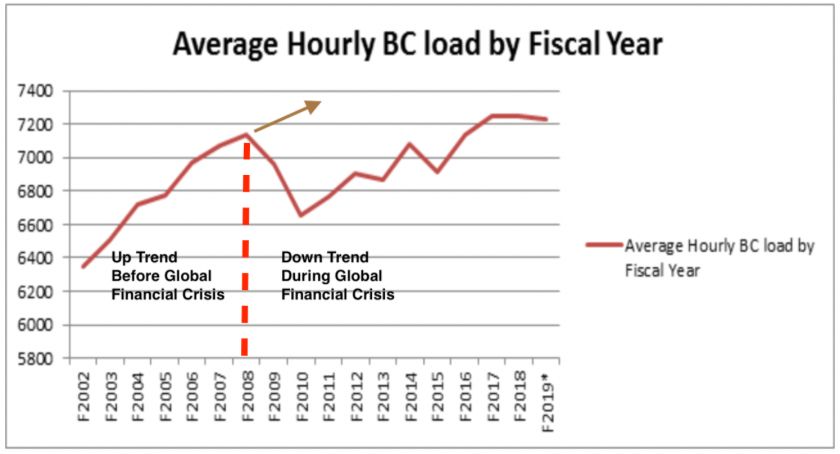
CEBC RESPONSE TO ZAPPED ALLEGATION OF OVERSPENDING BILLIONS ON IPPs

                                                        Table of Contents
Foreword. . . . . . . . . . . . . . . . . . . . . . . . . . . . . . . . . . . . . . . . . . . . . . . . . . . . . . . . . . . . . . . . 4

Executive Summary. . . . . . . . . . . . . . . . . . . . . . . . . . . . . . . . . . . . . . . . . . . . . . . . . . . . . . . 5

1. Zapped’s $16 Billion Allegation. . . . . . . . . . . . . . . . . . . . . . . . . . . . . . . . . . . . . . . . . . . 7

2. Volume of “Unnecessary” and “Forced” Energy Demand . . . . . . . . . . . . . . . . . . . . . 7
       2.1 Government Policy Directions. . . . . . . . . . . . . . . . . . . . . . . . . . . . . . . . . . . . . . . 8
       2.2 Zapped Allegation: “Intent to create the appearance of an energy shortfall”. . . . 8
              2.2.1 Policy to Eliminate Market Purchases Responded to High Levels
                    of Importing at Spot Prices. . . . . . . . . . . . . . . . . . . . . . . . . . . . . . . . . . 9
              2.2.2 Insurance Policy Added to Reflect Strong Domestic Load Growth
                    on top of High Imports. . . . . . . . . . . . . . . . . . . . . . . . . . . . . . . . . . . . . 9
              2.2.3 Depth and Duration of Market Change After 2008 Crisis was not
                    Immediately Apparent. . . . . . . . . . . . . . . . . . . . . . . . . . . . . . . . . . . . . 10
       2.3 Zapped Allegation: “BC Hydro must close Burrard Thermal by 2016”. . . . . . 13

3. Price Overpaid: ……….... . . . . . . . . . . . . . . . . . . . . . . . . . . . . . . . . . . . . . . . . . . . . . . . .14
        3.1 Mid-C is Irrelevant as a Comparator. . . . . . . . . . . . . . . . . . . . . . . . . . . . . . . . . . 14
               3.1.1 Security of Long-Term Supply. . . . . . . . . . . . . . . . . . . . . . . . . . . . . . . 14
               3.1.2 Cost-Effectiveness. . . . . . . . . . . . . . . . . . . . . . . . . . . . . . . . . . . . . . . . .15
               3.1.3 Mid-C Spot Market vs. Long-Term Market . . . . . . . . . . . . . . . . . . . . 15
               3.1.4 Site C Example. . . . . . . . . . . . . . . . . . . . . . . . . . . . . . . . . . . . . . . . . . . 16
        3.2 Zapped’s Mid-C Price Forecast is Too Low. . . . . . . . . . . . . . . . . . . . . . . . . . . . . 16

4. Duration: Years Exporting IPP EPA Surplus. . . . . . . . . . . . . . . . . . . . . . . . . . . . . . . . 17
       4.1 From 2009 to 2018. . . . . . . . . . . . . . . . . . . . . . . . . . . . . . . . . . . . . . . . . . . . . . . . 17
       4.2 From 2019 to 2028. . . . . . . . . . . . . . . . . . . . . . . . . . . . . . . . . . . . . . . . . . . . . . . . 18
       4.3 Total: 2009 to 2028. . . . . . . . . . . . . . . . . . . . . . . . . . . . . . . . . . . . . . . . . . . . . . . 18

5. Summary. . . . . . . . . . . . . . . . . . . . . . . . . . . . . . . . . . . . . . . . . . . . . . . . . . . . . . . . . . . . . . 20
      5.1 The Numbers. . . . . . . . . . . . . . . . . . . . . . . . . . . . . . . . . . . . . . . . . . . . . . . . . . . . .20
      5.2 The Three Underlying Allegations. . . . . . . . . . . . . . . . . . . . . . . . . . . . . . . . . . . . .20
             5.2.1 Volume of Unnecessary and Forced Energy. . . . . . . . . . . . . . . . . . . . . .20
             5.2.2 Price Overpaid. . . . . . . . . . . . . . . . . . . . . . . . . . . . . . . . . . . . . . . . . . . . .21
             5.2.3 Duration of Years Exporting Full IPP EPA Surplus. . . . . . . . . . . . . . . . 21

6. Conclusion. . . . . . . . . . . . . . . . . . . . . . . . . . . . . . . . . . . . . . . . . . . . . . . . . . . . . . . . . . . . . 21

7. Appendices. . . . . . . . . . . . . . . . . . . . . . . . . . . . . . . . . . . . . . . . . . . . . . . . . . . . . . . . . . . . . 22
      7.1 Wind Power Info Memo: Response to Zapped. . . . . . . . . . . . . . . . . . . . . . . . . . . 22
      7.2 Solar Power Info Memo: Response to Zapped. . . . . . . . . . . . . . . . . . . . . . . . . . . 25

8. Endnotes. . . . . . . . . . . . . . . . . . . . . . . . . . . . . . . . . . . . . . . . . . . . . . . . . . . . . . . . . . . . . . . 28

                                                                                                                                2|Page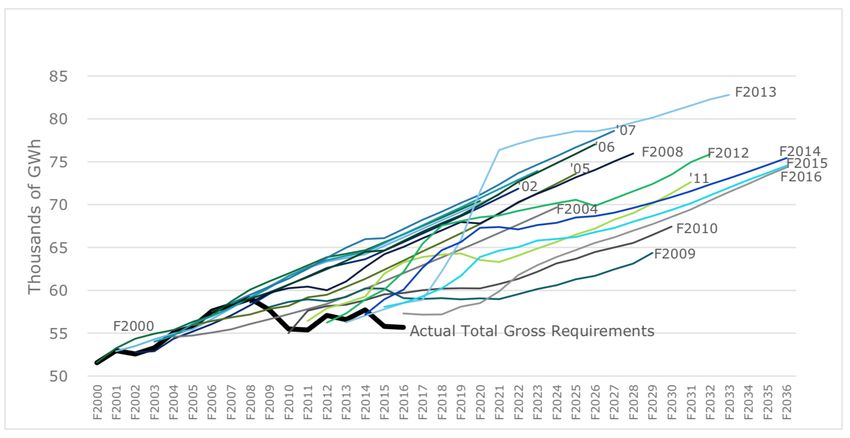
CEBC RESPONSE TO ZAPPED ALLEGATION OF OVERSPENDING BILLIONS ON IPPs

Tables

     1. Policy Directions in 2007 Energy plan that make up Zapped’s “unnecessary”
        and “forced” energy demand. . . . . . . . . . . . . . . . . . . . . . . . . . . . . . . . . . . . . . . . . . . . . 8
     2. BC net energy export and import volumes – fiscal 2009 to fiscal 2019
        per BC Hydro. . . . . . . . . . . . . . . . . . . . . . . . . . . . . . . . . . . . . . . . . . . . . . . . . . . . . . . 18
     3. Comparing Zapped vs. BC Hydro surplus over 20 years. . . . . . . . . . . . . . . . . . . . . . . 19
     4. Summary comparing the price and volume used by Zapped to the results
        of this report . . . . . . . . . . . . . . . . . . . . . . . . . . . . . . . . . . . . . . . . . . . . . . . . . . . . . . . . . 20

Figures
   1. BC average hourly load – F2002 to F2019 per BC Hydro. . . . . . . . . . . . . . . . . . . . . . 10
   2. Comparison of 16 BC Hydro load forecasts to actual requirements
      – 2000 to 2016. . . . . . . . . . . . . . . . . . . . . . . . . . . . . . . . . . . . . . . . . . . . . . . . . . . . . . . 11
   3. Comparison of 11 load forecasts to actual requirements
      – 2006 to 2017 for Alberta. . . . . . . . . . . . . . . . . . . . . . . . . . . . . . . . . . . . . . . . . . . . . . 12
   4. BC Hydro forecast of Mid-C average price from 2016 to 2040. . . . . . . . . . . . . . . . . . 16
   5. BC net energy export and import volumes – F2009 to F2019 per BC Hydro. . . . . . . 17
   6. Comparing Zapped’s Estimated Surplus IPP Volume to BC Hydro Records
      from 2019 – 2018 and Forecast for F2019 to F2028. . . . . . . . . . . . . . . . . . . . . . . . . . 19

                                                                                                                               3|Page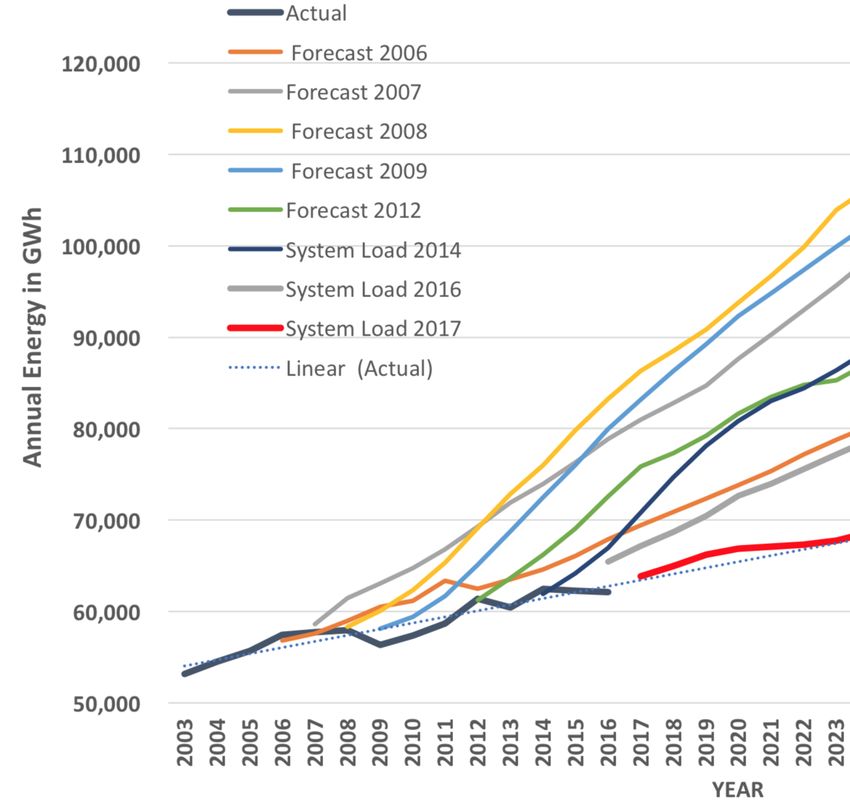
CEBC RESPONSE TO ZAPPED ALLEGATION OF OVERSPENDING BILLIONS ON IPPs

                                           Foreword

Zapped1 was a political document designed to make news headlines. In that regard it succeeded.
Most headlines echoed Zapped’s eye catching allegation about an overspending price tag of
billions of dollars. A typical headline was, “BC Hydro customers set up to pay $16 billion over
20 years for power they likely don’t need.”2

The Clean Energy Association of BC (CEBC) has prepared this report to rebut that headline-
grabbing allegation using direct statements and statistics from BC Hydro. They counter the
misrepresentations embedded in the calculation that Zapped used to make its $16 billion
overspending claim.

This report also debunks Zapped’s three overall allegations that “BC Hydro bought too much
energy, paid too much for the energy it bought, and undertook these actions at the direction of
                  3
the Government.”

The body of this report contains numbers and technical facts that directly counter the incorrect
numerical and positional allegations made in Zapped. The Executive Summary summarizes the
major results in non-technical language.

Zapped contains many other false claims and misrepresentations beyond the $16 billion
overspend allegation. They relate to the following points:

   •   Most of the energy that BC Hydro has contracted to buy from IPPs was covered in
       Electricity Purchase Agreements (EPAs) that were approved by the BC Utilities
       Commission.
   •   A material amount of the energy that BC Hydro has awarded through EPAs are to
       organizations that are not fully independent IPPs (i.e. Alcan, Waneta, and pulp mills).
   •   BC Hydro has increased its internal generating capacity substantially since 2001.
   •   IPPs have benefited British Columbians in many ways, including: diversity of fuel
       supply, improving grid reliability, First Nations capacity building, royalties and equity
       participation, Renewable Energy Credits, construction and operating jobs, taxes, and
       water rentals.
   •   IPPs faced significant competitive pressure to submit low-cost bids to BC Hydro Calls.
   •   Buying intermittent energy from IPPs has rarely caused BC Hydro to spill water or sell
       surplus energy at extremely low prices. Most of the energy produced during the spring
       freshet is generated at BC Hydro facilities.

Appendices A and B contain CEBC Information Memos that correct Zapped’s incorrect
assertions about the poor performance and high price of wind and solar power in BC.

Endnotes include listing the pages on which specific Zapped allegations are made and
identifying the 15 BC Hydro documents that are referenced in this report.

                                                                                        4|Page
CEBC RESPONSE TO ZAPPED ALLEGATION OF OVERSPENDING BILLIONS ON IPPs

                                           Executive Summary

IPPs are not costing BC ratepayers an extra $16 billion. This report shows that Zapped’s
allegations and calculations are completely at odds with BC Hydro’s facts and figures.

Contrary to Zapped’s estimate that BC Hydro will export a surplus of IPP energy totaling
190,000 GWh over 20 years, BC Hydro’s historical records and forecasts total only 23,500
GWh, or 1/8 of the claimed amount.1

Zapped’s misinformed assertion that the “value of all energy is Mid-C” (the spot market price of
importing energy from the USA) is not used by energy experts procuring new electricity supply.
Since 1989 BC Hydro has bought energy through long-term contracts, typically called Energy
Purchase Agreements (EPAs).

Utilities in regulated markets throughout North America (like BC) use the fixed prices specified
in the EPAs – not spot market prices. BC Hydro Executive VPs have stated that “having us
purchase from the spot market, is accepting too much volatility.”2

For Site C, neither the joint federal/provincial review panel nor the current or the previous
provincial government approved building the project by comparing its cost of energy to Mid-C.3

The BC Liberals’ 2007 Energy Plan was not created with “the intent to create the appearance of
an energy shortfall.” In 2007, after several years of high net imports and strong domestic load
growth, the 2007 Energy Plan set a goal of self-sufficiency by 2016.

The self-sufficiency goal was also informed by BC Hydro Executive VPs stating, in 2006, that
the level of imports was too high, having reached 18%, and that the price of imports was too
volatile.4 They recommended increasing the security of supply and price by replacing imported
energy with long-term contracts.

In 2008 and 2009, BC Hydro issued three Calls for IPP energy, the Clean Power Call and two
Bioenergy RFPs. The size of these Calls was based on BC Hydro’s forecasts that demand would
continue to grow at the same strong pace as it had for the previous several years.

By August 2010, BC Hydro had signed the EPA contracts with the IPPs in those three Calls. The
2010 BC Hydro load forecast still showed demand increasing strongly – as did forecasters in
Alberta and the USA.5 Almost no economic forecasters foresaw the depth or duration of the
2008/09 financial crisis. By the time the drop was fully understood, construction had started on
the IPPs that had received EPAs from those three Calls.

1
  Total of BC Hydro Historical Net Energy Exports/Imports for BC 2009 - 2018 (Figure 5) and BC Hydro Load
Resource Balance 2019-2028 (Table 2) combined together in Table 3.
2
  BC Hydro testimonies to the BCUC as shown in Section 3.1.1 and Endnote #32
3
  BCEAA/CEAA Section 3.1.4 Site C Example
4
  BC Hydro testimonies to the BCUC as shown in Section 2.2.1 and Endnote #7
5
  BC Hydro Load Forecasts vs Actual Requirements (Figure 2) prepared by Deloitte, and a similar forecast prepared
for Alberta electricity demand (Figure 3).
                                                                                                     5|Page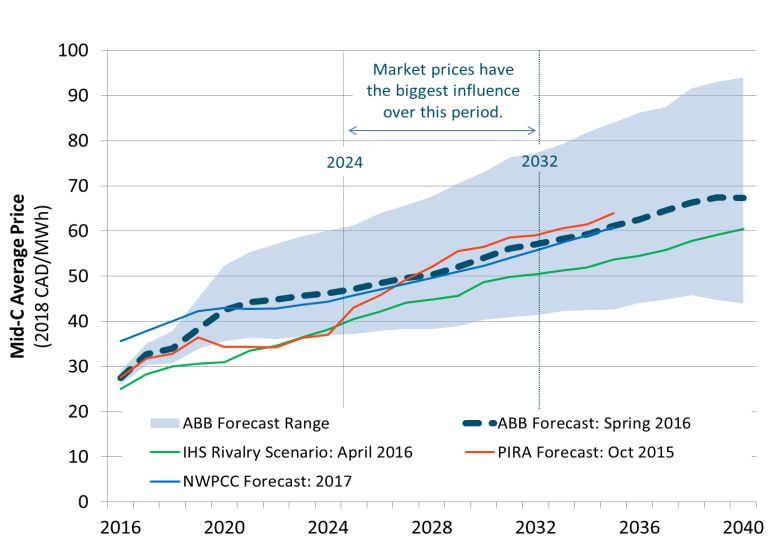
CEBC RESPONSE TO ZAPPED ALLEGATION OF OVERSPENDING BILLIONS ON IPPs

It took until 2017 for electricity demand to recover to the 2008 level.6 While BC was a net
importer in 2014 and 2015, in 2016 it was net exporter of 11% of demand. In 2017 and 2018 BC
remained a net exporter but at slightly lower levels.7

The price of energy in the EPAs that BC Hydro awarded from those three Calls were cost-
effective – at the time the EPAs were signed.

BC Hydro stated in its 2010 Report on the Clean Power Call RFP that, “The price to be paid for
this electricity met BC Hydro's expectations based on comparisons to other BC Hydro processes
and similar processes undertaken by other jurisdictions … [the] Call process has resulted in the
acquisition of cost-effective clean, renewable electricity for BC Hydro's ratepayers.”

BC Hydro stated in its 2012 Report on the Bioenergy Phase 2 Call that, “The cost-effectiveness
is also demonstrated by comparing the RFP results to other BC Hydro calls … Furthermore, the
weighted-average Average Firm Energy Price for the Bioenergy Phase 2 RFP is lower than that
for the Clean Power Call … The Bioenergy Phase 2 RFP awards are also comparable to recent
Hydro-Quebec awards for biomass and wind projects.”

The price of renewable IPP energy has dropped since 2009. Wind turbine costs have dropped and
their performance has improved – yielding energy cost reductions of over 60%. The interest rates
charged to finance wind and hydro projects has dropped substantially from 2008/2009 which was
in the midst of the financial crisis.

The 2007 Energy Plan’s policy direction to use the Burrard Thermal Generating Station less and
to close it by 2016 was to save money and reduce GHG emissions. Burrard was 50 years old and
very inefficient.

In addition to having to buy much more fuel than the average gas-fired power plant in North
America, it faced huge carbon taxes. In 2006 a senior executive at BC Hydro stated, “Burrard is
no longer economic for providing energy.”8 Its inefficiency also resulted in it having much
higher GHG emissions than the average gas power plant.

In conclusion, BC Hydro figures do not support Zapped’s allegation of a $16 billion overspend.
Zapped’s estimate of over-purchased volume is 8 times more than BC Hydro’s historical record
and forecasts of net exports from surplus IPP energy. Zapped’s Mid-C overcharging theory is
irrelevant to the pricing of new projects energy and is not used by BC Hydro or anyone else.

The surplus energy that does exist was not intentionally created by the previous government and
was not forced upon BC Hydro. The amount of energy BC Hydro purchased through the EPAs
was based on its own forecasts and it signed them before it and other forecasters recognized the
extent of the drop-in demand after the financial crisis.

6
  BC Hydro Average BC Load 2002-2019 (Figure 1)
7
  BC Hydro’s Net Energy Exports/Imports in BC 2009 – 2019 (Figure 5)
8
  BC Hydro testimonies to the BCUC as shown in Section 2.3 and Endnote #29
                                                                                      6|Page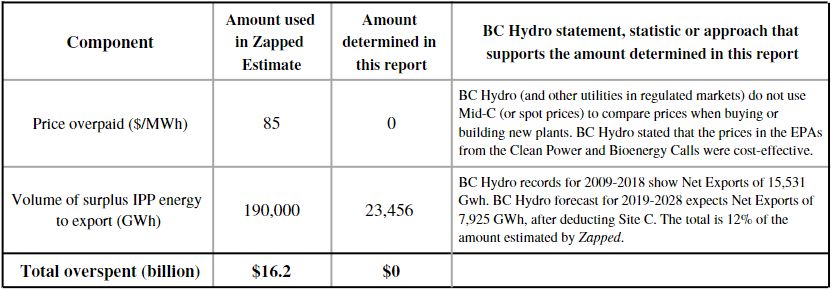
CEBC RESPONSE TO ZAPPED ALLEGATION OF OVERSPENDING BILLIONS ON IPPs

                          Clean Energy Association of BC

                                         Response to
            Zapped allegation of overspending billions on IPPs

1. Zapped’s $16.2 Billion Allegation
Zapped’s Executive Summary and Conclusion both repeat the following allegation:

“Government directed BC Hydro to purchase 8,500 GWh/year of Firm energy BC Hydro did not
need. This direction of BC Hydro’s actions is manifest in the Response EPAs … The Response
EPAs cost ratepayers an Estimated $16.2 billion over 20 years, the estimated period during
which BC Hydro will likely not need the energy Government told it to buy.”4

Zapped arrives at the $16.2 billion “Estimate” using the following formula:

                     9,500 GWh/year x $85/MWh x 20 years = $16.2 billion

The 9,500 GWh/year amount is the total energy contracted under all the EPAs (Electricity
Purchase Agreements) signed since 2007 (the “Response EPAs”). The 8,500 GWh/year amount
is the amount that Zapped alleges the previous government directed BC Hydro buy from IPPs
since 2007 that was not needed. Zapped alleges that the government directed BC Hydro to buy
8,500 GWh in 2007 which has now resulted in BC Hydro buying 9,500 GWh. And that 9,500
GWh is surplus to BC’s needs for 20 years.

This rebuttal report refutes Zapped’s $16.2 billion Estimate by critiquing each of the three
numbers in the aforementioned formula in three sections:

   •   Volume of energy that was unnecessary and forced (9,500 GWh/year),
   •   Price overpaid ($85/MWh), and
   •   Duration of the unneeded surplus volume (20 years).

2. Volume of “Unnecessary” and “Forced” Energy Demand

Zapped links the related amounts of 9,500 GWh/year and 8,500 GWh/year as follows:

       “The Response EPAs represent approximately 9,500 GWh of additional contracted
       energy. These EPAs act as a proxy for the impact. Of note, total energy contracted under
       the Response EPAs includes both Firm and non-Firm energy, whereas the policy
       directive demanded BC Hydro deliver 8,500 GWh in Firm energy. BC Hydro was trying
       to buy 8,500 GWh of Firm energy, but likely managed to buy only 9,500 GWh of blended
       energy.”

                                                                                        7|Page
CEBC RESPONSE TO ZAPPED ALLEGATION OF OVERSPENDING BILLIONS ON IPPs
This section will critique Zapped’s allegation that the previous government erred in establishing
policies that resulted in BC Hydro issuing Calls for IPP power amounting to 8,500 GWh/year
because that amount was unnecessary.
2.1 Government Policy Directions
Zapped states:
• “Given Government’s direction and BC Hydro’s intent to comply, the Estimate of the
impact of the policy direction could be based on 8,500 GWh of incremental Firm
energy.”
• “… the 2007 Energy Plan and Special Direction #10 amounted to direct Government
interference with the energy planning process at BC Hydro, with the intent to create the
appearance of an energy shortfall. The resulting energy shortfall was then used to justify
an expansion of the IPP portfolio and gave rise to the calls for power issued since
2007…"5
• “In Recommendation 19 of the 2007 Energy Plan Government directed that the province
would achieve zero net greenhouse gas emissions from existing thermal generation plants
by 2016. This was effectively a direction that BC Hydro must close Burrard Thermal by
2016.”
• “After 2007, BC Hydro operated with the intent that it needed to buy 8,500 GWh of
incremental Firm Energy.”
The following table summarizes the policy directions that Zapped claimed constituted
government interference in BC Hydro’s load forecasting and planning:
Table 1: Policy directions in 2007 Energy Plan that make up Zapped’s “unnecessary” demand
2.2 Zapped Allegation: “Intent to create the appearance of an energy shortfall.”
Zapped claims that these three Government Directions “amounted to direct Government
interference with the energy planning process at BC Hydro with the intent to create the
appearance of an energy shortfall.” This is not true.
8|PageCEBC RESPONSE TO ZAPPED ALLEGATION OF OVERSPENDING BILLIONS ON IPPs
2.2.1 Policy to Eliminate Market Purchases6 Responded to High Levels of Importing at Spot
Prices
In 2006, two senior executives at BC Hydro gave the following testimony7 to the BCUC8 (with
underlining added):
• “Right now we rely on spot market for about 18% of our domestic load, and we’ve made
an assessment that we feel that’s too heavy a reliance on spot market. And so the actions
we are taking in this LTAP 9 are moving us away from a reliance towards more energy
security …”
• “We fundamentally believe that having 18% of our reliance on the spot market, because
we fundamentally have a plant that looks like it’s producing energy but it really isn’t. It’s
just having us purchase from the spot market, is accepting too much volatility, and that
replacing the energy of that plant with longer-term products that have less volatility is
more cost-effective overall.”10
BC was a net importer of energy for 6 of the 7 years from 2001 to 2007. That is based on the
tables on the BC Hydro website that show the Net Actual Flows across the US Tie-lines. 11
The government made self-sufficiency a primary theme of the 2007 Energy Plan because BC
Hydro was relying too heavily on imports.
Self-sufficiency is especially relevant for BC because, at the very same time when BC faces a
drought,12 Washington and Oregon typically face the same drought. BC Hydro has advised that,
“Access to the electricity markets and delivery of the CE all rely on the same I-5 transmission
corridor through the Seattle region that is frequently constrained.”13 The transmission interties
with Washington14 can often be congested at the same time that BC needs to import electricity.
For all these reasons, the government’s self-sufficiency policy was and still is prudent.
2.2.2 Insurance Policy Added to Reflect Strong Domestic Load Growth on top of High Imports
The 2007 Energy Plan pointed to the high and growing level of imports and added strong
domestic load growth as the rationale for adding “insurance”:
• “BC Hydro must acquire an additional supply of “insurance power” beyond the
projected increases in demand to minimize the risk and implications of having to rely on
electricity imports.”
• “BC Hydro estimates demand for electricity to grow by up to 45 per cent over the next
20 years.”
BC’s net imports were also rising because domestic load growth was consistently strong. BC
Hydro’s Average Hourly Flow graph15 below shows the very strong electrical load growth
ramping up from 2002 to 2007 upon which the 2007 Energy Plan insurance policy was based.
9|PageCEBC RESPONSE TO ZAPPED ALLEGATION OF OVERSPENDING BILLIONS ON IPPs
Figure 1: BC Average Hourly Load - F2002 to F2019 per BC Hydro
The irony is that for the purposes of BC Hydro’s Clean Power Call – and in particular its forecast
energy gap for F202016 – the 3,000 GWh insurance requirement was not included. According to
BC Hydro:
“None of the 3,000 GWh/year insurance called for in the 2007 Energy Plan or subsection
6(2)(b) of the Clean Energy Act is included. If the insurance requirement is added to the
load/resource balance figures, the energy gap would increase considerably by F2021, or
sooner if the additional 3,000 GWh is acquired on a phased basis.”17
2.2.3 Depth and Duration of Market Change After 2008 Crisis was not Immediately Apparent
In 2008 the global financial crisis dramatically changed the direction of BC’s load growth. The
crisis resulted in the biggest economic downturn since the 1930’s Great Depression. US
household wealth fell by trillions, the Dow dropped in half, the housing market collapsed and
Government bailouts were required to save banks and the auto sector.18
In BC the industrial and export commodities sectors shrank along with their electricity
consumption. After decades of steadily increasing electricity demand in late 2008, BC started to
experience an unprecedented decrease in demand, ultimately dropping 6% over the next two
years.
Zapped stated that “the change in the energy market was apparent in January 2009 and the
reducing levels of industrial load were apparent soon after.”19 While today, 10 years later, the
change can be seen, for the first few years after the 2008 financial crisis professional forecasters
at BC Hydro (and elsewhere) did not foresee the amount or duration of the load reductions.
The graph20 below compares 16 load forecasts made by BC Hydro’s Load Forecast department
each year from 2000 to 2016 to the Actual Requirements.
10 | P a g eCEBC RESPONSE TO ZAPPED ALLEGATION OF OVERSPENDING BILLIONS ON IPPs
Figure 2: Comparison of 16 BC Hydro Load Forecasts to Actual Requirements - 2000 to 2016
Up to 2008, most of the actual load requirements matched the load forecasts. None of the
forecasts foresaw the big load decrease that occurred from 2008 to 2010. Even the forecasts
made in 2008 and 2009 by the BC Hydro Load Forecast department did not see the load
decrease. Indeed their 2010 Forecast anticipated a big rise of 3,000 GWh by 2011 but the actual
load kept falling.
A similar graph21 below compares 16 load forecasts made by the Industrial Power Consumers
Association of Alberta (IPCAA) from 2006 to 2017 to the Actual Requirements.
11 | P a g eCEBC RESPONSE TO ZAPPED ALLEGATION OF OVERSPENDING BILLIONS ON IPPs
Figure 3: Comparison of 11 Load Forecasts to Actual Requirements – 2006 to 2017 for Alberta
Again, up to 2008, most of the actual load requirements matched the load forecasts for Alberta.
None of the forecasts foresaw the big load decrease that occurred from 2008 to 2010. Even the
forecasts made in 2008 and 2009 by IPCAA did not see the coming load decrease. Indeed their
2009 Forecast anticipated a load in 2012 that was about 4,000 GWh or 6% higher than the actual
load.
The point here is not to criticize the load forecasting made by IPCAA or BC Hydro. No one
correctly forecasted the timing and scale of the recession - including the International Monetary
Fund22 and the Federal Reserve Bank of New York23.
The point is to rebut Zapped’s claim that “the change in the energy market was apparent in
January 2009” and that “by this time (December 21, 2009) Government had been advised by
both Ministry and BC Hydro analysts that the market had changed.” BC Hydro’s bullish load
forecasts made in 2008, 2009 and 2010 refute those claims.
This timing is also important because it severely undercuts the 9,500 GWh volume figure that
Zapped claimed the Government should have stopped BC Hydro from awarding EPAs after BC
Hydro reduced its forecasts. By August 2010 BC Hydro had already signed all the EPAs that
resulted from the Clean Power Call and the Bioenergy 1 RFP. The energy covered by the EPAs
signed after August, 2010 totalled 3,817 GWh24 which is only 40%25 of all the energy in the
9,500 GWh figure that Zapped uses in its $16.2 billion calculation.
12 | P a g eCEBC RESPONSE TO ZAPPED ALLEGATION OF OVERSPENDING BILLIONS ON IPPs
In summary, BC Hydro’s expressed concerns about chronic and high volumes of net importing
plus strong domestic demand and bullish BC Hydro load forecasts prompted the government to
establish self-sufficiency policies in 2007 to end “market purchases” and adding “insurance.”
They were not done “with the intent to create the appearance of an energy shortfall,” as asserted
by Zapped.
BC Hydro Load forecasts remained bullish throughout 2010. By that time BC Hydro had already
signed EPAs with IPPs for 60% of the 9,500 GWh that Zapped claimed could have been avoided
based on Zapped’s false allegation that BC Hydro had advised government of the change in
market in 2009.
2.3 Zapped Allegation: “BC Hydro must close Burrard Thermal by 2016.”
This is not true for the following reasons:
• The 2007 Energy Plan did not state “close Burrard,” it stated: “reduce use of Burrard.”
• The 2007 Energy Plan acknowledged the plant’s unique benefits by stating the following:
“Burrard Thermal still provides significant benefits to BC Hydro as it acts as a ‘battery’
close to the Lower Mainland, and provides extra capacity or ‘reliability insurance’ for
the province’s electricity supply. It also provides transmission system benefits that would
otherwise have to be supplied through the addition of new equipment at Lower Mainland
sub-stations.”
• The 2007 Energy Plan gave BC Hydro flexibility on timing by stating: “BC Hydro may
choose to retain Burrard for capacity purposes after 2014.”
• The 2007 direction to reduce its use had a very minor practical impact because it was
hardly used except as a mask for imports. The direction said “3,000 GWh/year.” For the
prior years, Burrard “was seldom operated … generating in the range of 100-300
GWh/year.”26
Burrard Thermal was built in the early 1960s. By 2007 it was commonly agreed that it was
outdated, inefficient27 and costly to run. Burrard required 25% more gas to generate electricity
than the average US gas-fired power plant.28. That meant it produced 25% more CO2 emissions
than the average plant. The resulting high cost of fuel gas and the high level of carbon taxes
made Burrard’s energy cost very expensive.
In 2006, a BC Hydro senior executive gave testimony29 to the BCUC, stating:
“The only thing I will say about Burrard is that we’re very clear that Burrard is no
longer economic for providing energy. And really when you think about providing energy
from Burrard, we’re just buying from the market. And it’s been masking that for several
years now.”
Zapped also claimed that:
“Burrard Thermal, BC Hydro’s gas-fired generating facility had just been upgraded with
$150 million in new catalytic converters, arguably making it as clean or cleaner than the
gas generation California relies upon today.”
13 | P a g eCEBC RESPONSE TO ZAPPED ALLEGATION OF OVERSPENDING BILLIONS ON IPPs
Burrard's high level of inefficiency made that physically impossible. Compared to the average
gas-fired power plant in California Burrard required 29% more gas and therefore created 29%
more CO2 per MWh.30 The catalytic converters were installed to reduce NOx – not CO2.
Cleaning up NOx is fine but the remaining extremely high CO2 emissions would not be seen as
anyway near “clean” by Californian standards.
The 2007 Energy Plan included the goal of “zero net GHG emissions from existing thermal
generation plants by 2016.” Reducing Burrard’s use was consistent with that policy goal.
The government’s three 2007 policies that resulted in BC Hydro acquiring 9,500 GWh/year were
necessary and prudent.
3. Price Overpaid
Zapped alleges that BC Hydro paid $85/MWh too much for the 9,500 GWh of energy it acquired
through the EPAs signed after 2007. It reached the $85 premium using the following formula:
$85/MWh = $110/MWh - $25/MWh
Zapped states that the:
• “… average cost of 9,500 GWh of blended energy acquired in 2009 is assumed to be
$110/MWh.”
• “… estimated market value of this surplus energy, if sold at Mid-C is assumed to be $25
/MWh.”
3.1 Mid-C is Irrelevant as a Comparator
Zapped asserts that “energy has only one price and that is the price it can be bought or sold at in
the market. In the case of BC Hydro, the market value of all energy is the Mid-C rate.”
This is a bizarre assertion. In the absence of a competitive pool-based market, such as those in
Alberta and Texas, no one builds new electrical generation projects based on a spot price like
Mid-C.31 BC Hydro and utilities throughout North America purchase electricity through holding
competitive Calls and then signing long-term EPAs with the lowest price bids to get security of
supply and price.
3.1.1 Security of Long-Term Supply
In 2006, two senior executives from BC Hydro gave the following testimony32 to the BCUC
(with underlining added):
• “… we’ve made an assessment that we feel that’s too heavy a reliance on spot market.
And so the actions we are taking in this LTAP are moving us away from a reliance
towards more energy security …”
14 | P a g eCEBC RESPONSE TO ZAPPED ALLEGATION OF OVERSPENDING BILLIONS ON IPPs
• “We fundamentally believe that having 18% of our reliance on the spot market … is
accepting too much volatility, and that replacing the energy of that plant with longer-
term products that have less volatility is more cost-effective overall.”33
• “We are moving away from a reliance on spot market. So that’s why we have proposed
these two future calls going forward … We’ve set those call volumes based on what we
feel we need to bring on to close this supply gap that we’ve got.”
3.1.2 Cost-Effectiveness
BC Hydro stated in its Report on the Clean Power Call RFP34 that:
“The price to be paid for this electricity met BC Hydro's expectations based on
comparisons to other BC Hydro processes and similar processes undertaken by other
jurisdictions, and to 2008 LTAP projections. BC Hydro's Clean Power Call process has
resulted in the acquisition of cost-effective clean, renewable electricity for BC Hydro's
ratepayers.”
BC Hydro stated in its Report on the Bioenergy Phase 2 Call RFP35 that:
“The cost-effectiveness is also demonstrated by comparing the RFP results to other BC
Hydro calls. … Furthermore, the weighted-average Average Firm Energy Price for the
Bioenergy Phase 2 RFP is lower than that for the Clean Power Call … The Bioenergy
Phase 2 RFP awards are also comparable to recent Hydro-Quebec awards for biomass
and wind projects.”
3.1.3 Mid-C Spot Market vs. Long-Term Market
Zapped does not understand the critical difference between spot-market prices and the price of
long-term electricity in an EPA.
The spot price does not provide any return on capital that is necessary to build a new project. The
price in a long-term EPA does provide for a return on capital which is necessary to get the
financing to build the project.
The electricity in the Mid-C spot market is made up of the highly variable daily surplus of
utilities located between California and Alberta. To secure the supply necessary to meet the core
needs of its customers, BC Hydro cannot rely on buying whatever surplus is left over after
neighbouring utilities have met their customers’ core needs. Mid-C’s highly variable daily
supply is reflected in its highly variable daily price. Though often in the $20 - $40/MWh range,
last year it exceeded $100/MWh for 10 days.
Since 1989 BC Hydro has bought power from IPPs through firm, long-term EPAs, and to pay the
associated firm, long-term price. When BC Hydro applies to the BCUC about building its own
projects the BCUC compares the long-term cost of BC Hydro’s projects to the long-term price of
IPP projects, not the Mid-C price.
15 | P a g eCEBC RESPONSE TO ZAPPED ALLEGATION OF OVERSPENDING BILLIONS ON IPPs
3.1.4 Site C example
The most recent local project example is BC Hydro’s own Site C. The current government
approved continuing Site C based on BC Hydro stating that its price would be $65/MWh.36 That
is over twice the price of Mid-C, which has hovered around $30 for years. And the calculation of
this very low Site C prices is certainly debatable.
The CEAA/BCEAA37 Joint Review Panel did not compare the price of Site C to Mid-C in its
2014 Assessment. Nor did the BCUC consider Mid-C in its 2017 Inquiry.
If the value of Site C energy was determined based on using Zapped’s theory that “the market
value of all energy is the Mid-C rate,” then it would be the biggest money loser in the history of
BC. Using Zapped’s $25/MWh price for Mid-C would result in the present value of all the
energy generated from Site C totaling about $3.5 billion.38 That is far less than the $10.7 billion
cost that BC Hydro estimates to build it. Applying Zapped’s methodology would mean that
building Site C would result in a loss of $7.5 billion.39
In summary, BC Hydro executives recommended reducing reliance on Mid-C imports and
increasing reliance on long-term EPAs. Federal and provincial government Assessments and the
BCUC Inquiry did not use Mid-C as comparator for building Site C (or other new projects). The
only person using Mid-C for that purpose is the author of Zapped.
3.2 Zapped’s Mid-C Forecast Level is Too Low
In addition to Zapped incorrectly assuming that Mid-C is relevant to judging the cost-
effectiveness of procuring energy through EPAs or building new power projects, Zapped’s
$25/MWh forecast level for Mid-C is too low.
40
BC Hydro submitted the following Mid-C forecast to BCUC for its 2017 Site C Inquiry.
Figure 4: BC Hydro Forecast of Mid-C Average Price from 2016 to 2040
16 | P a g eCEBC RESPONSE TO ZAPPED ALLEGATION OF OVERSPENDING BILLIONS ON IPPs
BC Hydro’s average Mid-C forecast starts at $40/MWh in 2020 and increases to $68/MWh in
2040. The average price during that 20-year period is $54/MWh. That is over twice the $25/MW
price that Zapped used in its calculation over the same period.
Mid-C is irrelevant in judging the cost-effectiveness of acquiring energy from new projects. And
even if it were relevant, Zapped’s forecasted Site C price is completely at odds with the forecast
advanced by BC Hydro to the BCUC with respect to the spot price that BC Hydro would receive
for the surplus electricity created by Site C.
BC Hydro executives recommended reducing reliance on Mid-C and increasing reliance on long-
term EPAs. And BC Hydro Call Review reports stated the RFP competitions were robust and the
price of energy in the awarded EPAs were cost-effective.
4. Duration: 20 Years Exporting the Full IPP EPA Surplus
Zapped states that “this report expects the annual impact of the over-buy will be felt for some 20
42 43
years.”41 Zapped starts its tally of the 9,500 GWh/yr of overbought Response EPAs in 2009.
Zapped’s $16.2 billion estimate is based on the full amount of the overbought energy being
surplus to domestic needs and therefore being sold to the export market at Mid-C.
This rebuttal will compare Zapped’s estimate to BC Hydro’s actual records looking back 10
years and then to BC Hydro’s forecast looking forward 10 years.
4.1 From 2009 to 2018
Zapped estimates the total exported surplus was 95,000 GWh (9,500 GWh x 10 years).
The total of the actual net exported surplus over those years is 15,531 GWh according to
following BC Hydro graph44.
Figure 5: BC Net Energy Export & Import Volumes - Fiscal 2009 to Fiscal 2019 per BC Hydro
17 | P a g eCEBC RESPONSE TO ZAPPED ALLEGATION OF OVERSPENDING BILLIONS ON IPPs
This comparison demonstrates that, to date, Zapped’s surplus estimate was 79,469 GWh too high
or 6 times higher than BC Hydro’s records (95,000/15,531).
4.2 From 2019 to 2028
Zapped estimates the total exported surplus will be 95,000 GWh (9,500 GWh x 10 years).
45
BC Hydro’s most recent 10-year forecast shows that, after deducting Site C, the total net
surplus from 2019 to 2028 is expected to be 7,925 GWh.
The energy generated by Site C is deducted in this determination because it was built by BC
Hydro, not an IPP. And Site C was started after 98% of the Response EPAs (that are the subject
of Zapped’s “overbought” allegation) were signed. This is shown in the following table.
Table 2: BC Hydro Energy Load Resource Balance, 2019 to 2028, after deducting Site C
For the next 10 years, Zapped’s surplus estimate is 87,075 GWh too high or more than 12 times
higher than BC Hydro’s forecast (95,000/7,925).
BC Hydro’s above forecast was extracted from its October 5, 2018 Application to the BCUC and
does not include any new energy expected to be needed to support the many electrification
programs in the government’s CleanBC Plan announced on December 5, 2018.
4.3 Summary 2009 to 2028
Over the 20 years that Zapped based its $16.2 billion overbuy calculation it overestimated the
surplus by 166,275 GWh compared to BC Hydro historical records and forecast. The table below
shows that Zapped overestimated the surplus by a factor of 8 times too much. Or the corollary,
BC Hydro’s amounts are only 12% of the Zapped estimate.
18 | P a g eCEBC RESPONSE TO ZAPPED ALLEGATION OF OVERSPENDING BILLIONS ON IPPs
Table 3: Comparing Zapped’s IPP Surplus vs. BC Hydro Record or Forecast over 20 years
The figure below shows Zapped’s estimated surpluses vs. BC Hydro records and forecast.
Figure 6: Comparing Zapped Estimate of Surplus due to IPP Over-purchasing to BC Hydro
Historical Records and Forecast from 2009 - 2028 (GWh)
19 | P a g eCEBC RESPONSE TO ZAPPED ALLEGATION OF OVERSPENDING BILLIONS ON IPPs
5. Summary
5.1 The Numbers
Each of the amounts that Zapped used to calculate the $16.2 billion overspend are incorrect.
The price paid for that energy was the market price, not some “overpaid” amount above
Zapped’s mis-utilized spot price at Mid-C.
And even if there was some overbuying and/or the Mid-C price was relevant, over the 20 years
of the supposed massive energy exporting, BC Hydro’s records and forecast show only 10 years
of modest exports totaling only 23,725 GWh or 12% of the amount in Zapped’s estimate.
The amounts in Zapped’s formula are compared in the following table.
Table 4: Summary comparing the price and volume used by Zapped to the results of this report
5.2 The Three Underlying Allegations
5.2.1 Volume of Unnecessary and Forced Energy Contracts
Zapped’s allegation that Government Directions that resulted in EPAs total 9,500 GWh/yr
“amounted to direct Government interference with the energy planning process at BC Hydro
with the intent to create the appearance of an energy shortfall” is wrong.
Senior BC Hydro executives’ testimonies in 2006 supported the Governments policy directions
in 2007 to end importing from the spot market and to reduce the use of Burrard. They said
import levels were too high and the prices too volatile. Burrard’s high level of inefficiency made
its fuel costs and carbon taxes very expensive and its CO2 emissions excessive.
BC Hydro Load forecasts remained bullish up to 2011. By that time BC Hydro had already
signed EPAs with IPPs for the majority of the 9,500 GWh/year that Zapped claimed could have
been avoided.
20 | P a g eCEBC RESPONSE TO ZAPPED ALLEGATION OF OVERSPENDING BILLIONS ON IPPs
5.2.2 Price Overpaid
Mid-C is irrelevant in judging the cost-effectiveness of acquiring energy from new projects. BC
Hydro, the BCUC, the CEAA and other utilities do not use Mid-C as a comparator. Even the
former and current governments did not use Mid-C when they decided to approve and continue
with Site C. Its only relevance was in relation to the value of revenue that could be generated
from the forecast surplus of electricity resulting from Site C and even then BC Hydro’s forecast
price is much higher than Zapped’s.
BC Hydro executives recommended reducing reliance on Mid-C and increasing reliance on long-
term EPAs. And BC Hydro Call Review reports stated that the price of energy in the awarded
EPAs were cost-effective.
5.2.3 Duration of Years of Full IPP EPA Surplus
The number of years of having any surplus since 2009 is 10 years; not the 20 years assumed in
Zapped. And over the 20 years the average surplus is 1,200 GWh/year resulting in a total surplus
that is 12% of the Zapped estimate.
6. Conclusion
Zapped’s allegation of a $16.2 billon overspend is totally incorrect and unfounded.
21 | P a g eCEBC RESPONSE TO ZAPPED ALLEGATION OF OVERSPENDING BILLIONS ON IPPs
Appendix 7.1
CEBC Wind Power Information Memo: Response to Zapped:
BC Wind Can Supply Lowest Cost Power
The declining cost of utility scale wind and solar energy to a price below that of most other
generation alternatives is one of the major energy stories of the past year globally.9 Further to the
celebrated falling prices, it is clear British Columbians like all Canadians have a more positive
view of wind power than other energy options. 10
The Canadian Wind Energy Association (CanWEA) recently announced that Canada’s wind
energy industry further expanded its installed capacity in 2018, while solidifying its status as the
lowest-cost source of new electricity generation. Newly commissioned projects brought total
national wind energy capacity to close to 13,000 megawatts (MW). Meanwhile, competitive
auction results in Saskatchewan and Alberta confirmed the wind industry’s ability to continue to
deliver record-low prices.
Unfortunately for British Columbia, which has one of the world’s best wind power climates, the
author of the political Zapped Report did not research the social acceptance, declining costs and
improved efficiencies of BC wind power with expert renewable power developers before
dismissing BC’s wind power as “non-competitive.”
BC’s current large utility-scale wind projects were built based on a previous era of global
renewable economics. The power purchase contracts were awarded more than 10 years ago.
Since 2009, the average Levelized Cost of Energy for utility-scale wind projects has dropped 69
per cent due to declines in the cost of system components and improvements in efficiency.11 BC
wind costs today among new large utility-scale projects bidding in a competitive RFP would be
expected in the range of $50 MWh, or 5 Cents/kWh based on recent Canadian competitive
pricing in adjacent provinces.
Many BC regions are first in line to harvest energy from the prevailing westerly winds and
weather systems that dependably cross the province from the North Pacific enroute to other
Canadian provinces including Alberta and Saskatchewan.
And while a new generation of proposed BC utility-scale wind projects are ready to bid supply of
clean power, the price of wind has not been tested by BC Hydro in a competitive process for
more than 10 years. The Zapped Report fails to acknowledge the current economic and technical
reality of BC’s outstanding wind and solar resources. By doing so, Zapped performs a disservice
to British Columbia and its electric ratepayers.
9
The November 2018 Levelized Cost of Energy Analysis by Lazard (12.0) determined that in the U.S., the mid-
point of the cost range for unsubsidized wind energy (US$42) is lower than any alternative, with natural gas
combined cycle generation coming in cheapest among conventional options with a cost range mid-point of US$58.
10
March 12, 2019 Poll conducted by LNG Canada from Vancouver shows that 80% of Canadians have a positive
view of wind power, the highest approval of all energy options. The recent poll interviewed 800 British
Columbians out of a total of 1,000 Canadians. https://www.newswire.ca/news-releases/four-in-five-canadians-
support-resource-development-projects-895410510.html
11
Lazard/s Levelized Cost of Energy analysis, Version 12.0, November 2018.
22 | P a g eCEBC RESPONSE TO ZAPPED ALLEGATION OF OVERSPENDING BILLIONS ON IPPs
BC’s first wind farm began commercial operations in November 2009. At the end of 2018, the
province had almost 700 MW of installed wind energy capacity, supplying nearly two per cent of
British Columbia’s electricity demand.
BC has some of the strongest, most consistent wind regimes in Canada and has the ideal hydro
resource base to integrate substantial amounts of wind power. The reasons for BC to increase the
use of its abundant, world-class wind resource are rational and compelling.
According to CanWEA, analyses presented to the BC Utilities Commission’s 2017 review of the
Site C hydroelectric project clearly showed that wind energy was cost-competitive with new
hydro generation. Wind energy’s costs have only fallen further since then. Indeed, three recent
procurements for new wind energy in Alberta and Saskatchewan all produced winning bids at an
average price of less than $40/MWh. (4 Cents/kWh).12 The projects brought billions in
investment, created thousands of jobs and will pay hundreds of millions in regional benefits. On
a levelized cost of energy basis, CanWEA states there is no new source of electricity available in
Canada today that can compete with wind energy.
Wind developers with experience in all of Canada’s three western provinces have confirmed the
lowest cost for proposed utility-scale BC wind projects would be expected to be similar prices to
Alberta and Saskatchewan and with similar capacity factors. BC wind projects are proposed for a
variety of terrains and regions, including wind swept foothills and easy build plains regions
similar to Alberta. BC also has an offshore wind regime.
To CEBC’s knowledge, the author of the Zapped Report did not consult with any experienced
BC or Canadian wind developers prior to stating opinions that BC wind is unreliable, more
intermittent than neighbouring jurisdictions, and has lower capacity factors and is more costly to
build. All of those false statements demonstrate a lack of understanding of contemporary wind
technology and the energy profiles of new generation of wind projects waiting for an opportunity
to bid supply of lowest cost power to the system.
BC’s wind energy potential is largely untapped and it is well positioned to bring on more wind
energy with its existing hydroelectric base and interconnections with other jurisdictions. The
2016 Pan Canadian Wind Integration Study (PCWIS) (https://canwea.ca/wp-
content/uploads/2016/10/pcwis-britishcolumbia-summary-web.pdf) found that BC could reliably
integrate up to 15,700 MW of wind energy capacity with minor transmission expansion and
limited additions to regulating reserves.
Wind energy also provides additional value to the province. As a major electricity exporter, BC
Hydro has an opportunity to bundle wind and hydro to deliver a product that meets green energy
requirements of states in the western US and earn additional revenue by accessing renewable
energy credits not available to large hydro alone. The PCWIS found that expanded deployment
12
Both Saskatchewan and Alberta contracted for significant additional new wind energy capacity in 2018 at an
average bid price of $42 and $39 per megawatt-hour, respectively, which is comparable to the record low average
bid price of $37 recorded in Alberta in late 2017. Wind energy figures prominently in these provinces’ progressive
strategies to increase renewable generation. Downward wind energy price trends were confirmed by a 2018 U.S.
analysis (Lazard 12.0) which found a further seven per cent year-over-year decline, and a 69 per cent decline since
2009.
23 | P a g eCEBC RESPONSE TO ZAPPED ALLEGATION OF OVERSPENDING BILLIONS ON IPPs
of wind energy in British Columbia could enable increased electricity exports and more revenue
for the province.
Wind projects can be deployed quickly and at a scale that matches load growth, creating less risk
for ratepayers. According to CanWEA, BC tax and royalty payments made by independent
power producers currently total $244 million a year, a figure that will grow as new projects are
brought on line. The distributed nature of renewable energy projects also produces local
economic development benefits, including opportunities for British Columbia’s 203 First
Nations.
Over the long-term, increased supplies of new zero-emission energy will be key to realizing the
province’s aggressive climate change goals. BC is targeting greenhouse gas reductions of at least
80 per cent below 2007 levels by 2050, a goal that can only be met through the long-term
electrification of the economy. This is clearly recognized in the province’s new Clean BC plan.
Wind energy is well-positioned to provide the reliable, low-cost, emissions-free electricity that
will drive that transition.
By strategically exploiting huge reserves of renewable energy resources, the province can build a
more resilient, geographically diverse, and affordable power system that will benefit BC families
and businesses for generations to come.
24 | P a g eCEBC RESPONSE TO ZAPPED ALLEGATION OF OVERSPENDING BILLIONS ON IPPs
Appendix 7.2
CEBC Solar Power Information Memo: Response to Zapped:
BC’s Solar Resource - Canada’s Best and Lowest Cost
New international solar research has determined that southern regions of British Columbia are
enriched with Canada’s best “commercial grade” Solar PV resource. BC’s potential for low-cost
solar energy is similar to Alberta, confirming utility-scale solar power is another important BC
renewable energy resource.
The new solar information distinguishing the significant potential of BC’s outstanding solar
resource was shared with Canada in 2018 by the US Department of Energy and its National
Renewable Energy Laboratory (NREL). This result is also confirmed by other international solar
development agencies.
The Zapped Report’s opinion that cloud cover and the aspect of the sun at our Northern latitude
makes BC solar “not worth considering” compared to other solar areas including Alberta is
misleading and unfounded. Zapped denigrates BC’s outstanding solar resource and is a
disservice to our province and electrical ratepayers. It further demonstrates a deep lack of
understanding of Solar PV technology and the beneficial reasons for solar's explosive growth.
Advancements in solar technology, and declines in cost to pennies a kilowatt hour, are two
reasons why more than 100,000 MW of utility-scale Solar PV projects are scheduled to be
constructed globally in 2019.
For reasons well understood, an unstoppable wave of solar power development is sweeping the
world. In Canada, the wave passed through Ontario several years ago, and more recently spread
west into other provinces with high solar irradiance values. In Alberta alone, there is now more
than 4,000 MW of utility-scale Solar PV projects representing an estimated $6 Billion in clean
technology investment proposed for system interconnection. In February of 2019, three solar
projects were awarded supply contracts in Alberta for a solar power price of 4.8 Cents per
kilowatt hour. Select regions of southern BC and Alberta share the same high solar irradiance
values. This bodes well for BC, as the next province which may experience the benefits of a new
generation of low-cost utility-scale Solar PV projects.
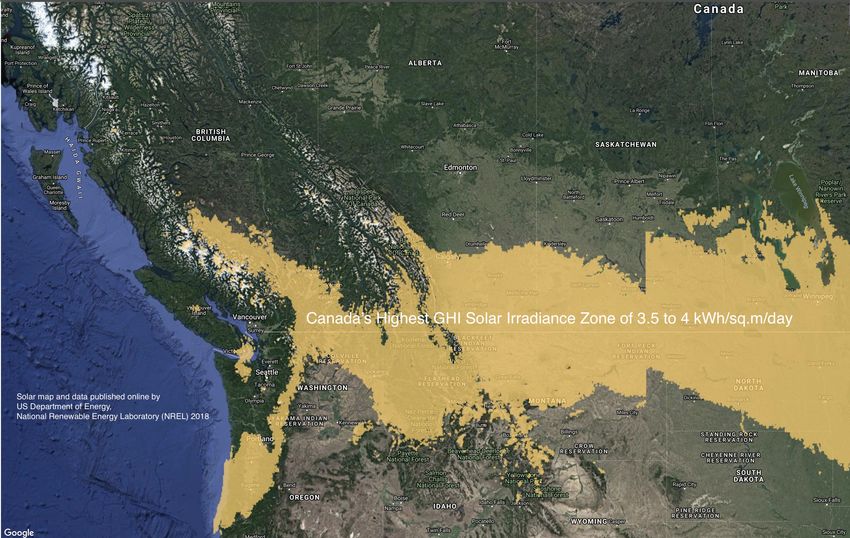
NREL in late 2018 published new North American continental Solar PV observation data and
mapping which covers BC north to the 60th Parallel. The solar mapping is based on 19 years of
satellite observation and other measurements. NREL’s solar observation data demonstrates that
BC’s top Global Horizontal Irradiance (GHI)13 solar zone has long-term average yield of 3.5 to 4
KWh/sq.m/day. This top BC solar irradiance zone is the same as the best of southern Alberta,
where a proposed 82 utility-scale solar projects are currently in the AESO interconnection queue.
NREL has made it clear that portions of southern BC and Alberta share the same exceptional
solar resource.
13
Global Horizontal Irradiance is the average amount of radiation from the sun received by a flat surface horizontal
to the ground. This value is important to Solar PV projects, and includes both Direct Normal Irradiance (DNI) and
Diffuse Horizontal Irradiance (DIF). DNI is solar radiation that comes in a straight line from the direction of the sun
at its current position in the sky. DIF is solar radiation that does not arrive on a direct path from the sun, but has
been scattered by particles in the atmosphere (ie. clouds).
25 | P a g eCEBC RESPONSE TO ZAPPED ALLEGATION OF OVERSPENDING BILLIONS ON IPPs
NREL is recognized as a global leader in solar power research and analysis, and is currently
sharing its solar observation data with Canada. The Canadian government has no comparable
program. NREL is staffed by more than 2,000 scientists, engineers and expert personnel - and is
supported under a US Department of Energy budget of $34.5 billion (2018 fiscal).
The great news about BC’s solar resource gets even better. When a solar panel in BC’s highest
value solar regions is tilted such that its surface is always perpendicular to the incoming solar
radiation, the new NREL results are truly amazing. Some BC locations in the Thompson Nicola,
Okanagan, Boundary and Kootenay regions have long-term average Direct Normal Irradiance
(DNI) values of 4.5 to 5 kWh/sq./m/day. (See Footnote 2). This highest Canadian and BC DNI
value zone is the same as much of the US midwest, eastern Atlantic and southern Gulf Coast
states. Solar panels mounted on racking with sun tracking technology seek to capture the
additional energy revealed by the DNI value.
Canada’s highest multi-year average GHI solar irradiance value zone of 3.5 to 4 kWh/sq.m/day is yellow in this 2019
NREL solar map. The map is created from new NREL data based on 19 years of satellite and other observation.
Regions of southern BC, Alberta and Saskatchewan share the same exceptional solar resource zone, which is the
best in Canada and northern US states.
In February 2019, three (3) Alberta utility-scale Solar PV projects with site irradiance values
same or similar to southern BC’s best solar areas were awarded 94 MW in power supply
contracts by the Government of Alberta at the stunning unsubsidized power price of 4.8 Cents a
kilowatt hour (kWh).
26 | P a g eCEBC RESPONSE TO ZAPPED ALLEGATION OF OVERSPENDING BILLIONS ON IPPs
According to the Canadian Solar Industries Association (CanSIA) the new Alberta solar price of
4.8 Cents/kWh represents a new low price for Canadian solar. The price is a lower Levelled Cost
of Electricity (LCOE) than the average annual wholesale price paid by the Alberta power pool to
combined cycle and single cycle natural gas fired electricity generation from 2008 to 2018.14
The future price for BC utility-scale Solar PV power located on BC’s best solar sites in the same
solar irradiance zone as the winning Alberta projects, and using the same technology, would be
expected to be similar in a competitive acquisition process.
What’s not to like about BC solar? The sun appears daily, regardless of season or weather.
Energy carrying “photons” arrive in BC in just 8 minutes, ready for conversion into low-cost
clean electricity to help meet daytime peak loads. Recent advances in battery storage
technologies hold the promise of extending solar power deliveries into evening hours – or for
other useful purposes. And the summer seasonal peak of BC solar energy generation is
complementary to the winter peak hours of BC wind power generation.
In 2019 alone, more than 100,000 MW of new Solar PV modules will be manufactured and
installed globally as the technology continues to improve and costs fall year-on-year. Solar has
high social acceptance, no discernible sound or GHG emissions, and a low visual profile. Solar
PV panels are a rapidly advancing clean technology without moving parts. And because Solar
PV is modular, projects can be constructed quickly without heavy equipment and scaled in size
from kilowatts to megawatts according to the need.
Enlightened with new BC solar data, there is no reason why our province can’t benefit from
advancements in Solar PV technology in a manner similar to Alberta. In 2018, Alberta’s solar
electricity generation exceeded 50 MW. A recent supply chain study of the solar electricity
sector in Alberta by Solas Energy Consulting Inc. found a potential of $4.1 billion in market
value and a labour force rising to 10,000 in 2030. BC’s solar developers have identified similar
opportunities in our province for new low-cost solar energy, investment and clean technology
jobs.
Many of the new Solar PV projects being developed in the US are located in states with similar
GHI and DNI values to BC and Alberta. The US electric power sector plans to add more than
4,000 MW of new solar capacity in 2019 and almost 6,000 MW of additional new solar in 2020,
a total increase of 32% from the operational capacity at the end of 2018. Because of this
increase, solar is forecast to be more than 2% of total US utility-scale generation in 2020.
The Zapped Report expressed the misinformed opinion that “there is little prospect of BC being
market competitive with solar…” and further that “BC should delay such projects until there is a
change in that market.” Fortunately for BC, the opinions are not correct. The good news is that
positive change has already occurred in the solar market. And BC utility-scale Solar PV may
now be considered one of our province’s lowest-cost clean power options.
14
CanSIA The Canadian Solar Industries Association (CanSIA) is a national trade association that represents the
solar energy industry throughout Canada.
27 | P a g eYou can also read