Pershing Square Capital Management, L.P - London Investor Meeting February 13, 2019 - Pershing Square ...
←
→
Page content transcription
If your browser does not render page correctly, please read the page content below
London Investor Meeting
                   February 13, 2019

Pershing Square Capital Management, L.P.
Disclaimer

 All information provided herein is for informational purposes only and should not be deemed as a recommendation to buy or sell any security mentioned. Pershing Square
 Capital Management, L.P. (“Pershing Square”) believes this presentation contains a balanced presentation of the performance of the portfolios it manages, including a general
 summary of certain portfolio holdings that have both over and under performed our expectations.

 This presentation contains information and analyses relating to all of the publicly disclosed positions over 50 basis points in the portfolio of Pershing Square Holdings, Ltd. (“PSH”
 or the “Company”) during 2018. Pershing Square may currently or in the future buy, sell, cover or otherwise change the form of its investments discussed in this presentation for
 any reason. Pershing Square hereby disclaims any duty to provide any updates or changes to the information contained herein including, without limitation, the manner or type
 of any Pershing Square investment.

 Past performance is not necessarily indicative of future results. All investments involve risk including the loss of principal. It should not be assumed that any of the transactions or
 investments discussed herein were or will prove to be profitable, or that the investment recommendations or decisions we make in the future will be profitable or will equal the
 investment performance of the investments discussed herein. Specific companies or investments shown in this presentation are meant to demonstrate Pershing Square’s active
 investment style and the types of industries and instruments in which we invest and are not selected based on past performance.

 The analyses and conclusions of Pershing Square contained in this presentation are based on publicly available information. Pershing Square recognizes that there may be
 confidential or otherwise non-public information in the possession of the companies discussed in the presentation and others that could lead these companies to disagree with
 Pershing Square’s conclusions. The analyses provided include certain statements, assumptions, estimates and projections prepared with respect to, among other things, the
 historical and anticipated operating performance of the companies. Such statements, assumptions, estimates, and projections reflect various assumptions by Pershing Square
 concerning anticipated results that are inherently subject to significant economic, competitive, legal, regulatory, and other uncertainties and contingencies and have been
 included solely for illustrative purposes. No representations, express or implied, are made as to the accuracy or completeness of such statements, assumptions, estimates or
 projections or with respect to any other materials herein. Any forward-looking statement contained in this presentation is subject to various risks and uncertainties. See also
 “Forward-Looking Statements” in Additional Disclaimers and Notes to Performance Results at the end of this presentation. All trademarks included in this presentation are the
 property of their respective owners.

 This document may not be distributed without the express written consent of Pershing Square and does not constitute an offer to sell or the solicitation of an offer to purchase
 any security or investment product. This presentation is expressly qualified in its entirety by reference to PSH’s prospectus which includes discussions of certain specific risk
 factors, tax considerations, fees and other matters, and its other governing documents.

 SEE ADDITIONAL DISCLAIMERS AND NOTES AT THE END OF THIS PRESENTATION FOR ADDITIONAL IMPORTANT INFORMATION

                                                                                          2
Agenda
Chairperson’s Introduction
2018 PSH Performance Review
Business & Organizational Update
Current Portfolio Update
Q&A
3Chairperson’s Introduction
Board of Directors of PSH
All directors are independent of Manager other than Nicholas Botta
Anne Farlow – Chairperson
Richard Battey
Nicholas Botta
William Scott
Bronwyn Curtis (as of April 2018)
Richard Wohanka (as of April 2018)
5PSH Board Process
Quarterly in-person meetings, telephonic meetings as needed
Review investment performance and portfolio
Review operational risk management
Shareholder register
Investor relations update
Expenses
Any regulatory matters
Additional matters
62018 Corporate Actions
✓ Elected two new independent directors, Bronwyn Curtis and
Richard Wohanka, to the PSH Board in April 2018
✓ Removed PSH’s 4.99% ownership limit in April 2018, which creates
the potential for additional demand for PSH shares
✓ Completed a $300 million company tender in May 2018 at a 20.5%
discount to NAV which reduced public shares outstanding by 9.5%
PSCM affiliates have purchased more than $520 million of PSH
shares in the open market since May 2018
The combination of the company tender and share purchase by PSCM
affiliates has reduced the free float of PSH by 24.5% since April 2018
7PSH Initiates a Quarterly Dividend
Beginning Q1 2019, PSH will pay a quarterly dividend of $0.10 per
share, a 2.5% yield at the current PSH share price1
✓ PSH’s current dividend yield is similar to that of the S&P 500
PSH is likely to continue investing primarily in companies in the
S&P 500
The average dividend yield of the S&P 500 is ~2.1%2
PSH’s dividend as a percent of NAV3 is 1.9% which is
comparable to the S&P 500 dividend yield
(1) PSH share price at close ($15.70) on the London Stock Exchange as of 2/12/2019
(2) As of 2/12/2019
(3) NAV per share ($21.57) as of 2/12/2019
8Benefits of a Quarterly Dividend
✓ Expands the universe of potential PSH investors who prefer
or require dividends as part of their investment strategy
✓ Dividend will represent return of capital at NAV which can be
reinvested in PSH shares at a discount to NAV
Optional dividend reinvestment program (“DRIP”) will facilitate
automatic reinvestment in PSH shares at market price
DRIP will create incremental demand for PSH shares
✓ Further emphasizes that PSH is an attractive alternative to a
S&P 500 portfolio
92018 PSH Performance Review
Pershing Square Holdings, Ltd. Annual Net Returns

                                                                                               Since 1/1/2013
                                   Year                                                      PSH         S&P 500
                                   2013                                                      9.6%         32.4%
                                   2014                                                     40.4%         13.7%
                                   2015                                                    (20.5%)         1.4%
                                   2016                                                    (13.5%)        11.9%
                                   2017                                                     (4.0%)        21.8%
                                   2018                                                     (0.7%)        (4.4%)
                            2019 YTD (2/12/2019)                                            24.7%          9.7%

 Past performance is not necessarily indicative of future results. All investments involve the possibility of profit and the risk of loss, including the loss of principal. Please
 see the additional disclaimers and notes to performance results at the end of this presentation.

                                                                                         11
2019 is Off to A Strong Start
1
Stock Price Performance incl. Dividends YTD (2/12/2019) Earnings Date
Restaurant Brands International 22.9% 2/11/2019
Automatic Data Processing 14.0% 1/30/2019
Chipotle Mexican Grill 37.5% 2/6/2019
Lowe's 8.2% 2/27/2019
Starbucks 8.9% 1/24/2019
Hilton Worldwide 3.5% 2/13/2019
United Technologies 16.4% 1/23/2019
The Howard Hughes Corporation 13.9% 2/28/2019
Fannie Mae Common Shares 140.6% 2/14/2019
Freddie Mac Common Shares 130.2% 2/14/2019
Fannie Mae Preferred Shares 34.6% 2/14/2019
Freddie Mac Preferred Shares 37.7% 2/14/2019
Note: The companies shown on this page reflect all of the companies in the portfolio of PSH as of February 12, 2019 that have been publicly disclosed through regulatory
filings or otherwise. Stock price performance is provided for illustrative purposes only and is not an indication of future returns of PSH.
Past performance is not necessarily indicative of future results. All investments involve the possibility of profit and the risk of loss, including the loss of principal. Please see the
additional disclaimers and notes to performance results at the end of this presentation.
12Substantial Outperformance in a Volatile Market
1
PSH Outperformance vs. S&P 500 in 2018 and YTD 2019 (2/12/2019)
1,500 bps
375 bps
2018 YTD (2/12/2019)
Net Returns 2018 YTD (2/12/2019)
PSH (0.7%) 24.7%
S&P 500 (4.4%) 9.7%
Past performance is not necessarily indicative of future results. All investments involve the possibility of profit and the risk of loss, including the loss of principal. Please see
the additional disclaimers and notes to performance results at the end of this presentation.
13Cumulative Net Returns Since Inception (1/1/04)
Pershing Square, L.P. Net Returns vs. S&P 500
through February 12, 2019
Data represents performance of PSLP, the fund managed by Pershing Square with the longest track record. Past performance is not necessarily indicative of future
results. All investments involve the possibility of profit and the risk of loss, including the loss of principal. Please see the additional disclaimers and notes to performance
results at the end of this presentation.
14Long-Term Performance in Up & Down Markets
Pershing Square, L.P.
Net Returns vs. S&P 500 (1/1/2004 through 1/31/2019)(1)
Past performance is not necessarily indicative of future results. All investments involve the possibility of profit and the risk of loss, including the loss of principal. Please see
the additional disclaimers and notes to performance results at the end of this presentation.
(1) Data represents performance of PSLP, the fund managed by Pershing Square with the longest track record. “Up” months and “down” months are defined as months in
which the closing price of the S&P 500 on the last business day of the relevant month was higher and lower, respectively, than the closing price of the S&P 500 on the last
business day of the immediately preceding month.
152018 Contributors (Gross Returns)
Contributors PSH
Chipotle Mexican Grill 6.2%
Automatic Data Processing 5.5%
Starbucks 3.3%
Accretion from Share Buyback1 2.1%
Lowe's 0.7%
All Other Positions 0.4%
Total Contributors 18.2%
Past performance is not necessarily indicative of future results. All investments involve the possibility of profit and the risk of loss, including the loss of principal. Each
position with contribution to returns of at least 50 basis points when rounded to the nearest tenth is shown separately. Positions with smaller contributions are
aggregated. The returns (and attributions) set forth above do not reflect certain fund expenses (e.g., administrative expenses). Please see the additional disclaimers and
notes to performance results at the end of this presentation.
(1) PSH executed a $300 million company tender at a 20.5% discount to NAV in May 2018. The positive impact on performance due to the tender (“accretion”) is
reflected above.
162018 Detractors (Gross Returns)
Detractors PSH
Fannie Mae & Freddie Mac (4.6%)
The Howard Hughes Corporation (3.6%)
Herbalife (Short) (3.3%)
Restaurant Brands International (2.2%)
United Technologies (2.2%)
All Other Positions (1.6%)
Total Detractors (17.5%)
Past performance is not necessarily indicative of future results. All investments involve the possibility of profit and the risk of loss, including the loss of principal. Each
position detracting 50 basis points or more from returns when rounded to the nearest tenth is shown separately. Positions detracting less than 50 basis points are
aggregated. The returns (and attributions) set forth above do not reflect certain fund expenses (e.g., administrative expenses). Please see the additional disclaimers and
notes to performance results at the end of this presentation.
17Long and Short Attribution (Gross Returns)
Pershing Square, L.P.
Long Short / Hedge
2004 61.6% (5.9%)
2005 53.7% (1.6%)
2006 36.9% (6.9%)
2007 (5.6%) 34.9%
2008 (23.2%) 11.6%
2009 60.5% (11.4%)
2010 43.8% (4.7%)
Pershing Square Holdings, Ltd.
2011 2.5% (2.1%)
2012 16.9% 1.1% Long Short / Hedge
2013 25.8% (12.0%) 2013 24.9% (11.9%)
2014 42.4% 5.8% 2014 44.7% 5.9%
2015 (9.3%) (5.6%) 2015 (13.7%) (5.6%)
2016 (7.1%) (1.1%) 2016 (11.0%) (1.1%)
2017 3.3% (3.4%) 2017 1.5% (4.1%)
2018 2.7% (2.7%) 2018 4.0% (3.3%)
2019 YTD 20.6% - 2019 YTD 24.9% -
Past performance is not necessarily indicative of future results. All investments involve the possibility of profit and the risk of loss, including the loss of principal. Please
see the additional disclaimers and notes to performance results at the end of this presentation. 2019 YTD performance as of 2/12/2019
Note: Because of a change in reporting methodology, HKD call options are included in short attributions from 2010 through 2014 and are included in long attribution for
2015 and 2016. The Allergan litigation reserve taken in 2016 and 2017 reduced the Long Attribution percentage in those years for both Pershing Square, L.P. and
Pershing Square Holdings, Ltd. by 0.6% and 1.3%, respectively.
18Total Assets Under Management
($ in millions) 12/31/2018 AUM 2/12/2019 AUM
Pershing Square, L.P. $946 $1,141
Pershing Square International, Ltd. 991 1,189
Pershing Square Holdings, Ltd. 3,833 4,781
Pershing Square II, L.P. 63 76
Total Core Fund AUM $5,833 $7,187
PS VI Funds (ADP Co-Investment Vehicle) 613 739
Total Firm AUM $6,446 $7,926
Assets under management are net of any capital redemptions (including crystallized performance fee/allocation, if any). No deductions are made for any capital redemptions if such
redemption amounts are to be immediately re-subscribed into the same Pershing Square fund. In July 2017, total NAV included Pershing Square VI, L.P. and Pershing Square VI
International, L.P., each feeder funds to Pershing Square VI Master, L.P., all of which operated collectively as a co-investment vehicle investing primarily in securities of (or otherwise
seeking to be exposed to the value of securities issued by) Automatic Data Processing, Inc. (collectively, “PSVI”) without double counting investments by any Core Fund in PSVI).
Pershing Square L.P., Pershing Square International, Ltd. and Pershing Square Holdings, Ltd. have investments totaling $97m; $102m and $422m, respectively, in the Pershing
Square VI Funds as of December 31, 2018 and $117m, $123m and $508m, respectively, as of February 12, 2019.
19Business and Organizational Update
Our 2018 Strategic Initiatives: What We Said

 Source: 2018 Annual Investor Dinner Presentation   21
Our 2018 Strategic Initiatives: What We Did

 1      Reduced headcount from 74 employees at peak to 38 employees today
        resulting in a more focused and investment-centric organization

 2      Opportunistically redeployed capital into four new investments that are
        aligned with our core investment principles

 3      Constructively engaged with our portfolio companies to drive long-
        term value creation*

 *Note: Additionally, Pershing Square was actively involved on the boards of Howard Hughes and Platform Specialty Products.

                                                                                   22
1 2018 Was A Year Of Transition Organizationally
Smaller investment-centric organization
Bill delegated day-to-day operational and investor relations duties to
other members of the firm
Minimal media footprint
Pershing Square Advisory Board
Added Dawn Lepore, former CEO and President of Drugstore.com Inc.
Added Ali Namvar, former investment team member
Board retirements: Marty Peretz and Ed Meyer
Moving to 787 11th Avenue in Q2 2019
231 Stable Path Ahead
Limited Organizational Change
We have the right team in place to compound our capital for years without
any meaningful headcount changes
Stable Capital Base
PSH represents ~67%1 of the equity of Pershing Square core funds and
71%1 of the assets under management (including PSH bond proceeds)
Consistent Execution
Our investment strategy has a long and successful track record
Adhering to our core investment principles has enabled us to outperform
the S&P 500 in a volatile market in 2018 and year-to-date in 2019
Past performance is not necessarily indicative of future results. All investments involve the possibility of profit and the risk of loss, including the loss of principal. Please see the
additional disclaimers and notes to performance results at the end of this presentation.
(1) Equity and assets under management as of 2/12/2019
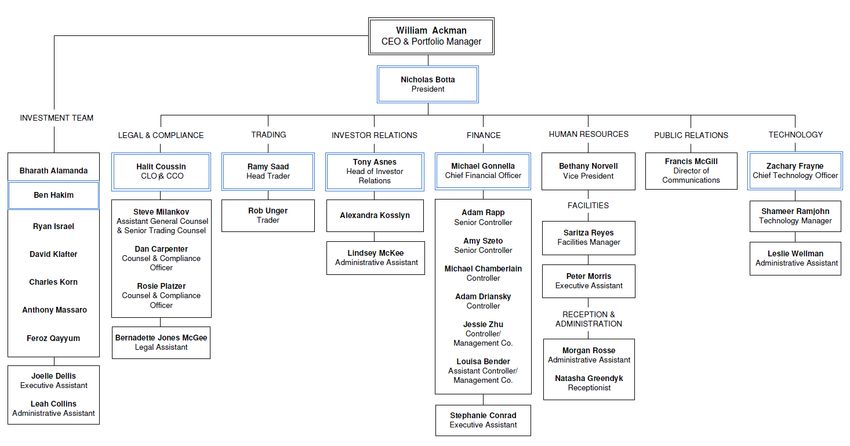
241 New Organizational Chart
251 Investment Team Bios
Career PSCM
Employee Education and Summary Prior Experience Experience Tenure
(Years) (Years)
William Ackman Gotham Partners, Co-founder and Portfolio Manager (1992 - 2003)
CEO / Portfolio M.B.A., Harvard Business School, 1992 29 15
Manager A.B., Harvard College, magna cum laude, 1988
Ryan Israel Goldman Sachs, Analyst (2007 - 2009)
B.S.E., The Wharton School, summa cum laude, beta gamma sigma, 2007 12 10
David Klafter Gotham Partners, General Counsel (1996 - 2004)
White & Case/Paskus Gordon & Mandel, Litigator (1982 - 1996)
39 8
Hon. Charles H. Tenney, Law Clerk (1980 - 1982)
J.D., NYU Law School, 1980; B.A., Northwestern University, phi beta kappa, 1976
Ben Hakim The Blackstone Group, Senior Managing Director (1999 - 2012)
PricewaterhouseCoopers, Associate (1997 - 1999) 21 7
B.S., Cornell University, 1997
Anthony Massaro Apollo Global Management, Private Equity Associate (2011 - 2013)
Goldman Sachs, Analyst (2009 - 2011) 10 6
B.S.E., The Wharton School, summa cum laude, beta gamma sigma, 2009
Charles Korn Kohlberg Kravis Roberts & Co., Private Equity Associate (2012 - 2014)
Goldman Sachs, Analyst (2010 - 2012) 9 5
B.A., The University of Western Ontario, Richard Ivey School of Business, Ivey Scholar, 2010
Bharath Alamanda Kohlberg Kravis Roberts & Co., Private Equity Associate (2015 - 2017)
Goldman Sachs, Analyst (2013 - 2015) 6 2
B.S.E, Princeton University, summa cum laude, phi beta kappa, 2013
Feroz Qayyum Hellman & Friedman, Private Equity Associate (2015 - 2017)
Evercore, Analyst (2013 - 2015) 6 2
B.A., The University of Western Ontario, Richard Ivey School of Business, Ivey Scholar, 2013
262 New Idea Generation Reflects Core Principles
New investments in 2018 are in high-quality, simple, predictable, free-cash-
flow-generative businesses with formidable barriers to entry
Free-Cash-Flow Formidable Compelling Highly Liquid
Simple &
-Generative Barriers to Value Mid/Large Cap
Predictable
(‘18E FCF)1 Entry Proposition (Market Cap)2
$7 bn
✓$ ✓$ $107 bn
$5 bn
✓$ ✓$ $80 bn
$2 bn
✓$ ✓$ $87 bn
$1 bn
✓$ ✓$ $22 bn
(1) FCF defined as net income plus depreciation and amortization less capex. Reflects Recently Exited Positions
calendar year 2018 actual figures for United Technologies and Starbucks, calendar
year 2018 estimate for Hilton and fiscal year 2018 estimate for Lowe’s.
(2) Market capitalization as of 2/12/2019
273 Creating Value Through Activism
In 2018, Pershing Square collaborated with our portfolio companies to
create long-term value
Constructively engaged with company as it accelerated its long-term
business transformation
Ali Namvar and Matthew Paull joined the board in December 2016
Brian Niccol, formerly CEO of Taco Bell, joined as CEO of Chipotle in
March 2018
Brian and his team have made significant progress turning around
Chipotle and reaccelerating growth
Shared our views on potential CEO candidates with search committee
Company recruited Marvin Ellison as CEO, our first choice candidate
Operational turnaround is underway
Privately engaged with management and highlighted the value creation
potential of a breakup of the company
In November 2018, the company announced its intention to separate into
three independent companies (Aerospace, Otis, and Carrier)
Note: Additionally, Pershing Square was actively involved on the boards of Howard Hughes and Platform Specialty Products.
28The Pershing Square Portfolio:
Higher Business Quality and Earnings Growth than Market
We expect our portfolio to compound earnings and intrinsic value at a much
higher rate than the market (analysis below excludes HHC, FNMA, FMCC)1,2
2019E EBIT Margin ‘18E - ‘20E EBIT Growth ‘18E - ‘20E EPS Growth
2 2 2
1 1 1
Our portfolio trades at a higher earnings multiple than the market, but we believe that it
undervalues the higher quality and stronger earnings growth of our portfolio companies
(1) Source: CapitalIQ consensus estimates. Excludes financials and real estate companies to remain consistent with exclusion of Howard Hughes, Fannie Mae and Freddie Mac from
Pershing Square comparable metrics. Excludes energy companies given Pershing Square generally does not invest in that sector.
(2) Source: PSCM estimates, financial metrics weighted by delta adjusted exposure. Excludes Howard Hughes, Fannie Mae and Freddie Mac given these companies do not trade on
traditional earnings metrics.
29The Pershing Square Portfolio:
Discounted Valuation at PSH
Share Price $64 $150 $594 $99 $70 $74 $124
Incl. 27%
$47 $109 $432 $72 $51 $54 $90
Discount1
NTM P / E Multiple by Portfolio Company2
49x
36x
23x 25x 26x 24x
17x 18x 16x 19x 17x 15x
12x 11x
QSR ADP CMG LOW SBUX HLT UTX
Current Current incl. 27% discount
(1) Reflects PSH share price discount to NAV as of 2/12/2019
(2) PSCM estimated multiples as of 2/12/2019. Excludes Howard Hughes, Fannie Mae and Freddie Mac given these companies do not trade on traditional earnings metrics
30Pershing Square Holdings vs. a Hedge Fund
Traditional Equity Hedge Fund Pershing Square Holdings
Short-term investment horizon Long-term investment horizon
Passive ownership Ability to effect change through activism
Short-term capital base Stable capital base
‘Mile wide, inch deep’ diversification Concentrated portfolio
Large gross exposures financed with Investment grade bond financing with
leverage with MTM1 covenants no MTM1 covenants
No capital return Quarterly dividend and buybacks
Limited transparency Weekly NAV updates and quarterly
investor calls
Narrow base of potential investors Dual listing (LSE & Euronext Amsterdam)
(1) Mark-to-market 31PSH is an Investment Holding Company
✓ The Pershing Square investment strategy has a long-term track record
PSLP’s compound annual net return, since inception in 2004, is 13.8% vs. 8.4%
for the S&P 500 over the same period1
✓ PSH’s current 27% discount to NAV implies a 0.73x price / book value ratio1
In our view, a business with a long-term return on equity of ~14% should trade
significantly above 0.73x price / book value
(1) Net return and PSH discount to NAV as of 2/12/2019
Past performance is not necessarily indicative of future results. All investments involve the possibility of profit and the risk of loss, including the loss of principal. Please see the
additional disclaimers and notes to performance results at the end of this presentation. Data represents performance of PSLP, the fund managed by Pershing Square with the
longest track record.
32Pershing Square Holdings vs. the S&P 500
We Believe PSH is an Attractive Alternative to the S&P 500
✓ Access to a portfolio of high-quality, simple, predictable, free-cash-flow-
generative, generally large cap U.S. companies at a 27% discount to NAV1
✓ In light of the discount to NAV, the ‘look-through’ earnings multiple of the PSH
portfolio is similar to that of the S&P 500 despite earnings growth well in excess
of the S&P 500
✓ We typically invest in conservatively financed, non-cyclical, economically
resilient businesses which tend to outperform in volatile market environments
✓ Activism can drive meaningful improvements to the operating performance of
companies unlike passive investing
✓ Investors do not pay an incentive fee until PSH achieves ~22% NAV appreciation1
PSCM affiliates have purchased more than $520 million of PSH shares in the open
market since May 2018. This investment demonstrates our confidence in the
undervaluation of PSH and its long-term potential.
(1) As of 2/12/2019
33Current Portfolio Update
Chipotle Mexican Grill (“CMG”)
Chipotle is now executing on its vast unrealized growth potential
2018 was a year of organizational transformation
Brian Niccol, formerly CEO of Taco Bell, joined Chipotle as CEO in March
Executive team strengthened with external hires in the roles of Chief Marketing
Officer, Chief People Officer, Chief Legal Officer, and Chief Development Officer
Corporate restructuring including HQ relocation and the elimination of two layers of
management
Introduction of “stage-gate” process to test, learn, and iterate on new initiatives
Reigniting same-store sales growth is the key priority for 2019
Key growth levers identified for digital, marketing, menu, and operations
Early signs that the new strategy is working have already emerged
SSS growth of 6.1% in Q4, including traffic growth of 2.0%1
Robust customer response to “For Real” marketing campaign in October, delivery
partnership with DoorDash, and the launch of Lifestyle Bowls in January
(1) Source: Company filings
35Pershing Square’s Constructive Activism
Sept. 6, 2016 Pershing Square files 13D announcing ~10% stake in Chipotle
Chipotle names Steve Ells sole CEO concurrent with the resignation
Dec. 12, 2016 of former co-CEO Monty Moran
Chipotle announces a board refresh in which four new directors are
Dec. 16, 2016 named, including Ali Namvar and Matthew Paull
Chipotle announces that four legacy directors will not stand for
Mar. 17, 2017 re-election; board size reduced to eight
Chipotle announces search for new CEO with Ali Namvar a member
Nov. 29, 2017 of the three-person search committee; founder Steve Ells to become
Executive Chairman
Chipotle names Brian Niccol as CEO and a member of the board,
Feb. 13, 2018 effective March 5; board size increased to nine
36CMG Share Price Performance Since Inception
CMG’s share price increased 49% in 2018 and 37% year-to-date in 20191
CMG share price performance from 8/4/2016 to 2/12/2019
9/6/16: Pershing Square $594
12/16/16: CMG announces four new
files 13D after market directors added to its now 12-person board,
close with 9.9% including Ali Namvar and Matthew Paull
economic ownership
11/29/17: CMG announces
search for new CEO; founder
Steve Ells to become
Share price
Executive Chairman
$405*
4/25/18: CMG reports
Q1’18 earnings and hosts
first call with Niccol
12/12/16: Steve
Ells named sole
CEO; Monty 2/28/18: PSH purchased an
2/13/18: CMG names Brian Niccol additional $134mm of CMG shares
Moran resigns
as CEO effective March 5
Note: The performance of CMG’s share price is provided for illustrative purposes only and is not an indication of future returns of the Pershing Square funds.
*Average cost at announcement date. Please see the additional disclaimers and notes to performance results at the end of the presentation.
(1) As of 2/12/2019
37Automatic Data Processing (“ADP”)
ADP is substantially transforming its business
ADP has accelerated numerous transformation initiatives
Accelerating Service Alignment Initiative (cost cutting and facilities consolidation program)
Announced Early Retirement Program
Accelerating roll-out of Next Gen (Enterprise / large corporation) product offering
Strengthening talent and performance culture, aligning management objectives around
ADP’s business transformation (e.g. establishment of a Transformation Office)
Achieving new mid-term targets will drive significant EPS growth
Guidance implies ~$7 of EPS in FY2021 vs. ~$4 at the time of our initial investment
Targeting 23% to 25% EBIT margins vs. structural potential of ~32%1
New targets still only capture a fraction of ADP’s full potential
We believe that achieving ADP’s structural potential will drive
substantial shareholder value
ADP trades at ~24x earnings – a discount to historical levels – despite
improved organic growth and accelerated EPS growth
(1) As supported by our due diligence published throughout the proxy contest, including ADP: The Time is Now (August 2017) and ADP Ascending (October 2017).
38ADP Share Price Performance Since Inception
ADP’s share price including dividends increased 14% in 2018 and 14%
year-to-date in 20191
ADP share price performance from 5/10/2017 to 2/12/2019
6/12/18: ADP hosts Analyst
Day; increases long-term
earnings target $150
3/1/18: ADP announces
8/17/17: PSCM hosts initial voluntary early
ADP webcast laying out
Share price
retirement program
the long-term opportunity
for improvement at ADP
$105*
11/7/17: ADP
shareholder vote
Note: The performance of ADP’s share price is provided for illustrative purposes only and is not an indication of future returns of the Pershing Square funds.
*Average cost at announcement date. Please see the additional disclaimers and notes to performance results at the end of the presentation.
(1) As of 2/12/2019
39Restaurant Brands International (“QSR”)
QSR is a high-quality business with significant long-term growth
potential trading at a discounted valuation
Continued strong business performance in 2018
Net unit growth of 5%, including 6% at Burger King1
Healthy same-store-sales growth at Burger King (+2%) and modest growth
at Tim Hortons (+1%)1
▪ Tim Hortons growth of 2% in Q4 represents accelerating sales momentum
Organic EBITDA growth of 5% and EPS growth in excess of 30%
Remains cheap relative to intrinsic value and peers
Trades at ~22x our estimate of 2019 free cash flow per share, a discount
to peers
Free option on future value-creating acquisitions
Inaugural investor day in May to highlight QSR’s unique long-term unit growth opportunity
(1) Source: Company filings
40QSR Share Price Performance Since Inception
QSR’s share price including dividends decreased 12% in 2018 and
increased 23% year-to-date in 20191
QSR share price performance from 6/19/2012 to 2/12/2019
2/1/17: QSR announces
acquisition of Popeyes $64
Share price
1/23/19: QSR announces leadership
8/24/14: QSR transition, elevating Daniel Schwartz to
announces acquisition Executive Chairman and Jose Cil to CEO
of Tim Hortons
$16*
Note: The performance of QSR’s share price is provided for illustrative purposes only and is not an indication of future returns of the Pershing Square funds.
*Average cost since it merged with Justice Holdings. Please see the additional disclaimers and notes to performance results at the end of the presentation.
(1) As of 2/12/2019
41Lowe’s (“LOW”)
Lowe’s is a high-quality business with strong new leadership that is
committed to narrowing the performance gap with Home Depot
New management team has relevant track record of success
New CEO Marvin Ellison played important role in turnaround at Home Depot
New leadership team includes several former Home Depot executives
Credible plan to narrow the performance gap with Home Depot
Lowe’s current EBIT margin is 9.3% versus 14.5% at Home Depot 1
Management targets a 12% EBIT margin over the medium-term1
We believe further upside to margins and sales productivity is likely over time
Secular housing trends support long-term growth and reduce cyclicality
Key housing metrics remain below long-term average levels
Aging housing stock (~30yrs) requires significant repair and maintenance
Lowe’s derives a large portion of its revenue from repair and maintenance
(1) Source: Company filings, Analyst Day Presentation (December 2018)
42LOW Share Price Performance Since Inception
LOW’s share price including dividends increased 8% from our average
cost at inception to December 31, 2018, and 8% year-to-date in 20191
LOW share price performance from 4/6/2018 to 2/12/2019
Housing data
indicates a recent
slowdown in the
market
8/22/18: LOW holds Q2 earnings
call; CEO Ellison provides initial 12/12/18: LOW holds Analyst Day.
observations and commentary on Introduces new long-term plan
the substantial opportunity for focused on executing against
long-term improvement at Lowe’s retail fundamentals. Announces a
Share price
$10bn share repurchase program
$99
5/22/18: Lowe’s announces the
hiring of ex-HD executive
Marvin Ellison as CEO
$86*
Note: The performance of Lowe’s share price is provided for illustrative purposes only and is not an indication of future returns of the Pershing Square funds.
*Average cost at announcement date. Please see the additional disclaimers and notes to performance results at the end of the presentation.
(1) As of 2/12/2019 43Starbucks (“SBUX”)
We expect Starbucks to compound long-term earnings at a high rate
driven by strong secular growth and outstanding unit economics
Dominant brand in the growing and attractive specialty coffee category
Loyal customer base with frequent consumption habit and trade-up potential
Wide competitive moat with advantages over low-cost and boutique players
Long runway for reinvesting free cash flow at exceptional rates of return
Pretax returns on new units of ~55% in the U.S. and ~75% in China
Long-term HSD revenue growth underpinned by international unit growth
New leadership is simplifying the business and driving improved results
Bold actions taken to realign the portfolio, reduce overhead, and return cash
Share buybacks of ~$20bn or ~20% of shares outstanding from 2018-2020
Reacceleration in SSS in the last two quarters driven by beverage innovation
Despite meaningful share price appreciation since our investment, SBUX still trades at a
discount to its average valuation over the last several years
(1) Source: Company filings
44SBUX Share Price Performance Since Inception
SBUX’s share price including dividends increased 27% from our average
cost at inception to December 31, 2018, and 9% year-to-date in 20191
SBUX share price performance from 7/13/2018 to 2/12/2019
11/1/18: SBUX reports fiscal Q4
earnings with U.S. SSS of +4% after
four quarters of 1-2% growth $70
10/9/18: Pershing Square announces
investment in SBUX and presents
Share price
thesis at investor conference
12/13/18: SBUX hosts
biennial investor day
$51*
Note: The performance of SBUXs share price is provided for illustrative purposes only and is not an indication of future returns of the Pershing Square funds.
*Average cost at announcement date. Please see the additional disclaimers and notes to performance results at the end of the presentation.
(1) As of 2/12/2019
45Hilton Worldwide (“HLT”)
Hilton is a high-quality, asset-light, high-margin business with
significant growth potential led by a superb management team
Collection of scaled brands and loyalty program create strong network effects
for consumers and cost and revenue advantages for hotel owners
Industry-leading development pipeline amounts to 40% of current rooms1
6% to 7% annual net unit growth allows for earnings growth even if RevPar
temporarily declines
Strong secular trends towards travel underpin long-term RevPar growth
Attractive relative and absolute valuation
Hilton trades at ~22x 2019 free cash flow, a modest valuation in light of high
business quality and mid-teens long-term earnings growth profile
Current valuation near the lowest valuation since the spin-off in early 2017
(1) Source: Company filings
46HLT Share Price Performance Since Inception
HLT’s share price including dividends decreased 2% from our average
cost at inception to December 31, 2018, and increased 4% year-to-date in
20191
HLT share price performance from 10/8/2018 to 2/12/2019
10/24/18: HLT Q3 2018 earnings call.
Reported US RevPAR of +1% falls short of
expectations. While management believes
this an aberration, investors react negatively
to the perception of a slowing lodging cycle
Share price
$74
$73*
Note: The performance of HLT’s share price is provided for illustrative purposes only and is not an indication of future returns of the Pershing Square funds.
*Average cost at announcement date. Please see the additional disclaimers and notes to performance results at the end of the presentation.
(1) As of 2/12/2019
47United Technologies (“UTX”)
High-quality industrial conglomerate with market-leading
businesses in aerospace, elevators and HVAC
Undergoing transformative change
Recently announced three-way business separation likely to occur in 1H 2020
Recently acquired Rockwell Collins, creating the premiere aerospace supplier
Highly-defensible business portfolio generated strong growth in 2018
8% organic revenue growth and 14% EPS growth1
Multi-year order backlog and long-term service contracts underpin future
growth and moderate cyclicality
Limited impact to input costs from recent tariffs
Significantly undervalued relative to peers and intrinsic value
Current sum-of-the-parts discount: ~30%2
Trades at only 14x P/E3 despite double-digit long-term EPS growth and high
business quality
Upcoming business separation should be a catalyst for significant share price appreciation
(1) Source: Company filings
(2) Weighted by profit exposure; peers include: Honeywell, Safran, Transdigm, Rolls-Royce, Schindler, Kone, Ingersoll-Rand, Lennox and Johnson Controls
(3) Pro Forma for Rockwell Collins synergies and excluding amortization of acquisition-related intangibles
48UTX Share Price Performance Since Inception
UTX’s share price including dividends decreased 16% from our average
cost at inception to December 31, 2018, and increased 16% year-to-date
in 20191
UTX share price performance from 2/6/2018 to 2/12/2019
5/17/2018: Pershing Square releases 11/26/2018: UTX completes acquisition
investor letter outlining investment thesis of Rockwell Collins and announces
and recommending a three-way business intention to separate into three
separation to unlock fair value independent companies
Share price
$130*
$124
2/28/2018: Rumors of 11/23/2018: UTX obtains final
Pershing Square’s regulatory approval for
investment first reported Rockwell Collins acquisition
in the media
Note: The performance of UTX’s share price is provided for illustrative purposes only and is not an indication of future returns of the Pershing Square funds.
*Average cost at announcement date. Please see the additional disclaimers and notes to performance results at the end of the presentation.
(1) As of 2/12/2019
49Howard Hughes Corporation (“HHC”)
Self-funded, fully integrated real estate developer with seasoned
management team, proven track record, and world-class assets
Master Planned Communities (“MPC”)
Controlled MPCs in desirable locations create substantial cash flow from
ongoing residential land sales
Recently reported the highest MPC residential land sales in HHC’s history
Strategic Developments
50 million square fee of development entitlements within existing portfolio
Since launching Ward Village pre-sales in 2014, sold more than 1,900 condo
units with total proceeds of over $2.2 billion at projected 30% gross margins
Nearing completion of vision for the Seaport District as one of NYC’s most
vibrant fashion and entertainment destinations
Operating Assets
Highly diversified portfolio of operating assets provide consistent cash flows
Increased Operating Asset net operating income 25% from Q417 to 3Q18 1
Despite significant business progress and record land sales, HHC’s share price underperformed in
2018 (like homebuilders) as the market focused on potential housing headwinds
(1) Source: Company filings 50HHC Share Price Performance Since Inception
HHC’s share price decreased 26% in 2018 and increased 14% year-to-
date in 20191
HHC’s share price performance from 11/9/2010 to 2/12/2019
Share price
$111
$37*
Note: The performance of HHC’s share price is provided for illustrative purposes only and is not an indication of future returns of the Pershing Square funds.
*Average cost at announcement date. Please see the additional disclaimers and notes to performance results at the end of the presentation.
(1) As of 2/12/2019
51Fannie Mae (“FNMA”) and Freddie Mac (“FMCC”)
We believe that there is near-term potential for a favorable
resolution of the status of Fannie and Freddie
Recent developments have increased the likelihood of a resolution
Treasury Secretary Mnuchin has cited GSE reform as a priority for 2019
Taxpayer investment of $191bn fully repaid with 10%+ annual return
Newly divided Congress increases the odds of administration-led reform
New Trump-appointed leadership at FHFA, with Joseph Otting serving
as Acting Director while Mark Calabria awaits Senate confirmation
These developments have driven a sharp recovery in Fannie and
Freddie shares in 2019
Common and preferred shares now trade roughly in-line with year-end
2017 levels
Last year’s weakness was primarily driven by investor frustration at the
lack of progress on housing finance reform efforts in Congress
Additional headwinds in 2018 from forced selling by certain investment
firms that wound down operations, as well as tax loss selling at year-end
52FNMA and FMCC: Path Towards Reform
The dialogue around GSE reform in both the administration
and Congress has intensified over the last few weeks
We continue to believe that any proposal for housing finance reform
must satisfy the following conditions in order to succeed
Simplicity to ensure broad support and minimize systemic risk
Appealing investment proposition to raise new private capital, including
visibility into long-term earnings power
Fair treatment of current investors in Fannie and Freddie in order for new
private capital to be raised
We believe the administration will act expeditiously while the window
of opportunity for GSE reform remains open
Robust economy with ~3% GDP growth, unemployment at record lows,
and national home prices above the 2006 peak
Stock market indices near all-time highs, even after late 2018 declines
Presidential election year in 2020
Opportunity for Treasury to exercise its warrants and utilize the ~$150bn+
of future proceeds to fund key priorities
53FNMA and FMCC Performance Since Inception
FNMA and FMCC share prices decreased 60% and 58%, respectively, in 2018
and increased 141% and 130%, respectively, year-to-date in 20191
FNMA and FMCC share price performance from 10/7/2013 to 2/12/2019
5/5/14: Pershing Square 12/21/17: Letter agreement between 12/20/18: Otting named Acting
presents investment thesis at Treasury and FHFA that increases the Director of FHFA effective Jan.
Ira Sohn conference capital reserve amount for FNMA and FMCC 7 until Calabria is confirmed
from zero to $3bn from 1/1/18 onwards by Senate
1/18/19: Press reports
re: FHFA plan to take
Share price
the GSEs out of
11/8/16: Donald Trump
conservatorship
wins presidential election
$2.55
$2.44
$2.29*
$2.14*
9/30/14: US District 2/21/17 US Court of
Court ruling in Appeals ruling in 12/11/18: Trump nominates
Perry litigation Perry litigation Calabria to lead FHFA
Note: The performance of FNMA’s and FMCC’s share prices is provided for illustrative purposes only and is not an indication of future returns of the Pershing Square funds.
*Average cost at announcement date of $2.29 for FNMA and $2.14 for FMCC. Please see the additional disclaimers and notes to performance results at the end of the presentation.
(1) As of 2/12/2019 54The Pershing Square Portfolio:
We Believe Our Portfolio Has Substantial Upside
Company Summary Investment Thesis
Capital-light, growing royalty stream from leading restaurant brands with high long-
term unit growth
Defensive, high-growth business with substantial margin expansion with business
transformation underway
New world-class management team in the early innings of executing on the brand’s
vast unrealized growth potential
High-quality business narrowing the performance gap with Home Depot, which
should drive significant earnings growth and potential multiple expansion
Category killer in specialty coffee with high long-term earnings growth, supported by
strong secular growth and outstanding unit economics
High-quality, asset-light business with long-term earnings growth, driven by strong
secular trends in travel and embedded unit growth
Trading at ~30% discount to peers on a sum-of-the-parts basis despite upcoming
business separation and strong underlying business performance
Trading at >30% discount to the average Wall Street analyst’s price target with
continued strong business progress
Common and preferred shares trade roughly in-line with year-end 2017 levels despite
recent developments that have increased the likelihood of GSE reform
Note: The companies shown on this page reflect all of the companies in the portfolio of PSH as of February 12, 2019 that have been publicly disclosed through regulatory filings or
otherwise. 55Q&A
Additional Disclaimers and Notes to Performance Results
  The performance results of PSH and Pershing Square, L.P., the Pershing Square fund with the longest performance track record, included in this presentation are presented on a gross
  and net-of-fees basis. Gross and net performance include the reinvestment of all dividends, interest, and capital gains, and reflect the deduction of, among other things, brokerage
  commissions and administrative expenses. Net performance reflects the deduction of management fees and accrued performance fee/allocation, if any. All performance provided herein
  assumes an investor that has been in the Pershing Square funds since their respective inception dates and participated in any "new issues," as such term is defined under Rules 5130 and
  5131 of FINRA. Depending on timing of a specific investment and participation in “new issues,” net performance for an individual investor may vary from the net performance as stated
  herein. Performance data for 2018 is estimated and unaudited.

  Pershing Square, L.P.’s net returns for 2004 were calculated net of a $1.5 million (approximately 3.9%) annual management fee and performance allocation equal to 20% above a 6%
  hurdle, in accordance with the terms of the limited partnership agreement of Pershing Square, L.P. then in effect. That limited partnership agreement was later amended to provide for a
  1.5% annual management fee and 20% performance allocation effective January 1, 2005. The net returns for Pershing Square, L.P. set out in this document reflect the different fee
  arrangements in 2004, and subsequently. In addition, pursuant to a separate agreement, in 2004 the sole unaffiliated limited partner paid Pershing Square an additional $840,000 for
  overhead expenses in connection with services provided unrelated to Pershing Square, L.P. which have not been taken into account in determining Pershing Square, L.P.'s net returns. To
  the extent such overhead expenses had been included in fund expenses, net returns would have been lower.

  The market index shown in this presentation, the S&P 500, has been selected for purposes of comparing the performance of an investment in the Pershing Square funds with a well-
  known, broad-based equity benchmark. The statistical data regarding the index has been obtained from Bloomberg and the returns are calculated assuming all dividends are reinvested.
  The index is not subject to any of the fees or expenses to which the Pershing Square funds are subject. The funds are not restricted to investing in those securities which comprise this
  index, their performance may or may not correlate to the index and it should not be considered a proxy for the index. The volatility of an index may materially differ from the volatility of
  the Pershing Square funds’ portfolio. The S&P 500 is comprised of a representative sample of 500 large-cap companies. The index is an unmanaged, float-weighted index with each
  stock's weight in the index in proportion to its float, as determined by Standard & Poors. The S&P 500 index is proprietary to and is calculated, distributed and marketed by S&P Opco,
  LLC (a subsidiary of S&P Dow Jones Indices LLC), its affiliates and/or its licensors and has been licensed for use. S&P® and S&P 500®, among other famous marks, are registered
  trademarks of Standard & Poor's Financial Services LLC. © 2015 S&P Dow Jones Indices LLC, its affiliates and/or its licensors. All rights reserved.

  The performance attributions to the gross returns provided on pages 16 and 17 are for illustrative purposes only. On page 16, each position with contribution to returns of at least 50
  basis points (when rounded to the nearest tenth) is shown separately. Positions with smaller contributions are aggregated. On page 17, each position detracting 50 basis points (when
  rounded to the nearest tenth) or more from returns is shown separately. Positions detracting less than 50 basis points are aggregated. Returns were calculated taking into account
  currency hedges, if any. At times, Pershing Square may engage in hedging transactions to seek to reduce risk in the portfolio, including investment specific hedges that do not relate to
  the underlying securities of the company in which the Pershing Square funds are invested. Unless otherwise noted herein, gross returns include (i) only returns on the investment in the
  underlying company and the hedge positions that directly relate to the securities that reference the underlying company (e.g., if Pershing Square, L.P. was long Company A stock and also
  purchased puts on Company A stock, the gross return reflects the profit/loss on the stock and the profit/loss on the put); (ii) do not reflect the cost/benefit of hedges that do not relate to
  the securities that reference the underlying company (e.g., if Pershing Square, L.P. was long Company A stock and short Company B stock, the profit/loss on the Company B stock is not
  included in the gross returns attributable to the investment in Company A); and (iii) do not reflect the cost/benefit of portfolio hedges. These gross returns do not reflect deduction of
  management fees and accrued performance fee/allocation. These returns (and attributions) do not reflect certain other fund expenses (e.g., administrative expenses). Inclusion of such
  fees/allocations and expenses would produce lower returns than presented here. Please refer to the net performance figures presented on page 11 of this presentation.

  Share price performance data takes into account the issuer’s dividends, if any. Share price performance data is provided for illustrative purposes only and is not an indication of actual
  returns to the Pershing Square funds over the periods presented or future returns of the funds. Additionally, it should not be assumed that any of the changes in shares prices of the
  investments listed herein indicate that the investment recommendations or decisions that Pershing Square makes in the future will be profitable or will generate values equal to those of
  the companies discussed herein. All share price performance data calculated “to date” is calculated through February 12, 2019.

  Average cost basis is determined using a methodology that takes into account not only the cost of outright purchases of stock (typically over a period of time) but also a per share cost of
  the shares underlying certain derivative instruments acquired by Pershing Square to build a long position. "Average Cost" reflects the average cost of the position that has been built
  over time as of the “Announcement Date” which is the date the position was first made public.

  The average cost basis for long positions has been calculated based on the following methodology:
        (a) the cost of outright purchase of shares of common stock is the price paid for the shares on the date of acquisition divided by the number of shares purchased;
        (b) the cost of an equity swap is the price of the underlying share on the date of acquisition divided by the number of underlying shares;
        (c) the cost of an equity forward is the reference price of the forward on the date of acquisition divided by the number of underlying shares;
        (d) the cost of call options that were in the money at the time of announcement is (except when otherwise noted) (i) the option price plus the strike price less any rebates the
        Pershing Square funds would receive upon exercise divided by (ii) the number of shares underlying the call options;
        (e) call options that are out of the money at the time of announcement are disregarded for purposes of the calculation (i.e., the cost of the options acquired are not included in the
        numerator of the calculation and the underlying shares are not included in the denominator of the calculation);
        (f) the cost of shares acquired pursuant to put options sold by the Pershing Square funds, where the underlying stock was put to the Pershing Square funds prior to the time of
        announcement, is (i) the strike price of the put options paid when the shares were put to the Pershing Square funds less the premium received by the Pershing Square funds when
        the put was sold divided by (ii) the number of shares received upon exercise of the put options; and
        (g) premium received from put options written by the Pershing Square funds where the underlying stock was not put to the Pershing Square funds, and the option was out-of-the
        money at the time of announcement are included in the numerator of the calculation.

                                                                                             57
Additional Disclaimers and Notes to Performance Results
Past performance is not necessarily indicative of future results. All investments involve the possibility of profit and the risk of loss, including the loss of principal. This presentation does
not constitute a recommendation, an offer to sell or a solicitation of an offer to purchase any security or investment product. Nothing contained herein constitutes investment, legal, tax
or other advice nor is it to be relied on in making an investment or other decision. All information is current as of the date hereof and is subject to change in the future.
Forward-Looking Statements
This presentation also contains forward-looking statements, which reflect Pershing Square’s views. These forward-looking statements can be identified by reference to words such as
“believe”, “expect”, “potential”, “continue”, “may”, “will”, “should”, “seek”, “approximately”, “predict”, “intend”, “plan”, “estimate”, “anticipate” or other comparable words. These
forward-looking statements are subject to various risks, uncertainties and assumptions. Accordingly, there are or will be important factors that could cause actual outcomes or results to
differ materially from those indicated in these statements. Should any assumptions underlying the forward-looking statements contained herein prove to be incorrect, the actual outcome
or results may differ materially from outcomes or results projected in these statements. None of the Pershing Square funds, Pershing Square or any of their respective affiliates
undertakes any obligation to update or review any forward-looking statement, whether as a result of new information, future developments or otherwise, except as required by applicable
law or regulation.
Risk Factors
Investors in PSH may lose all, or substantially all, of their investment in PSH. Any person acquiring shares in PSH must be able to bear the risks involved. These include, among other
things, the following:
• PSH is exposed to a concentration of investments, which could exacerbate volatility and investment risk;
• Activist investment strategies may not be successful and may result in significant costs and expenses;
• Pershing Square may fail to identify suitable investment opportunities. In addition, the due diligence performed by Pershing Square before investing may not reveal all relevant facts in
connection with an investment;
• While Pershing Square may use litigation in pursuit of activist investment strategies, Pershing Square itself and PSH may be the subject of litigation or regulatory investigation;
• Pershing Square may participate substantially in the affairs of portfolio companies, which may result in PSH’s inability to purchase or sell the securities of such companies;
• PSH may invest in derivative instruments or maintain positions that carry particular risks. Short selling exposes PSH to the risk of theoretically unlimited losses;
• PSH’s non-U.S. currency investments may be affected by fluctuations in currency exchange rates;
• Adverse changes affecting the global financial markets and economy may have a material negative impact on the performance of PSH’s investments;
• Changes in laws or regulations, or a failure to comply with any laws and regulations, may adversely affect PSH’s business, investments and results of operations;
• Pershing Square is dependent on William A. Ackman;
• PS Holdings Independent Voting Company Limited controls a majority of the voting power of all of PSH’s shares;
• PSH shares may trade at a discount to NAV and their price may fluctuate significantly and potential investors could lose all or part of their investment;
• PSH is exposed to changes in tax laws or regulations, or their interpretation; and
• PSH may invest in United States real property holding corporations which could cause PSH to be subject to tax under the United States Foreign Investment in Real Property Tax Act.
58You can also read