Discussion Paper No. 2020-08 - Zahra Murad and Chris Starmer - University of Nottingham
←
→
Page content transcription
If your browser does not render page correctly, please read the page content below

Discussion Paper No. 2020-08

Zahra Murad and
Chris Starmer Confidence Snowballing and
 Relative Performance Feedback
 May 2020

 CeDEx Discussion Paper Series
 ISSN 1749 - 3293
The Centre for Decision Research and Experimental Economics was founded in
2000, and is based in the School of Economics at the University of Nottingham.

The focus for the Centre is research into individual and strategic decision-making
using a combination of theoretical and experimental methods. On the theory side,
members of the Centre investigate individual choice under uncertainty,
cooperative and non-cooperative game theory, as well as theories of psychology,
bounded rationality and evolutionary game theory. Members of the Centre have
applied experimental methods in the fields of public economics, individual choice
under risk and uncertainty, strategic interaction, and the performance of auctions,
markets and other economic institutions. Much of the Centre's research involves
collaborative projects with researchers from other departments in the UK and
overseas.

Please visit http://www.nottingham.ac.uk/cedex for more information about
the Centre or contact

Suzanne Robey
Centre for Decision Research and Experimental Economics
School of Economics
University of Nottingham
University Park
Nottingham
NG7 2RD
Tel: +44 (0)115 95 14763
suzanne.robey@nottingham.ac.uk

The full list of CeDEx Discussion Papers is available at

http://www.nottingham.ac.uk/cedex/publications/discussion-papers/index.aspx
CONFIDENCE SNOWBALLING AND RELATIVE PERFORMANCE FEEDBACK

 Zahra Murad
 Economics and Finance, University of Portsmouth, UK, PO1 2UP

 Chris Starmer
 School of Economics, University of Nottingham, UK, NG7 2QL

 12/05/2020

 Abstract

We investigate whether relative performance feedback can create biases in confidence leading
it to ‘snowball’. We study elicited confidence about own performance, relative to other group
members, in three stages. As subjects move across stages, we change group composition so
that new groups contain either only top performers or only bottom performers, from the
previous stage. Between treatments, we manipulate whether subjects know about their own
past relative performance or that of currently matched group members. In the NoFeedback
treatment, they know neither of these things and confidence remains calibrated and stable
across the stages. In both of the other two treatments, we provide feedback on own performance
and, in both of these treatments, confidence snowballs significantly in the direction of the
feedback: confidence consistently rises among top performers and falls among bottom
performers. In one of these treatments - the OwnFeedback treatment, which we interpret as
inducing full reference group neglect – subjects are not told about how their reference group is
changing. In the FullFeedback treatment, however, subjects do have a basis for judging that
their own performance feedback is essentially uninformative, yet we still find strong evidence
that confidence snowballs and only limited evidence that they are weaker than those arising
from full reference group neglect. Hence, the results are broadly consistent with the reference
group neglect hypothesis. The results suggest the possibility of confidence biases emerging and
snowballing in a potentially wide range of field settings.
Keywords: overconfidence, relative performance feedback, confidence updating

Acknowledgements: We thank Martin Sefton, Alexander Coutts, Robin Cubitt, Lingbo
Huang, Levent Neyse, Simone Quercia, and Joep Sonnemans for very helpful input to this
paper. We also thank participants in seminars and workshops where this project has been
presented for helpful comments and suggestions. This work was supported by the Economic
and Social Research Council (grant numbers ES/K002201/1, ES/P008976/1)
.
1 Introduction
An increasing number of studies investigate whether confidence biases can be eliminated with
feedback and experience (Ertac, 2011; Grossman & Owens, 2012; Möbius, Niederle, Niehaus,
& Rosenblat, 2014; Moore & Cain, 2007; Murad, 2016; Wozniak, Harbaugh, & Mayr, 2014).
At the same time, several empirical and theoretical studies have speculated that overconfidence
may originate from feedback and experience (Billett & Qian, 2008; Daniel, Hirshleifer, &
Subrahmanyam, 1997; Daniel & Hirshleifer, 2016; Gervais & Odean, 2001; Hilary & Menzly,
2006). As far as we know, there has been no direct test of whether feedback can generate
confidence biases. In this paper, we provide such a test and show that relative performance
feedback can lead to the emergence and ‘snowballing’ of confidence biases in a dynamic setup,
where biases are absent to start with.1
 Our main motivation for studying confidence biases in a dynamic (i.e. multi-stage)
setup derives from the existence of a variety of interesting naturalistic contexts, also having a
dynamic structure, where confidence formation can play an important role in decisions. The
confidence of employees can affect how much effort they exert (Barron & Gravert, 2018; Chen
& Schildberg-Hörisch, 2019) and what kind of careers they pursue (Buser, Niederle, &
Oosterbeek, 2014; Reuben, Wiswall, & Zafar, 2017). The relative confidence of students can
affect their decisions about investment to study at different stages of the academic ladder
(Fischer & Sliwka, 2018; Murphy & Weinhardt, 2018). The confidence of athletes progressing
through a tournament, or entering consolation tournaments may affect their motivation for and
decisions about subsequent training regimes (Rosenqvist & Skans, 2015). In corporate settings,
the confidence of CEOs and investors can affect trading, merger and acquisition decisions
(Billett & Qian, 2008; Daniel & Hirshleifer, 2016; Hilary & Menzly, 2006).
 Studying confidence as a response to performance feedback can be difficult with
naturally occurring field data. Confidence beliefs usually cannot be directly observed and may
be confounded by factors such as self-selection; the interaction of confidence with effort and
risk attitudes; and the effects of previous unobserved experiences. We thus use a controlled lab
experiment to study the effects of feedback on confidence. We create an environment where
we hypothesize that positive feedback “snowballs” confidence towards overconfidence while
negative feedback “snowballs” confidence towards underconfidence. Our environment
involves subjects completing a competitive task and reporting their confidence about their

1
 We use the label snowballing as a convenient metaphor to capture the idea of something becoming bigger (in
absolute terms) as a consequence of some process evolving through time.

 1
success, relative to a reference group of participants, at each of the three stages. Between stages,
we manipulate the reference group; whether feedback on relative performance in the previous
round is provided; and whether the feedback is only about one’s own relative performance or
also about that of the reference group. Our primary interest is in examining how confidence
responds to feedback from one stage to the next. As far as we know, we are the first to test for
reference group neglect in a dynamic setup.2
 The focus of our paper is also novel in testing whether feedback can cause confidence
biases. To this end, we wished to create an environment with a task where subjects’ initial
confidence assessments of their own relative performance would be unbiased. For this purpose,
we choose the ‘Circle task’ introduced by Hollard, Massoni, & Vergnaud (2016). In this task,
subjects see two black circles, briefly, on a computer screen with a varying number of white
dots inside them. When the circles disappear from screens (after just one second of viewing
time), subjects are asked to report their judgement of which circle contained more dots. We
discuss the task and its properties in more detail later (see Section 2 and Appendix A1). For
now, the crucial thing to note is that, as we conjectured and as evidenced by the data we report
below, individuals’ initial relative confidence assessments (prior to any performance feedback)
were, on average, well-calibrated.
 In each of the three stages of our experiment, subjects were allocated to groups of four,
but these groupings changed at every stage of the experiment, with subjects achieving similar
scores at stages one or two being grouped together at the subsequent stages. What subjects
knew about this grouping structure varied between treatments. In every stage, subjects were
required to complete a set of 20 circle tasks, but before doing the tasks, we elicited - using an
incentive compatible tool - each subjects’ confidence that their own score would be one of the
top two in their group. Across three between-subject treatments, we manipulate the feedback
subjects receive between stages. In the NoFeedback condition, subjects receive no feedback.
In the OwnFeedback condition, we provide subjects with feedback about their own relative
performance (whether they were in the top or bottom half of their groups) only. In the
FullFeedback condition, we provide feedback both about subjects’ own relative performance
and about the relative performance of the rest of their new group (i.e. whether new members
of their group this round were top half or bottom half performers last round). Given this
structure, there is a basis for expecting subjects in the OwnFeedback treatment to update their

2
 The only other paper who changes reference groups subjects compare themselves against is by Berlin &
Dargnies, (2016) who mainly focus on gender differences in willingness to complete as a reaction to changing
reference groups.

 2
confidence in the direction of the feedback received (upwards after positive feedback, and
downwards after negative feedback). In the NoFeedback or FullFeedback treatments, subjects
should not update their confidence as either there is no feedback to affect confidence or the
feedback is uninformative (since subjects receive symmetric information about their own and
their reference group’s abilities in the task). In contrast, subjects prone to reference group
neglect would update their confidence in the direction of the feedback received on their own
performance in the FullFeedback treatment. In the case of full reference group neglect, we
would expect behaviour in the OwnFeedback and FullFeedback treatments to coincide.
 We find that, in the first stage, subjects are well-calibrated; that is overall we cannot
reject the hypotheses that the median subject is 50% confident of scoring in the top half of their
group. As subjects receive feedback, both in the FullFeedback and OwnFeedback treatments,
confidence moves in the direction of own relative performance feedback. By stage three, this
results in significant overconfidence among those who received two consecutive positive
feedbacks and in significant underconfidence among those who received two consecutive
negative feedbacks. We test whether the observed confidence snowballing after positive and
negative feedback is different between OwnFeedback and FullFeedback treatments, i.e.
whether subjects account for changing reference groups when updating confidence beliefs. We
find little evidence of differences in snowballing tendency between the FullFeedback and
OwnFeedback treatments. While we test a range of potential explanations for our results (see
Section 3), the main patterns in our data are consistent with some degree of reference group
neglect (Camerer & Lovallo, 1999): Subjects react to feedback about their own performance
and only partially account for the changes in the reference group they are competing with when
they are provided with that information.

2 Experimental Setup
Our experiment features three main treatments designed to test whether we can generate
confidence snowballing and if we can, we wish to assess how far any snowballing observed is
attributable to reference group neglect. In our environment, individuals complete a task in each
of three stages and, in some treatments, we introduce feedback on subjects’ own behaviour in
the expectation that this may stimulate snowballing. As a benchmark, we include a treatment
in which subjects receive no feedback on behaviour at all: in this case, we expect no
snowballing. We include two variants of feedback treatments. In both of these treatments, we
provide subjects with feedback on their own performance by telling them (truthfully) that their

 3
own performance placed them, respectively, in either the top or the bottom half of their group
in the previous stage. Between stages, however, we manipulate group composition such that if
subjects knew this and fully took account of it, they would realise that the feedback on their
own performance should not affect their own confidence. In one of the feedback treatments the
subjects are fully informed about the changing group composition; hence, observing
snowballing in this treatment is evidence of some degree of reference group neglect. To allow
us to assess the extent of reference group neglect, we include a second feedback treatment
designed to induce full reference group neglect – we do this by not providing information to
subjects about the previous stage performance of their new group members. Conditional on
finding snowballing, we can test the extent of reference group neglect by comparing the degree
of snowballing across the two feedback conditions. Full reference group neglect implies the
same degree of snowballing in both treatments.

2.1 The Task
The experimental design consisted of three stages. At each stage, subjects were matched into
groups of four and had to complete a set of 20 “Circle tasks”. In a single task, an individual
subject saw a pair of black circles, on a computer screen, for 1 second. Each circle contained a
number of white dots and the subject’s task was to judge which of the two circles had the most
dots (Hollard et al., 2016). For our purposes, the Circle task has several attractive features. One
is that it would not have been familiar to our subjects and, through pre-testing (See Appendix
A1 for details), we established that subjects did not accurately predict their performance;
importantly for our research objectives, there were no systematic biases in initial confidence
beliefs. The pre-test data also showed no evidence of learning across stages, limiting concerns
that performance differences between stages might interact with confidence levels. By testing
the impact of large variations in piece-rate payments for success in the task, we also established
that performance is highly insensitive to incentives. This is important for our purposes in
reducing the likelihood that snowballs in confidence could be attributed to perceived changes
in incentives, arising across rounds, from variation in own performance feedback across
individuals. Finally, performance and confidence in relation to the task were unrelated to
gender, risk attitudes and competitive attitudes.
 Some previous studies have found the prevalence of overconfidence in easy and
underconfidence in difficult tasks and varying reactions to feedback both in static and dynamic
contexts (Hoelzl & Rustichini, 2005; Moore & Cain, 2007; Murad, 2016). With this in mind,

 4
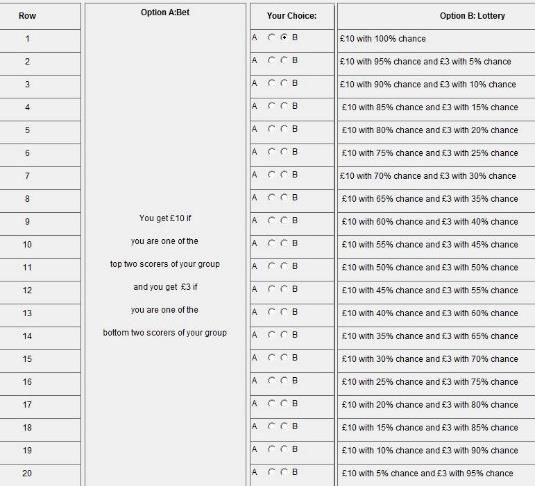
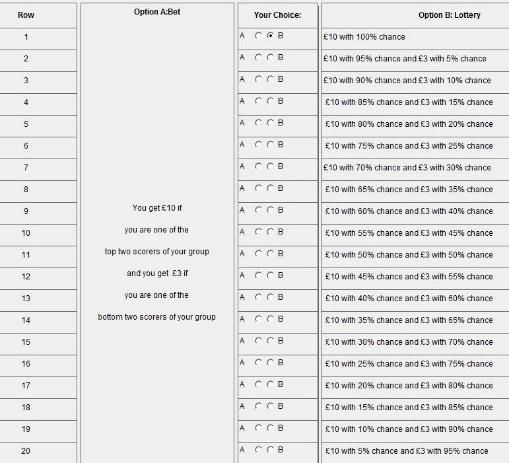
in the main experiment, we manipulated task difficulty between-subjects: a Difficult treatment had circles with 50&51 dots and an Easy treatment had circles with 50&70 dots (see Fig 1). At the start of the experiment, subjects read instructions then practised one set of 20 Circle tasks (with the same difficulty level as their incentivised tasks). The purpose of the practice set was to familiarise subjects with the task before eliciting Stage 1 confidence. No performance feedback was given to subjects for the practice set to avoid influencing confidence levels in Stage 1. After the practice set, subjects were informed about the matching structure of groups that would apply to them; this varied by treatment, as explained below. 2.2 Confidence Elicitation Each experimental session involved 16 subjects. In Stage 1, the 16 subjects were randomly matched into four groups of four people. Each group was given an identifier (Group A, B, C or D) and subjects were told which group they were in and that they all would be completing a set of Circle tasks similar to the practice set. Before starting Stage 1, they were asked to complete a table as in Figure 2. This is a tool designed to infer confidence from a set of choices.3 For every row of the table, subjects had to make a choice between two options, Option A and Option B. Subjects knew that any choice from any table could be paid for real at the end of the experiment. As such, the interpretation of options is that Option A (if for real) would pay £10 if a subject was one of the top two of her group, according to her performance in the set of Circle tasks of that stage and £3 otherwise. Option B was a lottery which paid either £10 or £3 with the chance of £10 progressively decreasing down the rows. Given the construction of the table, subjects were expected to choose Option B in the first row and Option A in the last row. At some point, they were likely to switch from option B to A, and this switch point was used to measure each individual’s confidence of being in the top half of their group The elicited confidence in our design is interpreted as a subjective probability that a subject assigns to being in the top half of their group for a given stage. For example, subjects who assigned an equal probability to being in the top or bottom half of their group would switch in the 11th row the table and would be imputed a 50% confidence ( 2.5%).4 If we assume additive subjective probability distributions, then this task elicits the whole belief distribution 3 Relative confidence is usually elicited via self-reports of relative percentile rankings (Larrick, Burson & Soll 2007; Moore & Cain 2007; Brookins, Lucas & Ryvkin 2014), from estimates of absolute performance for self and others (Kamas & Preston 2012, Neyse, Bosworth, Ring & Schmidt 2015) or inferred from observed competitive payment schemes (Hoelzl & Rustichini 2005; Niederle & Vesterlund 2007). 4 We eliminated the possibility of double switching by presenting subjects who attempted to double switch with an error message that asked them to think more carefully about their choices and decide on their switching point. 5
of any subject. The tool also has the attraction of being incentive-compatible for confidence
revelation under both expected utility theory and prospect theoretic models which allow non-
linear probability distortion (see Urbig, Stauf, & Weitzel, 2009). The tool is robust to the Benoît
& Dubra, (2011) critique of “apparent overconfidence” and meets the requirements for
incentivising confidence elicitation proposed by Benoit, Dubra & Moore (2015) (see Appendix
A2 for further details).
 After completing the confidence elicitation table at the beginning of a stage, subjects
then undertook a set 20 Circle tasks that determined their performance for the stage. Each
correct answer was worth £0.50 hence subjects could earn up to £10 for the set.

 50&51 dots: Difficult 50&70 dots: Easy

 [After 1 second, the circles disappear from the screens]

 Which circle had more dots?
 Left Right
 Figure 1: The Circle Task

2.3 Feedback Manipulation
 In all treatments, whether subjects were told this or not, the group matchings were
always adjusted between each stage such that any pair of subjects who had performed in the
top (respectively bottom) half of their group went on to be grouped with another pair of subjects
in the next stage who had also been the top (respectively bottom) performers from another
group. Between-treatments we manipulated whether subjects received feedback about their
own relative performance feedback and whether they knew about how the composition of their
group membership was adjusted, based on performance.
 In the NoFeedback treatment, subjects did not receive any feedback (about their own
performance or the changing group composition): after they completed a stage, they were just
told that, in the next stage, two members (including them) from their old group would be

 6
matched with two members from another group. In the OwnFeedback treatment, after completing a stage they received either positive or negative feedback about their own relative performance: the feedback, which was true, simply read as “You were in the TOP two of your group” or “You were in the BOTTOM two of your group”. They were then told that in the next stage, two members (including them) of their old group would be matched with two members from another group (without specifying the abilities of their new group members). In the FullFeedback treatment, after completing a stage, subjects received either positive or negative feedback of whether they were in the Top/Bottom two of their groups in the stage (similar to the OwnFeedback treatment). They were then told that the two Top/Bottom half scorers of their group (including them depending on their ranking) would be matched with the two Top/Bottom half scorers of another group in the next stage. Thus in the FullFeedback treatment, subjects knew whether their last round’s performance placed them in the top or bottom half of the group and that they would be matched to similarly ranked subjects in the next stage. Row Option A: Bet Your Option B: Lottery Choice 1 A B £10 with 100% chance 2 A B £10 with 95% chance and £3 with 5% chance 3 A B £10 with 90% chance and £3 with 10% chance 4 A B £10 with 85% chance and £3 with 15% chance 5 You get £10 if A B £10 with 80% chance and £3 with 20% chance you are one of the 6 A B £10 with 75% chance and £3 with 25% chance top two scorers of 7 your group A B £10 with 70% chance and £3 with 30% chance 8 A B £10 with 65% chance and £3 with 35% chance 9 and A B £10 with 60% chance and £3 with 40% chance 10 A B £10 with 55% chance and £3 with 45% chance 11 £3 if you are one A B £10 with 50% chance and £3 with 50% chance 12 of the bottom two A B £10 with 45% chance and £3 with 55% chance 13 scorers of your A B £10 with 40% chance and £3 with 60% chance group 14 A B £10 with 35% chance and £3 with 65% chance 15 A B £10 with 30% chance and £3 with 70% chance 16 A B £10 with 25% chance and £3 with 75% chance 17 A B £10 with 20% chance and £3 with 80% chance 18 A B £10 with 15% chance and £3 with 85% chance 19 A B £10 with 10% chance and £3 with 90% chance 20 A B £10 with 5% chance and £3 with 95% chance Figure 2: Confidence Elicitation Table The group matchings were explained to subjects in the instructions with the aid of diagrams to make the matching procedure as obvious as possible. Subjects’ understanding of 7
the matching structure at each stage of the experiment was a crucial element of our design.
Hence, we reminded them both verbally and graphically about how the grouping was formed
and what group they were in at the beginning of each stage to make the changing reference
groups a salient feature of the experiment. In the FullFeedback treatment, we included the
words “Top” or “Bottom” in the group names to enhance salience. In the NoFeedback and
OwnFeedback treatments, the Top/Bottom labels in the group names were simply replaced
with numbers (“1” or “2”). For example, Top two scorers of group A would be matched with
Top two scorers of group B, and the new group would be called group AB_Top in the
FullFeedback treatment and group AB_1 in the NoFeedback and OwnFeedback treatments.
After the second stage, Top two scorers of group AB_Top (AB_1) would be matched with the
top two scorers of Group CD_Top (CD_1) to form the group ABCD_TopTop (ABCD_11).
Similar matching was done for the bottom two scorers. Please refer to Appendix B Figure B1
for the summary of the matching structure.

2.4 Procedures
 After Stage 3, subjects completed a questionnaire self-reporting socio-demographic
information, risk attitudes, competitive attitudes and general level of confidence (Dohmen,
Falk, Huffman, & Sunde, 2010). In the questionnaire, we also asked subjects whether their
eyesight was impaired. Once all subjects had completed the questionnaire, the experimenter
approached each subject with randomization devices to, privately, determine their payment.
For each subject, one of the stages was randomly selected and within the chosen stage either
one of the rows of the confidence elicitation table or the piece rate performance in a set of
Circle tasks was selected. We explained the randomization procedure to the subjects using
physical randomization devices such as a 6-sided, a 20-sided dice and a bag of numbered balls
in the instructions of the experiment to make the independence of the randomization to subjects
as clear as possible. For the full instructions of the experiment please see Appendix B, and for
the summary of the experimental flow please see Appendix C Table C1.
 Subjects were 384 undergraduate and postgraduate students recruited via Orsee
(Greiner, 2015) from an online database of CeDEx laboratory at the University of Nottingham.
Subjects, 54% female with 18% from Economics and Business majors, were divided into three
treatments with 12 sessions for the FullFeedback treatment and 6 sessions each for the
OwnFeedback and NoFeedback treatments. The experiment was programmed using Ztree
(Fischbacher, 2007) and lasted around 30 minutes. Subjects were seated in private cubicles and

 8
were given paper instructions. The instructions were read by the same experimenter at the beginning of the experiment. The average subject payment was £7.60 (min. £3; Max £10). 3 Results We first present descriptive results on the distribution of prior confidence levels. We then present evidence of confidence snowballing and the emergence of confidence biases from one stage to the next for the subjects that received relative performance feedback. We check the robustness of confidence snowballing and test for reference group neglect by comparing the FullFeedback and OwnFeedback treatments. Finally, we test for the existence of other confidence updating biases in our data such as fundamental misattribution bias, good-news- bad-news effects and motivational feedback effects. 3.1. Stage 1 Confidence: is confidence well-calibrated prior to performance feedback? We first investigate whether initial beliefs about task performance are well-calibrated, prior to any feedback on task performance. Regarding the rational benchmark for belief formation, it is perfectly admissible for individuals to estimate their ability with error (e.g. overconfidence or underconfidence), but the distribution of these errors should have a mean of zero. Following Benoît & Dubra, (2011), in this benchmark case we require that beliefs of scoring in the top two of a group of four (i.e. being in the top 50%) are on average equal to 50% ( 2.5%). As Benoît & Dubra, (2011) show in their Theorem 3, if this does not hold in the population, then such beliefs cannot be rationalized. Over all treatments, the median and modal first stage confidence in our data is 50%, and the mean is 52.29% (st dev = 17.02, n=384) suggestive of initially well-calibrated beliefs. This impression is confirmed by the Wilcoxon sign-rank test, which fails to reject the null hypothesis that the median confidence is not statistically different from 50% in the NoFeedback and the FullFeedback treatments (median = 52.5% and 50.0% respectively, p-value>0.10). While there is some evidence of overconfidence in the OwnFedback treatment (mean = 55%, p-value=0.096) it is relatively weak compared to previously cited studies (e.g. 63% and 56% in Hoelzl & Rustichini, (2005) and 67% in Benoît, Dubra, & Moore, (2015). The kernel density of the elicited confidence in Stage 1 is presented in Figure C2 of Appendix C. Table 1 provides further tests for cross-treatment differences in first-stage confidence via regression analysis that allows us to exploit additional controls including task difficulty and individual-level characteristics elicited from the survey measures. As expected, task difficulty reduces confidence, but none of the individual-level characteristics, including gender, are 9
significant.5 In terms of treatment differences, we find no evidence that first stage confidence
in the NoFeedback treatment is different from confidence in either of the feedback (Full or
Own) treatments. We do, however, find marginally significant difference between the
OwnFeedback and FullFeedback treatments; post estimation effect size is equal to -3.65 (p-
value = 0.060) without controls and -3.39 (p-value = 0.089) with controls. Given these results,
in the parametric analysis of feedback effects that follows, we always control for Stage 1
confidence levels and the difficulty level of the task.

 Table 1: Predicting First Stage Confidence Levels
DV: Stage 1 Confidence Model 1 Model 2
OwnFeedback 2.34 (2.33) 2.57 (2.36)
FullFeedback -1.30 (2.24) -0.82 (2.27)
Difficulty -3.74 (1.72)**
Female 0.18 (1.78)
Age 0.49 (0.57)
Confidence_general 0.31 (0.64)
Competitive_general 0.03 (0.63)
Risk_general -0.44 (0.72)
Eyesight 0.03 (1.76)

Constant 52.34 (1.83) 44.08***
N 384 384
R-Sq 0.003 0.001
Wald Coef. Own vs Full feedback -3.65* -3.39*
Risk, Confidence and Competitive are self-reported measures of willingness to take risks, how
confident and how competitive a person is in general. * p < 0.10, *** p < 0.01 of the underlying
coefficient Standard deviations are clustered in session level. The outlier in Easy treatment is
removed.

3.2. Confidence Snowballing and the role of reference group neglect
 Our main research question is how confidence changes from one stage to the next in
response to the relative performance feedback (and changing reference groups). The main
results are summarised in Figure 4. The figure presents the mean confidence of subjects at each
stage with four separate panels for different pairings across rounds (TopTop, BottomBottom,
etc). Since we find no significant differences in snowballing behaviour across difficulty levels
(see Appendix C: Table C1), in this analysis we pool data across the two difficulty levels.

5
 The absence of gender differences in confidence is consistent with previous literature that has shown that the
perceptions about the task being male or female can affect confidence levels and competitive preferences
(Cárdenas, Dreber, von Essen, & Ranehill, 2012; Große & Riener, 2010; Günther, Ekinci, Schwieren, & Strobel,
2010).

 10
Within each panel, we report pairwise tests for equality of confidence across stages (Wilcoxon
matched-pairs signed rank tests), organized by treatment. We highlight several patterns evident
in this figure. First, looking across the four panels for the NoFeedback condition, it is apparent
that there are no significant changes in confidence levels across stages. Hence, in the absence
of feedback, confidence levels are essentially stable.
 We next consider whether there is evidence of snowballing: The top two panels are
those where we can test for snowballing effects of feedback because these are the cases where
the feedback had a consistent direction across stages: feedback on own relative performance
was either indicative of consistently top performance (TopTop) or bottom performance
(BottomBottom); likewise, in the full feedback condition, the feedback on the reference group
either indicated that the reference group was consistently populated with last rounds better
performers (TopTop) or consistently with the lower performers (BottomBottom). Looking at
these top two panels, first, consider the OwnFeedback condition – and recall that these data are
the cases where we have induced full reference group neglect (by not telling subjects how their
reference group was changing). For these two cases, we see clear and highly significant
evidence of snowballing: when feedback on own performance is consistently positive, average
confidence consistently increases; but when feedback on own performance is consistently
negative; confidence consistently falls.
 Similar trends are apparent in the FullFeedback treatment, where subjects know that
their reference group is changing, with systematic increases in confidence for TopTop and
reductions in confidence for BottomBottom. This is evidence that subjects are prone to some
degree of reference group neglect. Although highly significant, at the eyeball level, the
snowballs effects in FullFeedback appear smaller in magnitude than those in OwnFeedback,
consistent with partial rather than full reference group neglect.
 The data reported in the lower two panels of Fig 4. – i.e. for BottomTop and TopBottom
and relating to subjects who received two different signals between the two stages - tell a
similar story: when subjects receive feedback on their own performance, confidence moves in
the direction of their feedback, though because of the mixed nature of the feedback, we do not
observe a snowball across the three rounds.
 To test whether reference group neglect is full or partial, we use linear regression to test
for a difference in snowball effects across the OwnFeedback and FullFeedback treatments. The
results are presented in Table 2 where we report separate regressions for TopTop and
BottomBottom. We test for the equality of confidence snowballing from Stage 1 to Stage 3
between FullFeedback and OwnFeedback treatments using two model specifications (Model 2

 11
adds controls: individual characteristics; performance score; and task difficulty). For all four
models we find that, as expected, confidence snowballs from Stage 1 to Stage 3 in the direction
of the feedback received: it increases after receiving two consecutive positive feedbacks
(statistically significant positive coefficient of Stage 3 in TopTop) and decreases after receiving
two consecutive negative feedbacks (statistically significant negative coefficient of Stage 3 in
BottomBottom). Testing for difference-in-difference in confidence snowballing using an
interaction term, we find that the degree of snowballing is lower in the FullFeedback compared
to the OwnFeedback treatment: the coefficient of Stage3×FullFeedback interaction term is
negative in the TopTop and positive in BottomBottom conditions and shows around ~ 6.5%
points difference in confidence. However, the coefficient is not significant.

 __ns___ __***___ __***___ __ns___ __***___ __***___
 _ns_ *** *** _ns_ *** ***
 _ns_ _*__ *** _ns_ *** ***

 __ns___ __ns___ __ns___ __ns___ __ns__ __ns___
 _ns_ *** _ns_ _ ***
 _ns_ *** *** *** ***
 *** _ns_ ***

Fig 4. Mean confidence across stages and treatments. Wilcoxon matched pair signed rank
test. ns p>0.10, * p < 0.10, *** p < 0.01. Error bars are 95% confidence intervals.

 To complement this analysis, we also pairwise test whether the absolute level of
confidence is significantly different between the OwnFeedback and FullFeedback treatments,

 12
in each stage, using the Wilcoxon ranksum test. For TopTop: Stage 1 p-value = 0.114; Stage 2
p-value = 0.073, Stage 3 p-value = 0.001. For BottomBottom: Stage 1 p-value = 0.880, Stage
2 p-value = 0.674, Stage 3 p-value = 0.345. Hence, in line with eyeball impressions from Fig.
4, this provides some statistically significant evidence that reference group neglect is partial in
some cases (i.e. the TopTop condition).

 Table 2: Testing for complete versus partial reference group neglect
 TopTop BottomBottom
 Model 1 Model 2 Model 1 Model 2
 Stage 3 16.04*** 15.97*** -16.66*** -18.50***
 (4.45) (4.64) (4.26) (4.88)
 FullFeedback -3.33 -3.28 -2.08 -3.74
 (4.02) (3.97) (3.75) (3.66)
 Stage3×FullFeedback -6.45 -6.33 6.25 7.05
 (4.75) (4.91) (5.91) (6.31)

 Constant 54.58*** 36.96 51.66*** 39.90
 (3.40) (25.87) (2.48) (34.48)
 2
 Adj R 0.116 0.152 0.071 0.119
 N 144 144 144 144
 Controls No Yes No Yes
 * 10%, *** 1% significance level, controls include actual performance
 score, task difficulty, gender and nationality dummies, age, general
 willingness to take risk, general level of confidence and competitiveness and
 whether any issues with eyesight was reported. Standard errors clustered
 at subject level.

3.3 Is there evidence of alternative confidence updating hypotheses?
 In this section, we test for alternative confidence updating hypotheses that have been
previously studied in the literature. Firstly, feedback effects on confidence snowballing could
be motivational (changing effort and thus performance) rather than simply cognitive (changing
beliefs).6 Feedback could affect subjects’ subsequent motivations to exert effort and hence their
confidence could follow this shift in their efforts/performance. We rule out this explanation for
confidence snowballing. Firstly, our task was pre-tested so that incremental effort level exerted
on the task did not improve/diminish performance (as long as the minimal effort was exerted;
see Appendix A1). Secondly, in our analysis in Table 2, we explicitly control for the

6
 Ederer, (2010) and Fishbach, Eyal, & Finkelstein, (2010) argue for the motivating effects of positive feedback
on performance and effort levels. Berger & Pope, (2011); Eriksson, Poulsen, & Villeval, (2009); Kuhnen &
Tymula, (2012) show motivating effects of negative performance feedback on the subsequent effort levels in
tournaments. Gill & Prowse, (2012); Malueg & Yates, (2010), argue for discouraging effects of negative
performance feedback on the subsequent performance.

 13
performance variable (the score in the set of Circle tasks in each stage). Hence any change
observed in confidence from Stage 1 to Stage 3 is conditional on any change in performance.
And thirdly, to test for other unobserved motivational effects of feedback on exerted effort
levels, we asked subjects in the post-study questionnaire “Did you try harder in some stages of
the Circle task than in others?”. Subjects could choose "I tried equally hard throughout"; "I
tried harder in Stage 1"; “I tried harder in Stage 2"; "I tried harder in Stage 3”. 87%, 65% and
66% of our subjects in NoFeedback, OwnFeedback and FullFeedback treatments, respectively,
reported that they tried equally hard throughout (Table 3). The responses of the remaining
subjects were equally distributed across the stages. Moreover, no systematic relationship was
detected across the feedback conditions (TopTop, TopBottom, BottomTop or BottomBottom)
and subjects’ answer to this question ( 2 p-value > 0.650). We thus consider it unlikely that
the motivational effects of feedback may have contributed to confidence snowballing.

 Table 3: Did you try in one stage harder than in the other? (frequencies of choosing an
 option)
 FullFeedback TopTop TopBottom BottomBottom BottomTop Total
 I tried hard 38 34 28 27 127
 throughout
 Stage 1 3 5 9 3 20
 Stage 2 0 3 1 12 16
 Stage 3 7 6 10 6 29
 OwnFeedback
 I tried hard 14 11 12 17 54
 throughout
 Stage 1 4 4 2 4 14
 Stage 2 1 3 3 3 10
 Stage 3 5 6 7 0 18
 NoFeedback
 I tried hard - - - - 83
 throughout
 Stage 1 - - - - 3
 Stage 2 - - - - 6
 Stage 3 - - - - 4

 Secondly, causal misattribution bias may have contributed to the observed confidence
snowballing. Causal misattribution bias manifests itself through attributing positive events to
internal factors such as skill, personality and expertise and negative events to external factors
such as luck and other people’s faults (Mezulis, Abramson, Hyde, & Hankin, 2004). At the end
of the experiment, we asked subjects the question, “On a scale of 1 to 7, did luck or skill
determine your performance in the Circle Task? (1 entirely luck, 7 entirely skill)”. Figure 5

 14
presents evidence of causal misattribution bias. For subjects who received feedback (left-hand
panel), when in the TopTop condition they rate the task as more influenced by skill (mean (sd)
= 4.61 (2.01)) compared to the ones in the BottomBottom condition (mean (sd)= 3.04 (1.73)).
In the additional analysis reported in Table 4, we control for the effect of these misattributed
beliefs on confidence snowballing and check for any interaction effects for those who attributed
feedback to skill versus luck. We find that there is marginally significantly higher snowballing
from positive feedback for those who misattributed feedback more to skill than luck; this
significance disappears, however, when we control for additional individual characteristics
(socio-demographic and economic preferences). No similar result holds for those receiving
negative feedback. So, while some causal misattribution bias exists in our data, we do not find
that it is an important contributor to confidence snowballing in our study.

Figure 5: Causal Misattribution to Skill or to Luck depending on the feedback received
Mean answers to the question: On a scale of 1 to 7, did luck or skill determine your
performance in the Circle Task? (1 entirely luck, 7 entirely skill)”.

 Finally, we test for asymmetric updating behaviour depending on the feedback
received.7 Positive asymmetric updating (also known as a good-news-bad-news effect) would
predict that the change in confidence from Stage 1 to Stage 3 would be lower in magnitude
after receiving negative feedback than after receiving positive feedback, with the opposite
pattern for negative asymmetric updating. We test for asymmetric updating by regressing the
absolute change in confidence on the feedback condition dummy (TopTop vs BottomBottom)
and results are reported in Table 5. Contrary to the good-new-bad-news effect, we find some

7
 Positive asymmetric updating predicts overweighting of positive feedback and underweighting of negative
feedback when updating beliefs (Moutsiana, Charpentier, Garrett, Cohen, & Sharot, 2015; Sharot, Korn, & Dolan,
2011).

 15
evidence of negative asymmetric updating with a tendency for subjects to update less in the
TopTop condition compared to the BottomBottom condition (see the negative coefficient on
the treatment dummy in Table 5 which is significant at the 5% level in both specifications).
 Our design also permits another form of test for differential responses to positive and
negative feedback by examining the effects of mixed feedback in the TopBottom or BottomTop
conditions. If asymmetric updating were in operation, we would observe a significant change
in confidence in both of these conditions. As demonstrated in the bottom panels of Figure 4,
there is no change in confidence from Stage 1 to Stage 3 in either the TopBottom or in
BottomTop conditions of either of the feedback treatments. Hence in these conditions, we
observe no asymmetry in updating. This adds to the mixed evidence relating to asymmetric
information processing with recent studies showing either no asymmetry (Buser, Gerhards, &
van der Weele, 2018; Grossman & Owens, 2012), positive asymmetry (Eil & Rao, 2011;
Möbius et al., 2014) or negative asymmetry (Coutts, 2019; Ertac, 2011).

 Table 4: Snowballing Confidence and Causal misattribution
 The dependent variable is the change in confidence from the first to the last
 stage:
 Confidence Stage 3 - Confidence Stage 1

 Model 1 Model 2
 Skill_Attr -.208 (3.06) -.44 (2.97)
 TopTop 6.28 (2.89)** 6.71** (3.18)
 BottomBottom -14.75*** (4.72) -16.52*** (4.42)

 TopTop×SkillAttr 7.44* (3.72) 4.37 (3.91)
 BottomBottom×SkillAttr 5.08 (7.61) 7.23 (7.02)

 Constant 0.833 (2.70) -34.00** (14.54)
 Controls No Yes
 N 288 288
 * p
Table 5: Testing for asymmetric updating

 DV: Absolute value of Model 1 Model 2
 (ConfStage3-
 ConfStage1)
 TopTop (vs -6.18** (2.68) -6.06** (2.75)
 BottomBottom)

 Constant 20.97*** (2.24) -17.39 (14.80)
 Controls No Yes
 N 144 144
 * p
In all three treatments of our three-stage experiment, as subjects move from stage 1 to
stage 3, we change group composition so that new groups contain either only top performers
or only bottom performers, from the previous round. Between treatments, we manipulate
whether subjects know about their own past relative performance or that of their current
matched group members. In the NoFeedback treatment, they know neither of these things and
confidence remains calibrated and stable across the stages. In both of the other two treatments,
we provide feedback on own performance and, in both of these treatments, confidence
snowballs significantly in the direction of the feedback: confidence consistently rises among
top performers and falls among bottom performers. In one of these treatments - the
OwnFeedback treatment, which we interpret as inducing full reference group neglect – subjects
are not told about how their reference group is changing. In the FullFeedback treatment,
however, subjects do have a basis for judging that their own performance feedback is
essentially uninformative, yet we still find strong evidence that confidence snowballs and only
limited evidence that snowballs are weaker than those arising from full reference group neglect.
 Our evidence is potentially relevant for behaviour in a wide range of naturalistic
environments. For example, consider new students starting at college or financial traders
starting a new job. To begin with, they do not have much basis for judging their relative abilities
(Gervais & Odean, 2001) but, over time, they receive relative performance feedback both about
themselves and their reference groups: e.g. students being able to observe both their own and
their peers’ grades/performances, traders being exposed to their own and to market
performance information. In such cases, our results point to the possibility of confidence biases
emerging. For example, students will become discouraged and underconfident when finding
themselves in classes with extremely able students, neglecting the fact that their reference
group is more skilled than average. The opposite will be true for those students that are in
classes with low ability students (see the ‘Big-Fish-Little-Pond effect’ of Marsh, 1987). This
will, in turn, affect their study motivation and future performance (Fischer & Sliwka, 2018;
Murphy & Weinhardt, 2018). Similarly, in work environments, employees and firms will
disregard the feedback they receive about their competitors, responding mainly to feedback
about their own performance and resulting in potentially suboptimal decision making (e.g. in
relation to pricing, marketing strategies or promotions decisions).
 Finally, our results also help to explain some well-attested confidence anomalies, such
as the frequently cited example of systematic overconfidence among drivers, most of whom
rate themselves as above average in ability (Svenson, 1981). Picture the typical driver who
most days completes their daily drive to work or the school gates without incident. This regular

 18
positive, accident-free, experience may be a source of growing confidence in their own ability,
notwithstanding that most drivers, most days receive essentially the same positive signal and
become similarly more experienced as drivers. On this interpretation, this common bias may
be diagnosed as a case of confidence snowballing caused by a conjunction of uninformative
feedback and reference group neglect.

References
Arkes, H. R., Christensen, C., Lai, C., & Blumer, C. (1987). Two methods of reducing
 overconfidence. Organizational Behavior and Human Decision Processes, 39(1), 133–
 144.
Barron, K., & Gravert, C. (2018). Confidence and Career Choices: An Experiment. SSRN
 Electronic Journal.
Benoît, J., & Dubra, J. (2011). Apparent Overconfidence. Econometrica, 79(5), 1591–1625.
Benoît, J., Dubra, J., & Moore, D. A. (2015). Does the Better than Average Effect Show that
 People are Overconfident: Two Experiments. Journal of the European Economic
 Association, 13(2), 293–329.
Berger, J., & Pope, D. (2011). Can Losing Lead to Winning? Management Science, 57(5),
 817–827.
Berlin, N., & Dargnies, M.-P. (2016). Gender differences in reactions to feedback and
 willingness to compete. Journal of Economic Behavior & Organization, 130, 320–336.
Billett, M. T., & Qian, Y. (2008). Are Overconfident CEOs Born or Made? Evidence of Self-
 Attribution Bias from Frequent Acquirers. Management Science, 54(6), 1037–1051.
Burks, S. V., Carpenter, J. P., Goette, L., & Rustichini, A. (2013). Overconfidence and Social
 Signalling. The Review of Economic Studies, 80(3), 949–983.
Buser, T., Gerhards, L., & van der Weele, J. (2018). Responsiveness to feedback as a
 personal trait. Journal of Risk and Uncertainty, 56(2), 165–192.
Buser, T., Niederle, M., & Oosterbeek, H. (2014). Gender, Competitiveness, and Career
 Choices *. The Quarterly Journal of Economics, 129(3), 1409–1447.
Camerer, C., & Lovallo, D. (1999). Overconfidence and Excess Entry: An Experimental
 Approach. American Economic Review, 89(1), 306–318.
Cárdenas, J.-C., Dreber, A., von Essen, E., & Ranehill, E. (2012). Gender differences in
 competitiveness and risk taking: Comparing children in Colombia and Sweden. Journal
 of Economic Behavior & Organization, 83(1), 11–23.
Chen, S., & Schildberg-Hörisch, H. (2019). Looking at the bright side: The motivational

 19
value of confidence. European Economic Review, 120, 103302.
Coutts, A. (2019). Good news and bad news are still news: experimental evidence on belief
 updating. Experimental Economics, 22, 369–395.
Daniel, K. D., & Hirshleifer, D. A. (2016). Overconfident Investors, Predictable Returns, and
 Excessive Trading. SSRN Electronic Journal, 29, 61–88.
Daniel, K. D., Hirshleifer, D. A., & Subrahmanyam, A. (1997). A Theory of Overconfidence,
 Self-Attribution, and Security Market Under- and Over-reactions. SSRN Electronic
 Journal.
Dohmen, T., Falk, A., Huffman, D., & Sunde, U. (2010). Are Risk Aversion and Impatience
 Related to Cognitive Ability? American Economic Review, 100(3), 1238–1260.
Eberlein, M., Ludwig, S., & Nafziger, J. (2011). The Effects of Feedback on Self-
 Assessment. Bulletin of Economic Research, 63(2), 177–199.
Ederer, F. (2010). Feedback and Motivation in Dynamic Tournaments. Journal of Economics
 & Management Strategy, 19(3), 733–769.
Eil, D., & Rao, J. M. (2011). The Good News-Bad News Effect: Asymmetric Processing of
 Objective Information about Yourself. American Economic Journal: Microeconomics,
 3(2), 114–138.
Eriksson, T., Poulsen, A., & Villeval, M. C. (2009). Feedback and incentives: Experimental
 evidence. Labour Economics, 16(6), 679–688.
Ertac, S. (2011). Does self-relevance affect information processing? Experimental evidence
 on the response to performance and non-performance feedback. Journal of Economic
 Behavior & Organization, 80(3), 532–545.
Fischbacher, U. (2007). z-Tree: Zurich toolbox for ready-made economic experiments.
 Experimental Economics, 10(2), 171–178.
Fischer, M., & Sliwka, D. (2018). Confidence in knowledge or confidence in the ability to
 learn: An experiment on the causal effects of beliefs on motivation. Games and
 Economic Behavior, 111, 122–142.
Fishbach, A., Eyal, T., & Finkelstein, S. R. (2010). How Positive and Negative Feedback
 Motivate Goal Pursuit. Social and Personality Psychology Compass, 4(8), 517–530.
Gervais, S., & Odean, T. (2001). Learning to Be Overconfident. Review of Financial Studies,
 14(1), 1–27.
Gill, D., & Prowse, V. (2012). A Structural Analysis of Disappointment Aversion in a Real
 Effort Competition. American Economic Review, 102(1), 469–503.
Greiner, B. (2015). Subject pool recruitment procedures: organizing experiments with

 20
ORSEE. Journal of the Economic Science Association, 1(1), 114–125.
Große, N. D., & Riener, G. (2010). Explaining gender differences in competitiveness:
 Gender-task stereotypes. (No. 2010, 017). Jena Economic Research Papers.
Grossman, Z., & Owens, D. (2012). An unlucky feeling: Overconfidence and noisy feedback.
 Journal of Economic Behavior & Organization, 84(2), 510–524.
Günther, C., Ekinci, N. A., Schwieren, C., & Strobel, M. (2010). Women can’t jump?—An
 experiment on competitive attitudes and stereotype threat. Journal of Economic
 Behavior & Organization, 75(3), 395–401.
Hilary, G., & Menzly, L. (2006). Does Past Success Lead Analysts to Become
 Overconfident? Management Science, 52(4), 489–500.
Hoelzl, E., & Rustichini, A. (2005). Overconfident: Do You Put Your Money on It? The
 Economic Journal, 115(503), 305–318.
Hollard, G., Massoni, S., & Vergnaud, J.-C. (2016). In search of good probability assessors:
 an experimental comparison of elicitation rules for confidence judgments. Theory and
 Decision, 80(3), 363–387.
Kuhnen, C. M., & Tymula, A. (2012). Feedback, Self-Esteem, and Performance in
 Organizations. Management Science, 58(1), 94–113.
Malueg, D. A., & Yates, A. J. (2010). Testing Contest Theory: Evidence from Best-of-Three
 Tennis Matches. Review of Economics and Statistics, 92(3), 689–692.
Marsh, H. W. (1987). The big-fish-little-pond effect on academic self-concept. Journal of
 Educational Psychology, 79(3), 280–295.
Mezulis, A. H., Abramson, L. Y., Hyde, J. S., & Hankin, B. L. (2004). Is There a Universal
 Positivity Bias in Attributions? A Meta-Analytic Review of Individual, Developmental,
 and Cultural Differences in the Self-Serving Attributional Bias. Psychological Bulletin,
 130(5), 711–747.
Möbius, M. M., Niederle, M., Niehaus, P., & Rosenblat, T. (2014). Managing Self-
 Confidence. NBER Working Paper.
Moore, D. A., & Cain, D. M. (2007). Overconfidence and underconfidence: When and why
 people underestimate (and overestimate) the competition. Organizational Behavior and
 Human Decision Processes, 103(2), 197–213.
Moutsiana, C., Charpentier, C. J., Garrett, N., Cohen, M. X., & Sharot, T. (2015). Human
 Frontal-Subcortical Circuit and Asymmetric Belief Updating. The Journal of
 Neuroscience : The Official Journal of the Society for Neuroscience, 35(42), 14077–
 14085.

 21
Murad, Z. (2016). Does group discussion lead to better informed and more strategic market
 entry decisions? Economics Letters, 144, 25–28.
Murad, Z., Sefton, M., & Starmer, C. (2016). How do risk attitudes affect measured
 confidence? Journal of Risk and Uncertainty, 52(1), 21–46.
Murphy, R., & Weinhardt, F. (2018). Top of the class: The importance of ordinal rank. NBER
 Working Paper.
Petrusic, W. M., & Baranski, J. V. (1997). Context, Feedback, and the Calibration and
 Resolution of Confidence in Perceptual Judgments. The American Journal of
 Psychology, 110(4), 543.
Pulford, B. D., & Colman, A. M. (1997). Overconfidence: Feedback and item difficulty
 effects. Personality and Individual Differences, 23(1), 125–133.
Reuben, E., Wiswall, M., & Zafar, B. (2017). Preferences and Biases in Educational Choices
 and Labour Market Expectations: Shrinking the Black Box of Gender. The Economic
 Journal, 127(604), 2153–2186.
Rose, J. P., & Windschitl, P. D. (2008). How egocentrism and optimism change in response
 to feedback in repeated competitions. Organizational Behavior and Human Decision
 Processes, 105(2), 201–220.
Rosenqvist, O., & Skans, O. N. (2015). Confidence enhanced performance? – The causal
 effects of success on future performance in professional golf tournaments. Journal of
 Economic Behavior & Organization, 117, 281–295.
Sharot, T., Korn, C. W., & Dolan, R. J. (2011). How unrealistic optimism is maintained in the
 face of reality. Nature Neuroscience, 14(11), 1475–1479.
Subbotin, V. (1996). Outcome Feedback Effects on Under- and Overconfident Judgments
 (General Knowledge Tasks). Organizational Behavior and Human Decision Processes,
 66(3), 268–276.
Svenson, O. (1981). Are we all less risky and more skillful than our fellow drivers? Acta
 Psychologica, 47(2), 143–148.
Wozniak, D., Harbaugh, W. T., & Mayr, U. (2014). The Menstrual Cycle and Performance
 Feedback Alter Gender Differences in Competitive Choices. Journal of Labor
 Economics, 32(1), 161–198.

 22
Appendix A1: The Circle Task
The Circle task has been used previously in Hollard et al., (2016) to study calibration between
absolute confidence and success rates. The task involves seeing a pair of black circles with
white dots in them for one second and judging which circle has more dots. We were specifically
attracted to this task because we wanted to measure confidence in a skill task that is insensitive
to effort. As a skill task, it requires a minimum effort level to achieve the maximum
performance after which additional effort does not improve performance. This reduces the
possibility of incentive effects caused by the feedback that may affect effort and performance
in the task. We also aimed to use a gender-neutral task both in terms of actual performance and
perceptions about the task. We pre-tested the task for these properties in a standard
experimental session format with 30 subjects recruited via Orsee (Greiner 2004). The
experiment was computerized and programmed with Ztree (Fischbacher 2007). The pre-test
was conducted one month prior to the main study.
 Four difficulty levels of a task were pretested: 50&51, 50&55, 50&60, 50&65, 50&70
dot circles presented in sets of 20 circle pairs per each difficulty level. We randomized the
order in which the sets were presented. We also presented two of the difficulty levels (50&51
and 50&60) to the subjects three times, in order to check whether there were learning effects.
We had two between-subject treatments, low and high incentives, to check whether incentives
improve performance by promoting effort. The Low incentive scheme paid £0.05 per correct
answer plus a fixed payment of £5. The high incentive scheme paid £0.50 per correct answer
and no fixed payment. Subjects were paid for one randomly selected set.
 We did not find a difference in performance between the two incentive levels across
the difficulty levels. We did not find any difference in the answers of subjects to the questions
“how hard did you try”, and “how focused were you on a task” across incentive levels either,
indicating that the subjects did not consciously vary effort depending on the rewards. The
maximum average performance was observed in 50&70 dots set (19.81 in low and 19.75 in
high incentive, Wilcoxon ranksum p-value = 0.729) and the minimum average performance
was in 50&51 dot set (11.3 in low and 10.9 in high incentive, p-value = 0.437). We chose these
two difficulty levels as our easy and difficult treatments for the main experiment. These two
difficulty levels also showed the lowest variance in performance among subjects. We tested for
learning effects and found that performance within a difficulty level did not improve from
earlier to later sets (Cuzick, (1985) test for trend p-value = 0.432).

 1
You can also read