Mediterranean Marine Science - eJournals
←
→
Page content transcription
If your browser does not render page correctly, please read the page content below
Mediterranean Marine Science

Vol. 22, 2021

                                                                            Spatio-temporal distribution of pufferfish
                                                                        (Tetraodontidae) along the Turkish coast of the
                                                                                      Mediterranean Sea

                                                                      MUTLU ERHAN                 Akdeniz University, Fisheries
                                                                                                  Faculty, Main Campus,
                                                                                                  Antalya, Turkey
                                                                      DE MEO ILARIA               Inland Norway University of
                                                                                                  Applied Sciences, Faculty of
                                                                                                  Applied Ecology, Agricultural
                                                                                                  Sciences and Biotechnology,
                                                                                                  Campus Evenstad, Elverum,
                                                                                                  Norway
                                                                      MIGLIETTA CLAUDIA           Alimatha Island, Vaavu Atoll,
                                                                                                  Maldives
                                                                      https://doi.org/10.12681/mms.23481

  Copyright © 2020 Mediterranean Marine Science

 To cite this article:

 MUTLU, E., DE MEO, I., & MIGLIETTA, C. (2021). Spatio-temporal distribution of pufferfish (Tetraodontidae) along the
 Turkish coast of the Mediterranean Sea. Mediterranean Marine Science, 22(1), 1-19.
 doi:https://doi.org/10.12681/mms.23481

                           http://epublishing.ekt.gr | e-Publisher: EKT | Downloaded at 13/09/2021 06:41:04 |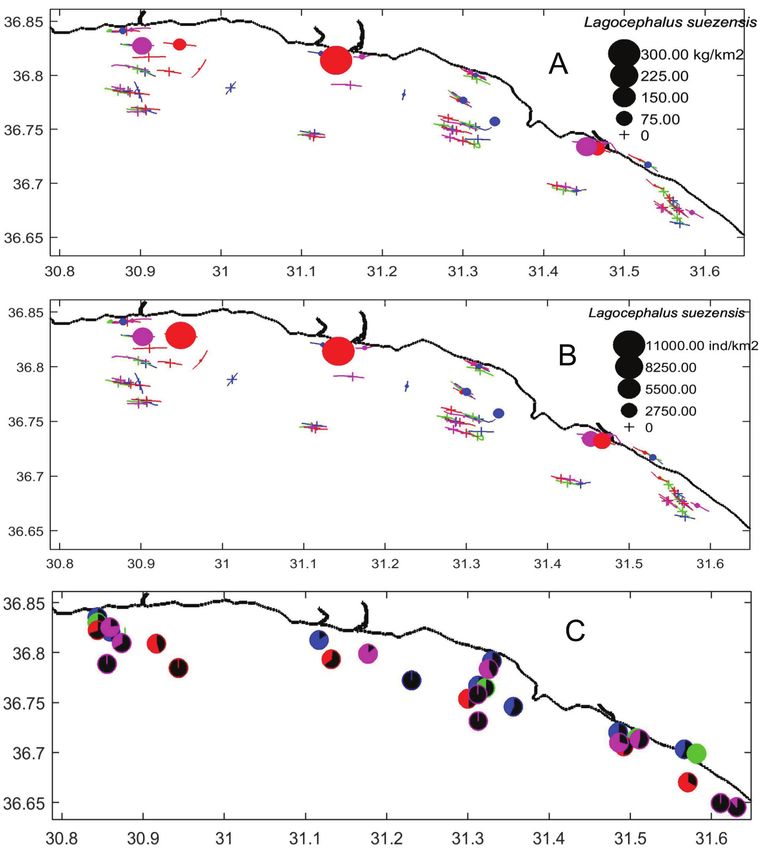
Research Article
Mediterranean Marine Science
Indexed in WoS (Web of Science, ISI Thomson) and SCOPUS
The journal is available on line at http://www.medit-mar-sc.net
DOI: http://dx.doi.org/10.12681/mms.23481

                                Spatio-temporal distribution of pufferfish (Tetraodontidae)
                                   along the Turkish coast of the Mediterranean Sea

                                      Erhan MUTLU1, Ilaria de MEO2 and Claudia MIGLIETTA3
                                   1
                                     Akdeniz University, Fisheries Faculty, Main Campus, Antalya, Turkey
                    2
                        Inland Norway University of Applied Sciences, Faculty of Applied Ecology, Agricultural Sciences
                                         and Biotechnology, Campus Evenstad, Elverum, Norway
                                                  3
                                                    Alimatha Island, Vaavu Atoll, Maldives

                                                  Corresponding author: emutlu@akdeniz.edu.tr

                                                   Contributing Editor: Murat BILECENOGLU

                            Received: 18 June 2020; Accepted: 12 October 2020; Published online: 8 January 2021

Abstract

     Pufferfish represent a serious threat to the marine ecosystem in the Mediterranean Sea. To better understand the population
dynamics of pufferfish and their relation with ecological parameters, six pufferfish species were studied in two fishing and one
non-fishing zone in one of the most oligotrophic regions of the Mediterranean Sea during 2014 and 2015, including different hab-
itats of vegetated and non-vegetated and seasons. The results provide information on pufferfish ecological status compared with
more eutrophic zones in which these species could potentially worsen their impact. Four species were common in the study area
and two were rare. The dominant species was Lagocephalus suezensis, reaching abundances of 11,000 ind/km2 at 25 m in October,
followed by Lagocephalus sceleratus, Lagocephalus guentheri, and Torquigener flavimaculosus. The rarest species, Tylerius spi-
nosissimus and Sphoeroides pachygaster, reached higher abundance and biomass in October and February than the other sampling
months. The riverine and meadow habitats played a crucial role for nursing and reproduction in the population dynamics of Lago-
cephalus species, while T. flavimaculosus was absent in these areas. Sex ratios changed depending on season and location. The
occurrence of larger individuals of Lagocephalus spp. and T. flavimaculosus at greater depths evidenced an ontogenetic migration.
Overall, length-weight (L-W) relationships indicate isometric growth for each of the species studied. Pufferfish populations were
primarily a function of habitat and depth of seafloor and secondarily with water productivity.

Keywords: Pufferfish; distribution; density; biometry; Levantine Sea.

Introduction                                                                 Expansion of pufferfish species [i.e. Lagocephalus
                                                                         sceleratus (Gmelin, 1789)] have had negative impacts on
    Pufferfish are among the most invasive species in the                the marine ecosystem (Kalogirou, 2013), fishery industry
marine environment, threatening ecosystems and posing                    (Nader et al., 2012; Ünal et al., 2015; Öndes et al., 2018),
health risks to humans and animals due to its production                 human health (Kan et al., 1987; Yang et al., 1996; Beköz
of tetrodotoxin (Streftaris & Zenetos, 2006; Beköz et al.,               et al., 2013), and socioeconomic aspects of life in Tur-
2013; Belmaker et al., 2013; Santhanam, 2018; Tamele                     key (Öndes et al., 2018). The silver-cheeked toadfish L.
et al., 2019). Populations of pufferfish invaded the east-               sceleratus alone caused a loss of two million Euros in the
ern Mediterranean Sea from the Indo-Pacific. Over time,                  Turkish fishing industry in one year (Ünal et al., 2015).
the invasive pufferfish species experienced succession                       The Black Sea and the eastern Mediterranean Sea
(Reina-Hervas et al., 2004; Akyol et al., 2005) and ex-                  are prime examples of the negative impact that invasive
pansion towards eutrophic waters in the western Mediter-                 species can have on marine ecosystems (Kideys, 2002;
ranean Sea (Bedini 1998; Giordano et al., 2012; Lipej et                 Nader et al., 2012; Kalogirou, 2013). Population dynam-
al., 2013; Kara et al., 2015; Deidun et al., 2015; Azzur-                ics of migrant species of pufferfish and their impact on
ro et al., 2016; Kleitou et al., 2019). Only a few limited               marine ecosystems have not been extensively studied in
studies have been conducted in the oligotrophic eastern                  their original localities or in other seas where pufferfish
Mediterranean Sea (Ben-Abdallah et al., 2011; Dulčić &                   are less valued by commercial markets (Simon & Ma-
Dragičević, 2014; Carbonara et al., 2017; Al-Mabruk et                   zlan, 2008; Patmavathi et al., 2017). Such migrant spe-
al., 2018; Kiparissis et al., 2018).                                     cies can colonize rapidly after succession, limited only

Medit. Mar. Sci., 22/1 2021, 1-19                                                                                                     1

                        http://epublishing.ekt.gr | e-Publisher: EKT | Downloaded at 13/09/2021 06:41:04 |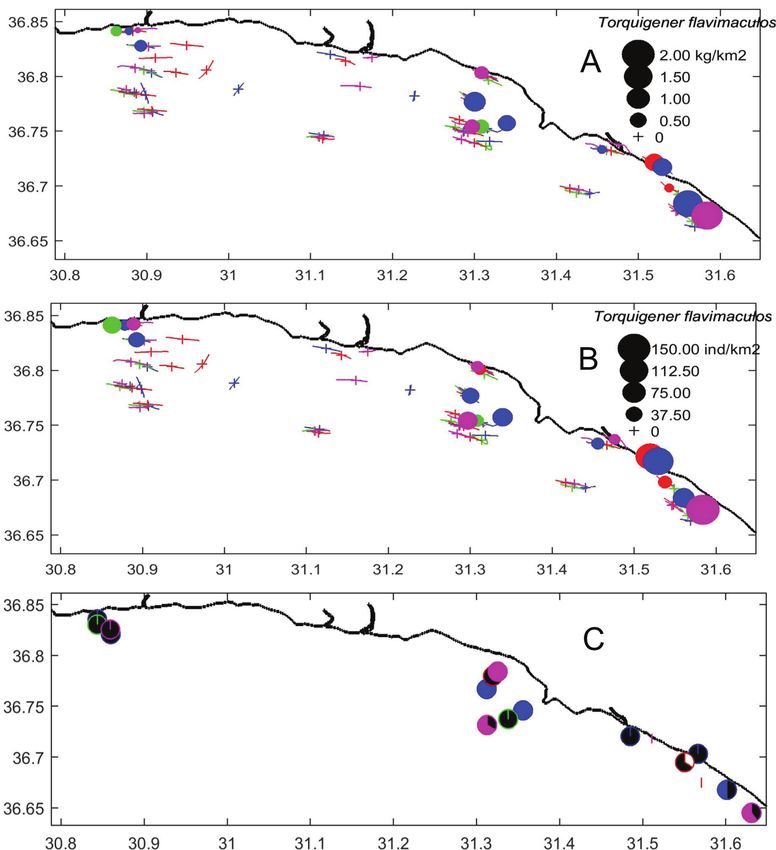
by the abundance of nutrients, until an apex predator ap-       ecological studies of pufferfish spp. in the Mediterranean
pears (Belmaker et al., 2013). Three or four years ago,         to describe their population dynamics and environmental
the lionfish Pterois miles (Bennett, 1828), which feed on       preferences by species and across time and space. Thus,
juveniles and larvae of pufferfish, were invaded in the         the aim of this study was to investigate the distribution
Mediterranean Sea and spread along the eastern coast            and population dynamics of pufferfish along the Turkish
of Turkey from east to west, increasing in fish size with       coast of the eastern Mediterranean Sea by analyzing data
time since its establishment (personal observation by Er-       on density, size, and composition by sex of six pufferfish
han Mutlu and Yaşar Özvarol along the Turkish coast of          species found in different habitats, sub-regions, and bot-
the Mediterranean, December 2018-January 2019 and               tom depths in the study area.
June-July 2019).
    Ten pufferfish spp. have been recorded in the Mediter-
ranean Sea (Farrag et al., 2016). In the eastern Mediterra-     Materials and Methods
nean, particularly the Levantine Sea, pufferfish have been
reported as single individuals (Corsini et al., 2005; Cors-         To study the distribution of pufferfish species in rela-
ini-Foka et al., 2006, 2010; Fricke et al., 2016; Alshawy       tion to environmental parameters, samples were season-
et al., 2019). Of the 10 pufferfish identified, 8 species       ally collected with an otter trawl during different seasons
were found along the Turkish coast (Turan et al., 2017).        over a period of two years (May 2014 and August 2014,
Öndes et al. (2018) listed 7 species, but Lagocephalus          October 2014 and February 2015). The otter trawl was
spadiceus (Richardson, 1845) was believed to be miss-           made of polyethylene with a head-rope of 35 m and a
ing and counted as a misidentified species in the eastern       codend made of 44-mm diamond stretch mesh equipped
Mediterranean Sea. The misidentified L. spadiceus was           with a polyamide codend cover with a 24-mm stretch
replaced with Lagocephalus guentheri Miranda Ribeiro,           mesh.
1915 (Matsuura et al., 2011; CIESM, 2020).                          The study area was divided into four regions (Fig. 1):
    Early studies on pufferfish focused mainly on initial       Region 1 (R1) was a fishing zone characterized by un-
reports on their first records (Bilecenoglu et al., 2006;       vegetated soft bottoms located close to the city of Anta-
Tuncer et al., 2008; Koç et al., 2011; Turan & Yağlıoğlu,       lya (36.8969° N, 30.7133° E) and the main discharge site
2011; Irmak & Altinağaç, 2015; Akyol & Aydın, 2016,             of the city’s wastewater treatment plant. Region 2 (R2)
2017; Çelik et al., 2018), length-weight relationships          was also a fishing zone, but the bottom was vegetated
(Başusta et al., 2013a,b; Bilge et al., 2017), population       by Posidonia oceanica (Linnaeus) Delile, 1813 meadows
growth (Aydın, 2011; Farrag et al., 2015), and biolog-          with rocky bottoms and depths less than 35 m (Mutlu &
ical parameters (Boustany et al., 2015) of a single spe-        Balaban, 2018). Region 3 (R3) was a non-fishing zone
cies when studying the spatio-temporal distribution of          characterized by less vegetation and unvegetated bottoms
the pufferfish (Kalogirou, 2013; Farrag et al., 2015; El-       with steep cliff-like slopes (Mutlu & Balaban, 2018).
Haweet et al., 2016; Özbek et al., 2017).                           There were two transects in R3: one located at the
    Kalogirou et al. (2010, 2012) studied relationships         mouth of a river, Manavgat and the other located far from
between Posidonia spp. and fish assemblages, including          the river to the east. Region 4 (R4) contained extra sta-
two pufferfish identified as L. sceleratus as a seagrass        tions (a bottom depth of 15 m was coded as 10 m, 50
resident and small individuals (15 cm) of Lagocephalus          m as 25 m, and 75 m as 75 m) for depth-wise statistical
suezensis Clark & Gohar, 1953 as occasional visitors to         analyses of samples from estuaries of rivers in the mid-
the seagrass “meadow”. However, there are insufficient          study area. Additional stations were trawled perpendic-

Fig. 1: Study area in red frame with track lines of towing transects by season. (blue = May 2014, green = August 2014, red =
October 2014, magenta = February 2015). Standard depths are ordered from shallowest to deepest bottom depth from the coast to
open water seaward of each region (R1-R3).

2                                                                                             Medit. Mar. Sci., 22/1 2021, 1-19

                    http://epublishing.ekt.gr | e-Publisher: EKT | Downloaded at 13/09/2021 06:41:04 |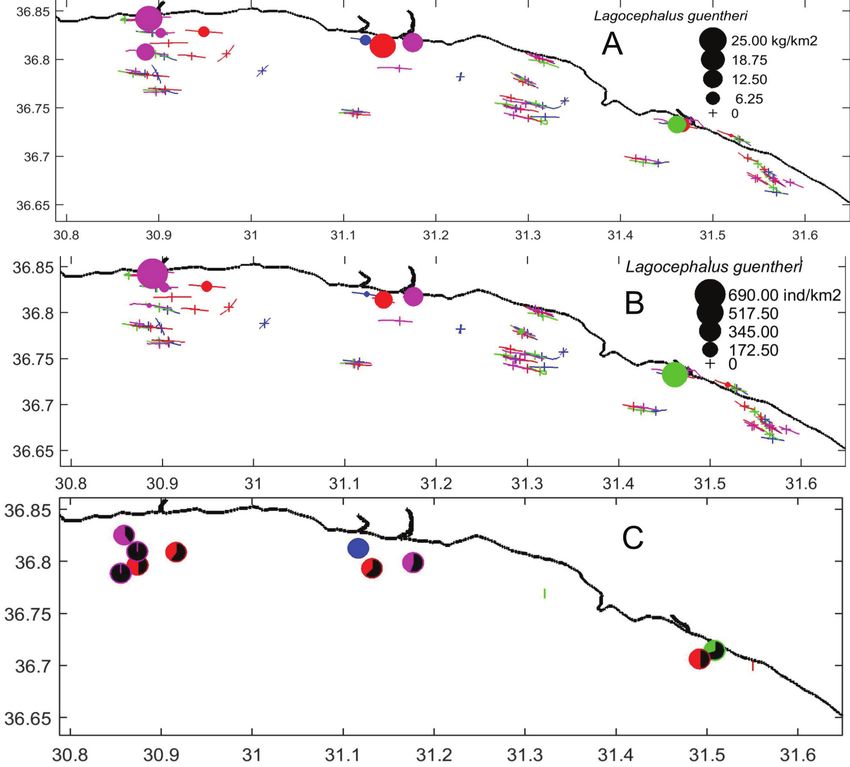
ular to the coast for ground-truthing the fish community      tration of chl-a was measured with a method described
observed within a certain depth range fixed on the echo-      by Lorenzen (1967). Total suspended matter was dried
gram of the echosounder. One bathyal station (in each of      in an oven at 60o C for 24 h, and then weighed before the
R1-R2 and R3) at 300 m bottom depth was added to each         weight of the dried membrane was subtracted from the
fishing and non-fishing zone to explore succession and        total dry weight. Samples obtained from the plankton net
extension of pufferfish beyond the shelf in deeper water.     were then size-fractionated through a sieve series (1, 0.5,
    Transects of each region were made perpendicular to       0.063 mm) and each size fraction was filtered on board
the coast and ranged from 10 to 200 m in depth. Each          onto GF/C 25-mm glass-fibre filters. The filter was dried
region was transected at 10, 25, 75, 125 and 200 m iso-       and then burned at 550o C for 5 h at the laboratory. The
baths. Trawls were towed along the bottom at a speed of       dry weight was defined as seston, ash weight as tripton,
2.5–3 nm for about 30 min. Data from a digital differ-        and the difference as bioseston for each fraction. Bottom
ential global positioning system (DGPS) were recorded         types were classified as rock, sand, and/or mud as re-
during each transect to measure the swept distance.           vealed in the acoustical data using a Visual Bottom Typer
    After each catchment, materials were sorted into lit-     (VBT, version 1.10.3.5, BioSonics, Inc.) down to 250 m
ters, benthos, and fish. Fish species were identified on      depth. The PAR ampoule was cast from the surface down
deck when possible, and samples of suspected target           to 50 m depth using an exponential regression equation
species were preserved in 5% formaldehyde for later           extinction rate of PAR estimated for the depth of the wa-
identification. Sorted species were weighed separately at     ter column and the percent light arriving at the seafloor.
a precision of 0.01 kg to estimate total biomass of each          Geographical coordinates of DGPS data were record-
species. Non-abundant species were counted to calculate       ed at 1-sec intervals and converted to trawling distances.
their abundance of each species, whereas abundant spe-        Sweep width (wing spread) of the trawl was factorized by
cies were sub-sampled at a ratio of one-third to one-fourth   a multiplier of 0.5 with a float-line length as suggested by
of the total catch. The total length (TL) of each species     Pauly (1980) for this type of trawl and region. Abundance
was measured to produce length-frequency histograms.          (ind/ km2) and biomass (kg/km2) were estimated from the
Specimens present in abundance were preserved in form-        number (n) and weight (kg) of individuals in the sweep
aldehyde onboard the R/V Akdeniz Su for later length          area using the software MATLAB® (Mathworks Inc.)
measurements at the laboratory. Samples were preserved        per haul. The sweep area was calculated using the wing
to establish length-weight relationships for each species     spread of the net (17.5 m) and the start and end point al-
and to determine sex composition.                             gorithm in MATLAB®.
    Physical, chemical, optical, and biological variables         Statistical analyses were applied to test differences in
of the water column and bottom types were determined          variables obtained from the species of pufferfish across
prior to sampling to establish meaningful ecological pa-      time, space (depth, region), and sex within species. Three-
rameters. Physical parameters were measured onboard           way analysis of variance (ANOVA) was performed using
from the sea surface and near-bottom waters collected         biomass, abundance, fish total length (TL), fish weight,
with a Nansen water bottle to record temperature, salin-      and sex ratio (female:male) as a function of season,
ity, oxygen, and pH using multi-parameter probes (YSI,        depth, and region. Post-hoc tests (least significant differ-
HiTech); these data were used to calculate water density      ence, LSD) were applied to each variable independently.
(σt). Half-liter samples of water from the sea surface were       Length-weight (L-W) relationships were tested using
filtered through GF/F and GF/C membranes to measure           analysis of covariance (ANCOVA) for differences in the
chlorophyll-a (chl-a) and total suspended matter, respec-     values of intercepts (a) and slopes (b) of the power-fit
tively; then the filters were frozen for later laboratory     regression equations for each season, depth, region, and
work.                                                         species. The constant b was tested for significant differ-
    Optical parameters were measured using a Secchi           ences from an isometric constant of b =3 for fish using the
disk and an ampoule of photosynthetically active radi-        t-student test. Sex composition was the ratio of female:-
ation (PAR) from LI-COR (LI-193SA Spherical Quan-             male individuals and was analyzed for differences among
tum Sensor, ampoule and LI-1400 data logger). A Nansen        seasons, depths, regions, and species. Length frequency
plankton net (70 cm diameter mouth opening and 300            was based on bin size estimates from the COST function
µm mesh size) was hauled from the bottom to the surface       (Shimazaki & Shinomoto, 2007) for each species. Shi-
and material were weighed in three size fractions (> 1.0,     mazaki & Shinomoto (2007) underlined that selection of
0.5, and < 0.063 mm) sorted with a set of sieves. Each        optimal bin size relevant for specific size ranges of each
size fraction was filtered through a GF/C filter to remove    species was of paramount to asses growth cohort. They
macroplankton and frozen. Acoustical data were record-        described that these empirical methods for the bin size
ed to classify bottom types using a scientific echosounder    selection in a bar graph histogram in an order as follows:
(DT-X, BioSonics, Inc.) operating at a frequency of 200       i) estimation of the number of sequences required for the
kHz with a split beam transducer.                             histogram, and ii) estimation of the scaling exponents
    At the laboratory, individual total length (mm) and       of the optimal bin size were corroborated by theoretical
weight (to 0.0001 g) of each species were measured and        analysis derived for a generic stochastic rate process by
sexes were determined for individuals. Some individuals       dividing the observation period T into N bins of width Δ
were juveniles and could not be sexed; they were record-      from the measurement (iii), and counting the frequency
ed as juveniles. Of the environmental parameters, concen-     (ki) of ith bin size (iv), and then constructing the mean

Medit. Mar. Sci., 22/1 2021, 1-19                                                                                       3

                   http://epublishing.ekt.gr | e-Publisher: EKT | Downloaded at 13/09/2021 06:41:04 |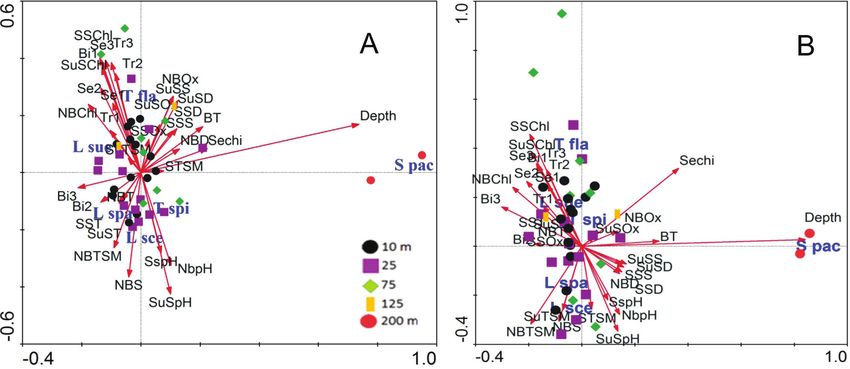
and variance of the number of ki (v) before repeating that            and Tylerius spinosissimus (Regan, 1908). The dominant
computing the cost function changing the bin size Δ to                species was L. suezensis, occurring in high abundance.
search for minimum CΔ* (vi) which is the optimum bin                  L. sceleratus, T. flavimaculosus, and S. pachygaster had
size for the measurement. The kernel density function                 a similar range with moderate abundance. These species
(KDF) was used to estimate number of cohorts and length               occurred with high frequency, but a regional difference in
ranges of each cohort for each species. Spearman’s and                the distribution of each species was observed. T. spino-
Pearson’s correlation analyses were used to measure the               sissimus had the lowest abundance and was found only
degree of association between abundance and biomass of                in the westernmost region of the study area. T. flavimac-
the most common species.                                              ulosus occurred only in R2 and R3, and S. pachygaster
    All statistical analyses were performed using the sta-            was present only in deeper zones compared to the other
tistical tool of MATLAB® (Mathworks Inc.). Canonical                  species.
correspondence analyses (CCA) were applied to a matrix                    Spearman’s correlation analysis was used to measure
set of biomass and abundance of species with a corre-                 the degree of association between abundance and bio-
sponding matrix of environmental parameters to cluster                mass of the most common species (Table 1a) and Pear-
the stations and see if relationships between species and             son’s correlation coefficients were calculated as well to
ecological parameters can be detected using CANOCA                    measure strength of the degree (Table 1b). Abundance
version 4.5.                                                          and biomass of Lagocephalus spp. showed significant
                                                                      correlation with each other, while T. flavimaculosus
                                                                      showed significant positive correlation only with L. su-
Results                                                               ezensis. The unranked strength of the linear relationship
                                                                      between abundance and biomass was measured using
    Six species belonging to the family Tetraodontidae                the Pearson product moment correlation coefficient (Ta-
were found in the Gulf of Antalya in the eastern Medi-                ble 1b). Abundance and biomass of L. guentheri showed
terranean Sea. These species were Lagocephalus sceler-                significant correlation with abundance of L. sceleratus.
atus (Gmelin, 1789), Lagocephalus guentheri Miranda                   Abundance and biomass of L. suezensis showed signif-
Ribeiro, 1915, Lagocephalus suezensis Clark & Gohar,                  icant correlation with biomass of L. guentheri. Torqui-
1953, Torquigener flavimaculosus Hardy & Randall,                     gener flavimaculosus showed no significant correlation
1983 Sphoeroides pachygaster Hardy & Randall, 1983                    with any Lagocephalus spp.

Table 1. Correlations (A, Spearman and B, Pearson) of biomass (B) and abundance (A) of four common pufferfish. Black numbers
indicate correlation coefficients and red numbers significance levels (p value). Bold coefficients were significant at p < 0.05 (n = 79).

                                              L. sceleratus           L. guentheri            L. suezensis         T. flavimaculosus
A                                             B           A           B           A           B           A          B           A
L. sceleratus                     B         1.000       0.990       0.525       0.514       0.360      0.357       0.009       0.014
                                  A         0.000       1.000       0.540       0.529       0.369      0.370       0.007       0.013
L. guentheri                      B         0.000       0.000       1.000       0.998       0.552      0.540       -0.042      -0.023
                                  A         0.000       0.000       0.000       1.000       0.555      0.544       -0.038      -0.019
L. suezensis                      B         0.001       0.001       0.000       0.000       1.000      0.996       0.413       0.418
                                  A         0.001       0.001       0.000       0.000       0.000      1.000       0.416       0.422
T. flavimaculosus                 B         0.937       0.952       0.713       0.737       0.000      0.000       1.000       0.997
                                  A         0.903       0.909       0.840       0.866       0.000      0.000       0.000       1.000
B
L. sceleratus                     B         1.000       0.603       0.263       0.014      -0.035      -0.037      -0.052      -0.057
                                  A         0.000       1.000       0.526       0.412       0.040      0.233       -0.072      -0.057
L. guentheri                      B         0.019       0.000       1.000       0.866       0.546      0.487       -0.086      -0.046
                                  A         0.899       0.000       0.000       1.000       0.263      0.246       -0.063      -0.007
L. suezensis                      B         0.760       0.728       0.000       0.019       1.000      0.851       -0.031      -0.032
                                  A         0.746       0.039       0.000       0.029       0.000      1.000       -0.040      -0.044
T. flavimaculosus                 B         0.647       0.531       0.452       0.581       0.788      0.724       1.000       0.855
                                  A         0.615       0.620       0.686       0.951       0.778      0.701       0.000       1.000

4                                                                                                      Medit. Mar. Sci., 22/1 2021, 1-19

                      http://epublishing.ekt.gr | e-Publisher: EKT | Downloaded at 13/09/2021 06:41:04 |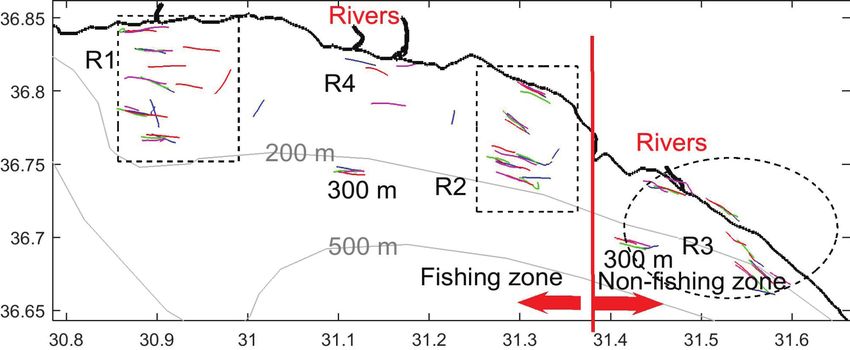
Lagocephalus sceleratus                                           ± 12.04 ind/km2) and minimum abundance in R2 (3.43 ±
                                                                  5.61 ind/km2) and R3 (4.92 ± 5.38 ind/km2). Abundance
    Lagocephalus sceleratus was found at seafloor depths          increased gradually from May (1.77 ± 5.73 ind/km2)
of 10, 25, and 75 m in all regions. The highest biomass           through August (3.88 ± 6.51 ind/km2), and experienced
was 135 kg/km2 in February and the highest abundance              abrupt spikes in October (13.90 ± 5.86 ind/km2) and
was 150 ind/km2 in October and February, particularly             February (16.95 ± 6.16 ind/km2). In contrast to biomass,
obvious in R1 (Fig. 2). Populations were dominated by             abundance decreased with depth from 20.40 ± 6.91 ind/
males May–October, while females were abundant main-              km2 at 10–25 m to 11.36 ± 7.16 ind/km2 at 75 m (Fig. 2B).
ly in February.                                                       Sex ratios did not differ significantly among regions,
    Biomass did not differ significantly among regions,           seasons, and depths (p = 0.338, 0.718, and 0.909, re-
seasons, and bottom depths (ANOVA, p = 0.675, 0.373,              spectively); however, an increase in p values from west
and 0.780, respectively).The highest biomass was highest          (0.09 ± 0.22) to east (1.00 ± 0.44) was observed suggest-
in R1 (X ± SD: 5.43 ± 3.10 kg/km2) and lowest in R3 (0.03         ing strength of dominance of the females. Females were
± 3.16 kg/km2, Fig. 2). Biomass increased from a mini-            mostly absent in May and August, whereas the ratio of
mum in May (0.13 ± 3.34 kg/km2) and August (0.46 ± 3.79           females:males was twice as high in October (0.50 ± 0.25)
kg/km2) to a maximum in October (1.74 ± 3.41 kg/km2)              than in February. The ratio had the same value at 10 and
and February (7.97 ± 3.59 kg/km2). Biomass increased              25 m (0.34 ± 0.29 – 0.33 ± 0.29) and the lowest value at
with depth: 0.97 ± 4.12 kg/km2 at 10 m, 3.69 ± 4.43 kg/           75 m (0.16 ± 0.36, Fig. 2C).
km2 at 25 m and 9.72 ± 4.27 kg/km2 at 75 m (Fig. 2A).                 The total length of L. sceleratus varied between 5.4
    Abundance of L. sceleratus did not differ significantly       and 62.5 cm. The COST function estimated an optimum
among regions, seasons (months), and depths (p = 0.252,           length class interval (i.e., bin size) of 14.28 cm. More
0.215, and 0.269, respectively). Maximum abundance                than half of the total number of fish were longer than 15
was found in R1 (17.35 ± 5.28 ind/km2) and R4 (13.20              cm. The KDF assessed three cohorts from the total length

Fig. 2: Distribution of (A) biomass, (B) abundance (circles square-rooted), and (C) percent sex ratio of Lagocephalus sceleratus
in time (months) and space (regions and depths). Seasonal colors on the figures are: blue for May 2014, green for August 2014,
red for October 2014, and magenta for February 2015. Colors for sex ratio: females follow seasonal color scheme, males are black,
and juveniles are white in seasons.

Medit. Mar. Sci., 22/1 2021, 1-19                                                                                              5

                   http://epublishing.ekt.gr | e-Publisher: EKT | Downloaded at 13/09/2021 06:41:04 |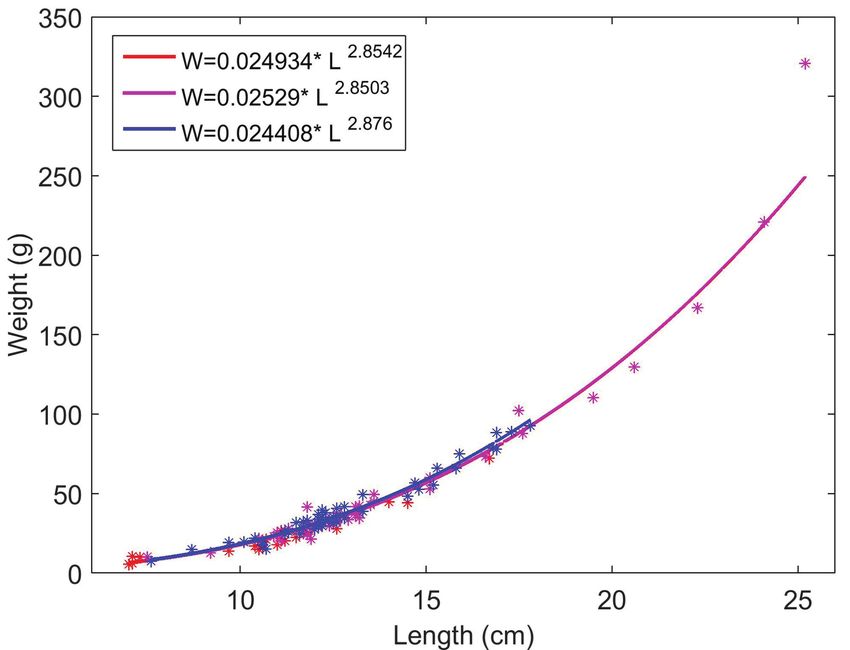
frequency histograms. The number of cohorts was fixed            females, and remaining individuals (n = 44, student t =
at four size classes (< 20, 20–33, 33–50, and > 50 cm);          -0.075; n = 30, t = -0.279, and n = 8, t = -0.160, respec-
one class had no length measurements because the bin             tively). The length-weight relationship was not signifi-
size increased to 30 classes. The length differed signifi-       cantly different between sexes (ANCOVA, p = 0.307).
cantly among seasons, depths, and sexes but not regions          There was no significant difference in the length-weight
(p = 0.019, 0.0001, 0.0002, and 0.103, respectively);            regressions among regions (mean log10-transformed in-
however, post-hoc tests showed that mean lengths were            tercept, a = -1.66 ± 0.15 (X ± SE) and slope, b = 2.79
significantly smaller (7.03 ± 5.80 cm) in R3 than in the         ± 0.13). Slope and intercepts of the regression changed
other regions (20 cm in R1, 29 cm in R2, and 25 cm in            significantly with seasons and bottom depths (p = 0.005
R4) which were not significantly different from each oth-        and 0.019, respectively). The slopes were 3.447, 2.847,
er. The length in February was significantly longer (25.12       2.791, and 3.032 in R1, R2, R3, and R4, respectively,
± 2.83 cm) than that in October (10.63 ± 3.39 cm). The           whereas the intercepts were 0.0031, 0.0163, 0.022, and
lengths in the pairs between other seasons were not sig-         0.0111, respectively. The slopes were 2.827 at 10 m bot-
nificant between seasons (TL; 15 and 18 cm). The total           tom depth, 2.787 at 25 m, and 3.004 at 75 m depth and the
length was significantly longer (33.03 ± 3.51 cm) at 75          intercepts were 0.0189, 0.0226, and 0.0125, respectively.
m bottom depth than similar lengths (13.24 ± 3.25 cm)
at the other two depths (10 and 25 m). Lengths of female
individuals were significantly longer (36.16 ± 4.23 cm)          Lagocephalus guentheri
than that of males (18.27 ± 2.49 cm).
    Individual weights of the fish ranged from 2.04 to               The species L. guentheri was found between 10 and
3700 g during the year. There were significant differenc-        75 m seafloor depth. The maximum biomass was 25 kg/
es in weights among bottom depths and sex (p = 0.004             km2 and maximum abundance was 690 ind/km2 (Fig. 4).
and 0.001, respectively). There were no significant dif-         With the exception of R2 which only had one occurrence,
ferences in individual weights by region. The weights            the species was frequently found in the other regions and
varied between a minima (5.26 ± 299.02 g) in R3 and a            seemed to decrease from west to east across the study
maxima (440.81 ± 366.22 g) in R2. The increase in indi-          area.
vidual weights did not increase significantly from 65.51             Regional differences were observed for the biomass
± 50.59 g in May to 88-94 g in August–October to 481.05          of L. guentheri (ANOVA, p = 0.002). The mean biomass
± 149.20 g in February. However, the weights were sig-           was significantly higher in R4 (7.94 ± 1.79 kg/km2), sea-
nificantly heavier (855.64 ± 185.22 g) at depth (75 m)           ward of the river mouths. R2 had the least biomass (0.02
than the weights (39–143 g) at coastal depths (10–25 m).         ± 0.83 kg/km2), and the other regions varied between
Individual mean weights of females were significantly            0.73 ± 0.80 kg/km2 in R3 and 1.61 ± 0.78 kg/km2 in R1.
higher (1168.5 ± 213.15 g) than that of males (149.44 ±          The biomass did not differ significantly with season (p =
125.71 g).                                                       0.27); however, the biomass increased from May (0.17
    Length-weight (L-W) relationship was estimated for           ± 0.92 kg/km2) through August–to-October (0.68 ± 1.04
males, females, and pooled data (Fig. 3). Fish showed            to 1.59 ± 0.94 kg/km2) to February (2.72 ± 0.99 kg/km2).
isometric growth (b = 2.89) because the slopes were not          The species was found at depths of bottom of 10–25 m
significantly different from the constant (b = 3) for males,     and 75 m during the year (Fig. 4) and showed no signifi-

Fig. 3: Length-weight relationships of males (blue), females (pink), and pooled data (red) of Lagocephalus sceleratus.

6                                                                                               Medit. Mar. Sci., 22/1 2021, 1-19

                     http://epublishing.ekt.gr | e-Publisher: EKT | Downloaded at 13/09/2021 06:41:04 |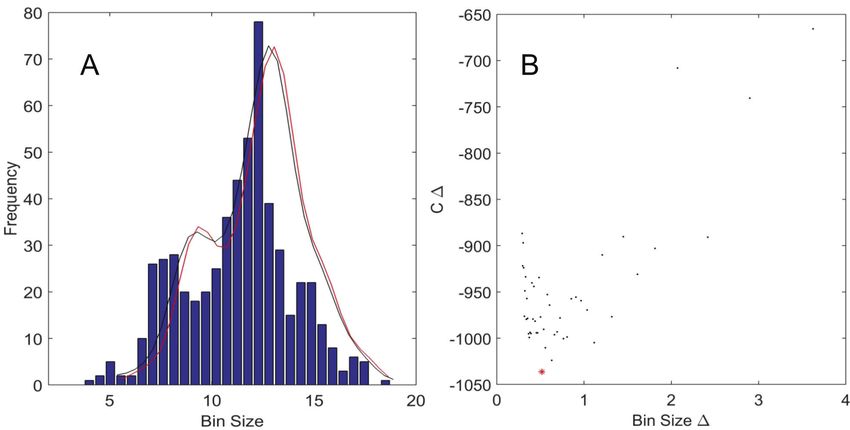
Fig. 4: Distribution of (A) biomass, (B) abundance (circles square-rooted), and (C) percent sex composition of Lagocephalus
guentheri in time (months) and space (regions and depths). Seasonal colors on figures are: blue = May 2014, green = August 2014,
red = October 2014, and magenta = February 2015. Colors for sex ratio: females follow seasonal color scheme, males are black,
and juveniles are white in seasons.

cant differences in biomass as a function of bottom depth        10 m and 0.28 ± 0.29 at 25 m.
(p = 0.135). The biomass decreased with bottom depth                 The total length of L. guentheri varied between 7 and
and was only significantly higher at 10 m (4.28 ± 1.09           25.2 cm during the year. The COST function estimated an
kg/km2) than at 75 m (0.76 ± 1.13 kg/km2).                       optimum size class interval of 0.43 cm. Five cohorts were
    Unlike biomass, abundances were not statistically dif-       fixed using the KDF to estimate the density of each co-
ferent among regions (ANOVA, p = 0.221). The mini-               hort corresponding to minimum densities, ranging from
mum abundance was 0.91 ± 20.66 ind/km2 in R2 and the             19 cm. Cohort 2 dom-
maximum abundance 101.80 ± 44.32 ind/km2 in R4. Re-              inated the population, followed by cohort 3. The lengths
gion R3 had an abundance of 23.32 ± 19.82 ind/km2 and            were significantly different among regions, seasons, bot-
R1 had 32.23 ± 19.44 ind/km2. There was no significant           tom depths, and sex (p = 1.0 × 10⁻⁸, 6.8 × 10⁻⁶, 0.0006,
difference in the abundance among seasons (p = 0.404).           and 0.0031, respectively). The minimum length (12.69
Minimum abundance was estimated in May at 0.86 ±                 ± 0.33 cm) was found in R2 and the maximum length
21.34 ind/km2, while maximum abundance occurred in               (15.88 ± 0.59 cm) was found in R4. The length was not
February (54.05 ± 22.96 ind/km2). Abundance was 28.71            significantly different between R1 (9.26 ± 0.86 cm) and
± 24.27 ind/km2 in August and 19.86 ± 21.84 ind/km2 in           R3 (11.92 ± 0.49 cm). The lengths were significantly lon-
October. Differences in abundance as a function of bot-          ger (24.10 ± 2.73 cm) in May than in other seasons and
tom depth was not statistically significant (p = 0.250);         were not significantly different between October (13.72
however, abundance in shallow waters was significantly           ± 0.52 cm) and February (12.78 ± 0.34 cm) whereas the
higher (80.87 ± 25.46 ind/km2) than in deep waters (0.93         minimum lengths were significantly different in August
± 26.36 ind/km2), and the abundance at 25 m was 55.77            (11.00 ± 0.58 cm). The length decreased from bottom
± 27.35 ind/km2.                                                 depths of 10–25 m (13–12± 0.43 cm) to 50 m (8.98 ±
    Sex ratios did not change significantly among regions,       1.01 cm), and the longest individuals were observed at
seasons, and bottom depths (p = 0.875, 0.865, and 0.188,         bottom depths of 75 m (15.30 ± 2.84 cm). Length (10.81
respectively). Regions 1 and 4 had higher ratios (0.66 ±         ± 0.68 cm) was significantly different by sex. Post-hoc
0.39 each) than R3 (0.34 ± 0.54). The ratios increased           tests showed no significant differences between the total
linearly from August (0.18 ± 0.80) to May (1.00 ± 0.80)          length of females (13.55 ± 0.42 cm) and males (12.79 ±
with a difference of 0.25 between seasons. With respect          0.42 cm).
to bottom depth, the ratios varied between 1.00 ± 0.29 at            Individual weight differed significantly among re-

Medit. Mar. Sci., 22/1 2021, 1-19                                                                                             7

                   http://epublishing.ekt.gr | e-Publisher: EKT | Downloaded at 13/09/2021 06:41:04 |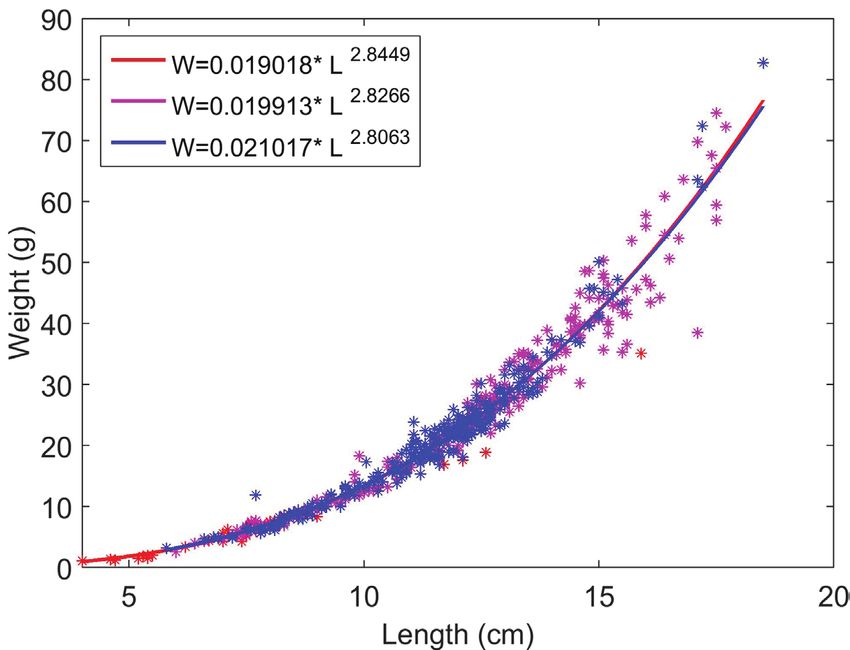
gions, seasons, and sex including pooled sexes (p = 2.9 depths of 25 m (0.0124) and 50 m (0.0420), and one in-
× 10-6, 5.0 × 10⁻⁸, and 0.0203, respectively). Individuals dividual was found in regions with bottom depths of 75
were significantly heavier in R4 (83.37 ± 8.19 g) than m. The L-W relationships were not significantly different
in the other regions, ranging from 21.97 ± 11.90 g in R2 between females and males (Fig. 5).
to 37.91 ± 4.53 g in R1; the latter two did not differ sig-
nificantly from each other. Similar to length, weight was
highest (220.91 ± 34.42 g) in May and lowest (21.19 ± Lagocephalus suezensis
7.34 g) in August. October and February did not differ
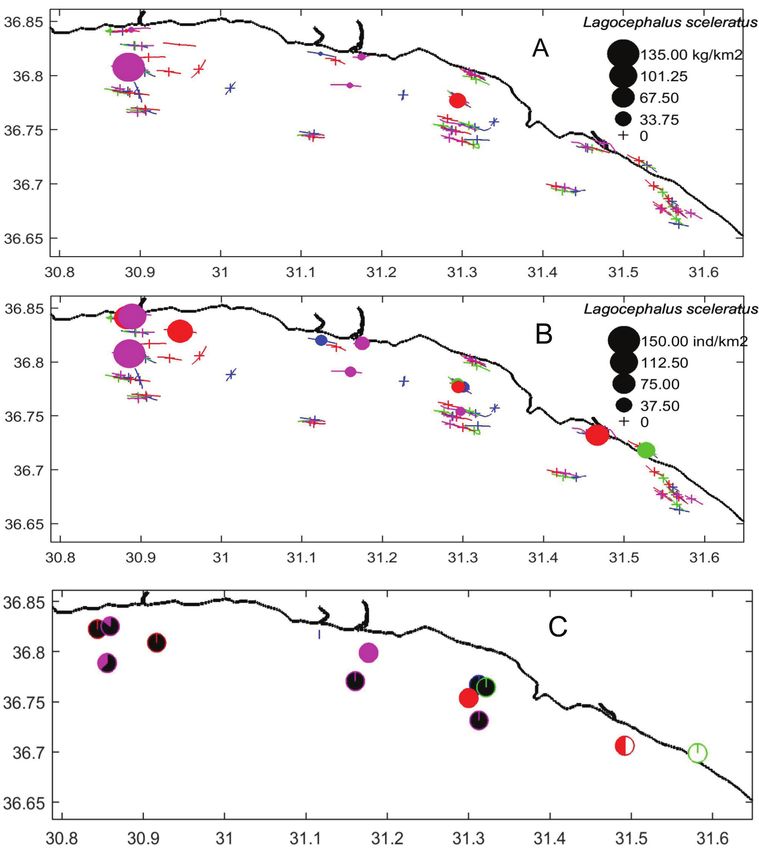
significantly in weight (60.06 ± 6.50 g and 38.98 ± 4.24 The most invasive species, L. suezensis, were abun-
g, respectively), and weight was not significantly differ- dant at all shelf stations with bottom depths of 10–to-125
ent between bottom depths of 50 m (21.89 ± 14.01 g) m (Fig. 6). Maximum average biomass was 300 kg/km2
and 75 m (65.84 ± 39.62 g). Shallow waters had fish of (Fig. 6A), and maximum abundance was 11,024 ind/km2
moderate weight (~ 40 g/ind.). The difference in weight (Fig. 6B). This species was abundantly present in all re-
did not differ significantly between males (40.42 ± 5.58 gions, particularly in R4.
g) and females (52.22 ± 5.64 g). Regional differences were determined statistically for
The length-weight relationship was significantly dif- biomass distribution (p = 0.012). This difference was due
ferent for females, males, and pooled individuals (Fig. to much higher biomass in R4 (62.95 ± 16.31 kg/km2)
5). The slopes of the regression lines were significantly than in the other regions (2.75–10.09 ± 7.40 kg/km2, Fig.
different from the isometric growth value of 3 (n = 112, 7A). The biomass was significantly different among sea-
t = -2.455) for all individuals but not for the males and sons and bottom depths (p =0.448 and 0.269, respective-
females (n = 49, t = -1.474 and n = 48, t = -1.991) at ly). Seasonal biomass varied from 1.59 ± 9.34 kg/km2 in
p < 0.05, resulting in negative allometric growth for the August to 19.57 ± 8.41 kg/km2 in October (Fig. 7B). Bio-
individuals. Overall, there was a significant difference in masses were tended to decrease from shallower waters
length-weight regression constants among regions, bot- (24.32 -30.62 ± 10.04 kg/km2) to deep waters (< 2.00 kg/
tom depths, and sex owing to the contribution from in- km2) (Fig. 7C). Depths greater than 125 m were virtually
dividuals of undefined sex (p = 0.041, 0.044, and 0.038, devoid of L. suezensis.
respectively). Overall, there were no significant differences in abun-
Estimates of slopes and intercepts among regions dance among regions, seasons, and bottom depths (p =
were statistically similar between R1 (2.724 and 0.0355, 0.084, 0.191, and 0.133, respectively, Fig. 6B). Abun-
respectively) and R2 (3.065 and 0.0471, respectively), dance was significantly higher (2294.60 ± 762.64 ind/
and between R3 (3.085 and 0.0125, respectively) and R4 km2) in R4 than in the other regions (from 119.26 ± 355.58
(2.916 and 0.0218, respectively). The slope was signifi- ind/km2 in R2 to 573.61 ± 334.44 ind/km2 in R1). Max-
cantly higher in R3 than in R2 whereas the intercept was imum mean abundance occurred in October (1157.20 ±
significantly lower in R3 than R2. There were no sig- 376.87 ind/km2), while minimum abundance occurred in
nificant differences in L-W regressions among seasons. August (56.24 ± 418.87 ind/km2). Abundance decreased
Only the intercepts differed significantly between bottom with bottom depth from high abundance in shallower
Fig. 5: Length-weight relationships of males (blue), females (pink), and pooled data (red) of Lagocephalus guentheri.
8 Medit. Mar. Sci., 22/1 2021, 1-19
http://epublishing.ekt.gr | e-Publisher: EKT | Downloaded at 13/09/2021 06:41:04 |
Fig. 6: Distribution of (A) biomass, (B) abundance (circles square-rooted), and (C) percent sex composition of Lagocephalus
suezensis in time (months) and space (regions and depths). Seasonal colors on the figures are: blue = May 2014, green = August
2014, red = October 2014, and magenta = February 2015. Colors for sex composition: females follow seasonal color scheme,
males are black, and juveniles are white in seasons.

Fig. 7: Post-hoc test (least significant difference, LSD) of biomasses in kg/km2 of Lagocephalus suezensis among (A) regions, (B)
seasons (1 = May, 2 = August, 3 = October, and 4 = February), and (C) bottom depths. Circle = mean, horizontal bar = standard
deviation, blue mark = to be tested for biomasses among regions, months and depths, red = significant difference, gray = no sig-
nificant difference between vertical discrete gray lines.

waters (> 1000 ind/km2 from 10 to 25 m and low abun-             sex ratios < 2, whereas the ratios were higher in R3 (58.95
dance at greater depths (< 100 ind/km2 from 50–125 m).           ± 33.85) and R4 (20.43 ± 61.79). The ratio was signifi-
   Dominance of females over males did not differ                cantly higher (144.50 ± 49.03) in August than in the other
among regions, seasons, and bottom depths (p =0.611,             seasons. Females predominated in bottom depths of 25 m
0.091, and 0.925, respectively). Regions R1 and R2 had           (53.34 ± 33.82), then decreased to 0.14 ± 56.09 at 75 m;

Medit. Mar. Sci., 22/1 2021, 1-19                                                                                              9

                   http://epublishing.ekt.gr | e-Publisher: EKT | Downloaded at 13/09/2021 06:41:04 |
thereafter, no females were observed in the seaward di- total individuals (Fig. 10). The slopes of the regression
rection. lines were not significantly different from the isometric
Total length of L. suezensis varied between 4 cm and slope of 3 for total and female individuals, but signifi-
18.5 cm during the year (Fig. 8A). The COST function cantly different for males (n = 522, t = -1.761; n = 280,
estimated an optimum size class (bin size) of 0.52 cm for t = -2.138; n = 239, t = -1.928, respectively) at p < 0.05.
total length distribution of the species (Fig. 8B). The KDF This species grew in an isometric type of length-weight
determined five cohorts in total length: 4.0–5.5, 5.5–10.2, relationship.
10.2–14.3, 14.3–17.0, and > 17 cm (Fig. 8A). The third Constants for the length-weight regression equations
cohort was the dominant cohort in the population. were significantly different by regions, bottom depths,
The lengths of the species were significantly differ- and sex, including juveniles and individuals of undefined
ent among regions, seasons, bottom depths, and sex (p = sex (p = 5.0×10⁻⁷, 0.0022, and 0.0008, respectively);
1.3×10⁻¹⁴, 2.5×10⁻¹⁹, 2.0×10⁻⁹, and 2.2×10⁻²⁷, respective- there was no significant difference among the seasons.
ly). The lengths were significantly shorter in R1 (10.21 The slopes and intercepts were not significantly differ-
± 0.19 cm) than the other regions (11.91 ± 0.18 to 12.44 ent between males and females at p < 0.05. The slope
± 0.22 cm) (Fig. 9A). The shortest lengths differed sig- was significantly lower in R2 than in the other regions,
nificantly in October (10.59 ± 0.14 cm) and the longest whereas they were not significant in R1 and R3 (Table
individuals were present in February (13.01 ± 0.26 cm) 2). Regional differences were not estimated by post-hoc
(Fig. 9B). The lengths were significantly longer at bottom tests for length-weight relationships. Like the differenc-
depths of 75 m (12.64 ± 0.44 cm) than lengths in bottom es among sex (excluding undefined sex and juveniles),
depths of 25 m (10.79 ± 0.15 cm) and 50 m (10.26 ± 1.13 depth-wise differences in slopes and intercepts of length-
cm, Fig. 9C). Females were significantly longer (12.37 ± weight relations were not significantly different; greater
0.15 cm) than males (11.35 ± 0.14 cm); however, lengths depths were excluded due to insufficient number of L.
of 8.35 ± 0.40 cm could not be sexed, and juveniles were suezensis individuals.
4.93 ± 0.96 cm in length (Fig. 9D).
Individual weight varied between 1.10 and 82.73 g.
The weight changed significantly with the regions, sea- Torquigener flavimaculosus
sons, bottom depths, and sex (p = 2.8×10⁻¹¹, 4.1×10⁻¹⁶,
5.6×10⁻⁶ and 7.5×10⁻²⁰, respectively). Individuals were The species T. flavimaculosus was found mostly in
significantly heavier in R4 (27.50 ± 1.13 g) than in R1 the eastern part of the study area. The species was not
(16.88 ± 1.01 g) and R2 (23.17 ± 1.52 g). The weight in found in R4 located in front of the river. This species was
May (25.39 ± 1.07 g) was significantly higher than in Oc- distributed on the shelf without exceeding bottom depths
tober (18.32 ± 0.75 g) and lower than in February (29.97 of 75 m, the maximum biomass was 2 kg/km2, and the
± 1.35 g). Individuals were significantly lighter in weight abundance was 150 ind/km2 in the other regions (Fig. 11).
in bottom depths of 25 m (19.59 ± 0.81 g) than at 10 m The biomass of the species was not significantly different
(25.64 ± 0.83 g) and 75 m (26.78 ± 2.34 g). Females were among regions, seasons, and bottom depths (p = 0.190,
heavier (27.40 ± 0.81 g) than males on average (20.88 ± 0.306, and 0.077, respectively); however, the mean bio-
0.75 g). mass was significantly higher in R3 (0.20 ± 0.06 kg/km2)
The total length relationship with weight of L. suezen- than in R1 (0.03 ± 0.06 kg/km2). The seasonal biomass
sis regressed significantly for the females, males, and varied between 0.037 ± 0.08 kg/km2 in August and 0.20
Fig. 8: Lagocephalus suezensis: (A) length-frequency histogram with solution of the KDF in a size class interval estimated by (B)
COST function. Asterisk * = optimum length class interval in cm.
10 Medit. Mar. Sci., 22/1 2021, 1-19
http://epublishing.ekt.gr | e-Publisher: EKT | Downloaded at 13/09/2021 06:41:04 |Fig. 9: Post-hoc test (least significant difference, LSD) in total length in cm of Lagocephalus suezensis among (A) regions, (B)
seasons (1 = May, 2 = August, 3 = October, and 4 = February), (C) bottom depths, and (D) sex (F = female, M = male, NI = sex
not identified, and J = juvenile). Circle = mean, horizontal bar = standard deviation, blue mark = to be tested among the regions,
months, and depths, red = significantly different, gray = not significantly different between vertical discrete gray lines.
Fig. 10: Length-weight relationships of males (blue), females (pink), and pooled data (red) of Lagocephalus suezensis.
± 0.07 kg/km2 in May. The biomass decreased slightly theless, the mean abundance was significantly higher in R3
with bottom depths of 50 m, and then was higher at 75 m (21.24 ± 5.65 ind/km2) than in R1 (4.96 ± 5.54 ind/km2).
(0.35 ± 0.08 kg/km2) only than that at 25 m (0.10 ± 0.08 The maximum seasonal abundance was estimated to be
kg/km2, Fig. 11A). 16.77 ± 6.14 ind/km2 in May, and the minimum abundance
Results of ANOVA showed that abundance did not was 4.18 ± 6.98 ind/km2 in August. Similar to biomass dis-
differ significantly among regions, seasons, and bottom tribution by bottom depth, abundance varied between 7.69
depths (p = 0.160, 0.503, and 0.063, respectively). Never- and 8.33 ind/km2 at 25–50 m, 26.53 ind/km2 at 10 m, and
Medit. Mar. Sci., 22/1 2021, 1-19 11
http://epublishing.ekt.gr | e-Publisher: EKT | Downloaded at 13/09/2021 06:41:04 |Table 2. Estimates of coefficient estimates of length-weight regression equations for Lagocephalus suezensis among regions and
t-tests representing the coefficients (slopes and log10-transformed intercepts) of power-fit regression line. Bold p values are signif-
icant and representative of slopes and intercepts in the equations.
Term Estimate Std. Err. t p
Intercept -1.686 0.0264 -63.68 1.6*10-256
1 -0.058 0.0340 -1.72 0.0855
2 0.312 0.0673 4.64 4.2*10-6
3 -0.034 0.0328 -1.03 0.3012
4 -0.220 0.0405 -5.43 8.0*10-8
Slope 2.814 0.0247 113.78 0.0000
1 0.068 0.0326 2.09 0.0367
2 -0.289 0.0626 -4.62 4.7*10-6
3 0.021 0.0307 0.71 0.4789
4 0.199 0.0374 5.33 1.4*10-7
Fig. 11: Distribution of (A) biomass, (B) abundance (circles square-rooted), and (C) percent sex composition of Torquigener flavi-
maculosus in time (months) and space (regions and depths). Seasonal colors on the figures are: blue = May 2014, green = August
2014, red = October 2014, and magenta = February 2015. Colors for sex composition are: females follow seasonal color scheme,
males = black, and juveniles = white in seasons.
12 Medit. Mar. Sci., 22/1 2021, 1-19
http://epublishing.ekt.gr | e-Publisher: EKT | Downloaded at 13/09/2021 06:41:04 |25.14 ind/km2 at 75 m (Fig. 11B). 0.517, 0.803, and 0.342, respectively). Regression equa-
Dominance of females over males was not significant tions of L-W relationships are shown in Figure 12 for fe-
among regions, seasons, and bottom depths (p = 0.291, males, males, and total individuals pooled. The species
0.094, and 0.081, respectively). The female:male ratio showed significant isometric growth in length with the
varied seasonally between 3.3×10⁻¹⁶ ± 0.55 by male dom- weights for the all individuals, males, and females (n =
inance in R1 and 1.16 ± 0.45 by female dominance in 33, t = 0.012; n = 22, t = -0.347, and n = 10, t = 0.101,
R2. The ratio was significantly higher in February (1.81 respectively) at p < 0.05.
± 0.48) than in May (0.36 ± 0.37). In the other seasons,
females were mostly absent with males present in high
abundance. Greater bottom depths (75 m) had high- Sphoeroides pachygaster
er abundances of females (1.55 ± 0.44) as compared to
males. One of two rare species belonging to the family
The total length (TL) of T. flavimaculosus ranged Tetraodontidae was S. pachygaster, found at two trawl
from 3.6 to 11.1 cm in the study area. The optimum stations. This species was caught only at bottom depths
length class interval was estimated to be 1.07 cm for the of 200 m in October (R2) and February (R1). The max-
length distribution; however, one cohort (3.6–11.1 cm in imum biomass was estimated to be 30 kg/km2 with the
TL) was estimated. The length changed significantly with maximum abundance of 120 ind/km2 in February (R1),
bottom depth and sex (p = 0.037 and 4.5×10⁻⁵, respec- which is higher than in October (16 kg/km2 and 20 ind/
tively). Regional length distributions varied between 6.02 km2, respectively). The number of males was 16 ind/km2
± 0.80 cm in R1 and 8.07 ± 0.62 cm in R2. Seasonally, in February. The number of females varied between 20
the maximum length was 7.95 ± 1.43 cm in August and ind/km2 in October and 36 ind/km2 in February. Lengths
the minimum length was 6.28 ± 0.72 cm in October. The ranged from 12.0 to 30.4 cm, whereas individual weights
specimens were significantly longer at bottom depths of varied from 48.43 to 600 g. Males were shorter than 15
75 m (8.16 ± 0.50 cm) than at 10 m (6.27 ± 0.43 cm). cm, with weights of 50–60 g and females were 15–30
Female individuals were significantly longer (8.94 ± 0.48 cm long and weighed between 100 and 600 g. Statisti-
cm) than males (7.18 ± 0.33 cm). Specimens with lengths cal significance of the measurements was not expected
less than 5.0 cm could not be sexed. to test the differences among the regions, seasons, and
Similar to length distribution, individual weights were bottom depths because the number of individuals was in-
significantly different with respect to bottom depth and sufficient (only two males and four females in the catch)
sex (p = 0.010 and 0.001, respectively). There were no to establish L-W relationships, but six individuals could
significant seasonal or regional differences in weight. be useful to establish L-W significant regression lines for
There were light individuals in R1 (5.35 ± 2.82 g) and total specimens (W = 0.060334L2.6995) of this rare species
in October (5.76 ± 2.51 g) and heavy individuals in R2 (unpublished data).
(12.43 ± 2.18 g) and in May and August (~ 11 g). There
were significantly heavier individuals at bottom depths
of 25 m and 75 m (~ 13 g) than at 10 m (5.56 ± 1.44 g). Tylerius spinosissimus
Females were significantly heavier (15.74 ± 1.83 g) than
males (8.25 ± 1.23 g). Individuals that weighed less than Tylerius spinosissimus was found only in R1 at bottom
3 g could not be sexed. depths of 50 m in October and 75 m in February. In to-
Length-weight relationships did not differ significant- tal, three individuals were caught. The biomass varied be-
ly by region, season, bottom depth, and sex (p = 0.050, tween 0.02 kg/km2 in February and 0.05 kg/km2 in October
Fig. 12: Length-weight relationships of males (blue), females (pink), and unisex pooled data (red) of Torquigener flavimaculosus.
Medit. Mar. Sci., 22/1 2021, 1-19 13
http://epublishing.ekt.gr | e-Publisher: EKT | Downloaded at 13/09/2021 06:41:04 |with abundance ranging from 31 ind/km2 and 13 ind/km2, started by de Meo et al. (2018), with a focus on the spa-
respectively. Length varied between 3.4 and 4.7 cm and tio-temporal dynamics of the entire fish community.
weight ranged between 0.84 and 2.41 g. It was not possible Six species of pufferfish were found in the study area.
to identify sex. The most invasive species was L. suezensis, with abun-
dance up to 10,000 ind/km2. Based on frequency of occur-
rence, two rare species, T. spinosissimus and S. pachygas-
Species distribution-environmental parameter relations ter, were discovered. The other four species had moderate
abundance up to 700 ind/km2. Abundance of species with-
Abundance and biomass of all species were discrim- in the genus Lagocephalus tended to differ among re-
inated by bottom depths on the first CCA axis with an gions, with higher density in the estuarine area and in Oc-
explained variance of 53.6% (Fig. 13). Most of the spe- tober and February. Along Egyptian coasts, these species
cies were positively correlated with chl-a and biologi- reached maximum density between autumn and winter
cal parameters (tripton, seston, and the larger bioseston (El-Haweet et al., 2016). Lagocephalus sceleratus, which
fraction) and negatively correlated with water pH on the commonly occur between seafloor depths of 18 and 100 m
second CCA axis, which accounted for a cumulative ex- in the Indo-Pacific (Smith & Heemstra, 1986), colonized
plained variance of 74% (Fig. 13); however, the variance and became established rapidly in the coastal area of the
was not significantly explained by the Monte Carlo test Nile Delta (Halim & Rizkalla, 2011). From there it spread
(F = 7.166, p = 0.256 for CCA1 and F = 1.022, p = 0.480 towards the Algerian coast, where it was found at a depth
for all axes). Bottom depths were discriminated by the of bottom of 50–60 m (Kara et al., 2015), and towards the
first CCA axis, grouping shallow waters (mon species, L. sceleratus were longer and heavier than the present study area and other oligotrophic regions
males, in contrast to the findings for L. sceleratus along along the Turkish coast (Taşkavak & Bilecenoğlu, 2001;
Antalya’s coast (Aydın, 2011). Such sexual dimorphism Aydın, 2011). Aydın (2011) estimated six cohorts for L.
in size was attributed to an in increase in the fecundity of sceleratus, which are consistent with the first four size
the females (Parker, 1992). classes of the present study. Lengths of T. flavimaculo-
Growth was isometric for all species except L. guen- sus ranged from 5.5 to 13.5 cm in Rhodes Island, Greece
theri and males of L. suezensis, which presented negative (Corsini-Foka et al., 2006). Among the common species
allometry. L. suezensis also showed negative allometric in this study, the maximum length of L. sceleratus and
growth in a eutrophic region, the Gulf of Iskenderun, Tur- L. suezensis were observed in the coldest months (Octo-
key (Başusta et al., 2013b). The L-W relationship of L. ber–February), whereas the total length of L. guentheri
sceleratus was in line with the results of other studies in and T. flavimaculosus was higher in the warmest months
the eastern Mediterranean (Kalogirou, 2013; Boustany et (May–August). However, spatio-temporal distribution of
al., 2015; Farrag et al., 2015); however, Başusta et al. length of L. sceleratus was discordant with previous re-
(2013a) found L. sceleratus with a b value in Iskenderun sults (Özbek et al., 2017). At Rhodes Island, large-sized
Bay lower than our findings and the findings by Aydın individuals of L. sceleratus densely populated the san-
(2011) in the Gulf of Antalya. Furthermore, Bilge et al. dy bottom in autumn, while small-sized individuals (5–6
(2017) estimated negative allometric growths for four cm) dominated the seagrass habitat during spawning time
common pufferfish species along the coasts of Muğla, in summer, retreating to sandy bottoms thereafter. As
adjacent to the present study area. individuals grew in length, they performed an ontogen-
T. flavimaculosus was found in high abundance in ic migration retreating to greater depths during autumn
spring, but was not found in the estuarine waters; instead, (Kalogirou, 2013).
it mostly inhabited the eastern part of the study area. S. Sex ratios changed in both space (region and depth)
pachygaster was the only pufferfish found at a bottom and time (season). The females of L. sceleratus and L.
depth of 200 m; however, this species was previous- guentheri dominated in the non-fishing zone, whereas
ly caught at 80 m in the Tyrrhenian Sea (Bedini, 1998) females of L. suezensis were dominant in the western-
and 180 m in the Mediterranean Sea (Tursi et al., 1992; most region of the fishing zone. In general, abundance
Hemida et al., 2009; Farrag et al., 2016; Carbonara et al., of females and males showed similar trends with respect
2017) and the Saroz Gulf in the Aegean Sea (Eryılmaz et to length over time, but decreased as bottom depth in-
al., 2003), and in a range between 80 and 400 m bottom creased. Two rare species were observed only in the cold
depth off the coast of Sicily (Ragonese et al., 1997). Lipej season (October–February). Females of S. pachygaster
et al. (2013) found the species at a depth of 20 m in the were longer and heavier than males, consistent with that
northernmost part of the Adriatic Sea. reported along Sicilian coasts (Ragonese et al., 1997).
The other common species (L. guentheri, L. suezen- Pufferfish were distributed primarily according to
sis, L. sceleratus) inhabited shallow waters, generally depth of seafloor. Sphoeroides pachygaster was discrim-
less than 75 m deep; however, L. suezensis was found in inated far away from species that inhabit shallow waters
waters less than 40 m deep off the coasts of Syria, Isra- on the CCA orientation. Most pufferfish species are of
el, and Libya (Golani, 1996; Corsini et al., 2005; Saad, tropical origin; however, distribution did not correlate
2005; Ben-Abdallah et al., 2011), while it was caught at with hydrographical parameters, especially water tem-
sites with bottom depths of 125 m in the present study. perature. This could be due to a change in population
T. spinosissimus originated from the bathyal zone of In- dynamics between seasons because small-sized individ-
do-Pacific Sea and was not observed in waters shallower uals were observed during spawning time in spring and
than 50 m. This species spread to different parts of the summer, while larger fish occurred in autumn and winter.
Mediterranean Sea, ranging from 52 m in Iskenderun Densities of L. suezensis and T. flavimaculosus cor-
Bay, Turkey (Turan & Yaglioglu, 2011), through 50–80 related positively with chl-a and seston concentrations
m off Rhodes Island, Greece (Corsini, 2005; Corsini-Fo- and negatively with water pH and salinity, in contrast
ka, 2010), down to 120 m off the coast of Tel Aviv in the to the other shallow water species. However, pufferfish
eastern Mediterranean (Golani et al., 2011) and below to feed on macrobenthos and fish (Aydın, 2011; Kalogirou,
the bathyal zone (350–400 m) off Eilat in the Red Sea 2013). Previous studies in the Gulf of Antalya showed
(Fricke et al., 2016). Abundance of all species peaked a significant and positive correlation of the crustacean
during October–February. community with bioseston and chl-a (Patania, 2015) and
Each species had characteristic ranges of length and of the fish assemblages in shallow waters (10–25 m) with
weight. The largest species (TL > 30 cm) were L. scel- the fine fraction comprised of seston and the near-bottom
eratus and S. pachygaster, middle-sized species (TL chl-α (de Meo et al., 2018). Torquigener flavimaculosus
10–30 cm) were L. guentheri, L. suezensis, and T. flavi- was mostly found in regions near beds of Posidonia oce-
maculosus, and the smallest species (TL < 5 cm) was T. anica.
spinosissimus, which is consistent with previous reports
(standard length < 3 cm, Corsini-Foka, 2010; Turan &
Yaglioglu, 2011; Fricke et al., 2016). Lagocephalus scel-
eratus and L. guentheri were reported to be larger in eu-
trophic Iskenderun Bay (Başusta et al., 2013a) than in
Medit. Mar. Sci., 22/1 2021, 1-19 15
http://epublishing.ekt.gr | e-Publisher: EKT | Downloaded at 13/09/2021 06:41:04 |Conclusion Mediterranean). Marine Biodiversity Records, 12 (1), 11.
Artüz, M. L., Kubanç, S.N., 2015. First record of the Lessep-
In conclusion, four pufferfish species have invaded sian migrant Lagocephalus sceleratus (Gmelin, 1789) (Tetra-
and spread throughout the Gulf of Antalya in the eastern odontidae) in the Sea of Marmara. Thalassas, 31 (2), 55-58.
Mediterranean Sea. In addition, two invasive pufferfish Aydın, M., 2011. Growth, Reproduction and diet of pufferfish
species were recorded in the cold season. Spatio-tempo- (Lagocephalus sceleratus Gmelin, 1789) from Turkey’s
ral distribution of density, sex composition, and length- Mediterranean Sea Coast. Turkish Journal of Fisheries and
weight relationships differed remarkably among species. Aquatic Sciences, 11, 569-576.
Species belonging to the genus Lagocephalus were more Azzurro, E., Castriota, L., Falautano, M., Bariche, M., Broglio,
abundant in October–February, whereas T. flavimaculo- E. et al., 2016. New records of the silver-cheeked toadfish
sus occurred mostly in spring. Regions vegetated by Po- Lagocephalus sceleratus (Gmelin, 1789) in the Tyrrhenian
sidonia oceanica were correlated with the density of L. and Ionian Seas: early detection and participatory monitor-
sceleratus depending on its reproductive season. ing in practice. BioInvasions Records, 5 (4), 295-299.
Generally, fish weight increased isometrically with Başusta, A., Başusta, N., Özer, E.I., 2013a. Length-weight rela-
length. Sphoeroides pachygaster was found at bottom tionship of two puffer fishes, Lagocephalus sceleratus and
depths of 200 m, while the other five species inhabited Lagocephalus spadiceus, from Iskenderun Bay, northeast-
shallow waters, commonly less than 75 m deep but in ern Mediterranean, Turkey. Pakistan Journal of Zoology,
some cases, up to 125 m. Larger individual pufferfish 45 (4), 1047-1051.
appeared at deeper zones while L. suezensis and T. fla- Başusta, A., Başusta, N., Özer, E.I., Girgin, H., Aslan, E.,
vimaculosus preferred more productive regions. Abun- 2013b. Some Population Parameters of The Lessepsian
dance of other shallow water pufferfish correlated with Suez Puffer (Lagocephalus suezensis) From Iskenderun
water temperature, salinity, and pH. Estimates of popula- Bay, Northeastern Mediterranean, Turkey. Pakistan Journal
tion growth parameters and models of future population of Zoology, 45 (6), 1779-1782.
dynamics are recommended for further study. Bedini, R., 1998. First record of Sphoeroides pachygaster
(Tetraodontidae) from the northern Tyrrhenian Sea. Cybi-
um, 22 (1), 94-96.
Acknowledgements Beköz, A.B., Beköz, S., Yilmaz, E., Tüzün, S., Beköz, Ü., 2013.
Consequences of the increasing prevalence of the poison-
The present study was funded by the Scientific Re- ous Lagocephalus sceleratus in southern Turkey. Emergen-
search Coordination Unit of Akdeniz University, within cy Medicine Journal, January 2013.
the framework of Project Number 2014.01.0111.001, Belmaker, J., Parravicini, V., Kulbicki, M., 2013. Ecological
principally coordinated by Erhan Mutlu. This study was traits and environmental affinity explain Red Sea fish in-
part of Ilaria de Meo’ MSc thesis and Claudia Miglietta’s troduction into the Mediterranean. Global Change Biology,
MSc thesis. We thank Ahmet Şahin, M. Tunca Olguner, 19, 1373-1382.
and Cansu Olguner for their help onboard the R/V Ak- Ben-Abdallah, A., Al-Turky, A., Nafti, A., Shakman, E., 2011.
deniz Su. We thank the two anonymous referees for their A new record of a Lessepsian fish, Lagocephalus suezensis
valuable comments. (Actinopterygii: Tetraodontiformes: Tetraodontidae), in the
south Mediterranean (Libyan coast). Acta Ichthyologica Et
Piscatoria, 41 (1), 71-72.
References Bilecenoglu, M., Kaya, M., Akalin, S., 2006. Range expansion
of silverstripe blaasop, Lagocephalus sceleratus (Gmelin,
Akyol, O., Aydın, İ., 2016. A new record of Lagocephalus 1789), to the northern Aegean Sea. Aquatic Invasions, 1 (4),
guentheri (Tetraodontiformes: Tetraodontidae) from the 289-291.
north-eastern Aegean Sea. Zoology in Middle East, 62 (3), Bilge, G., Filiz, H., Yapici, S., 2017. Length-weight relation-
271-273. ships of four Lessepsian puffer fish species from Muğla
Akyol O., Aydın I., 2017. Occurrence of blunthead puffer, coasts of Turkey. Natural and Engineering Sciences, 2 (3),
Sphoeroides pachygaster (Müller and Troschel, 1848) 36-40.
(Tetraodontidae) in north-eastern Aegean Sea (Izmir Bay, Boustany, L., Indary, S.E., Nader, M., 2015. Biological char-
Turkey). Journal of Applied Ichthyology, 33, 524-526. acteristics of the Lessepsian pufferfish Lagocephalus scel-
Akyol, O., Unal, V., Ceyhan, T., Bilecenoglu, M., 2005. First eratus (Gmelin, 1789) off Lebanon. Cahiers de Biologie
confirmed record of Lagocephalus sceleratus (Gmelin, Marine, 56, 137-142.
1789) in the Mediterranean Sea. Journal of Fish Biology, Carbonara, P., Kolitari, J., Đurović, M., Gaudio, P., Ikica, Z.
66, 1183-1186. et al., 2017. The presence of Tetraodontidae species in the
Al-Mabruk, S.A.A., Vasilis-Orestis, S., Periklis, K., Giovos, I., Central Mediterranean: an update from the southern Adriat-
2018. The first record of Torquigener flavimaculosus (Tetra- ic Sea. Acta Adriatica, 58 (2), 325-338.
odontiformes: Tetraodontidae) from Libya. International Çelik, M., Deidun, A., Uyan, U., Giovos, I., 2018. Filling the
Journal of Fisheries and Aquatic Studies, 6 (4), 449-450. gap: a new record of diamondback puffer (Lagocephalus
Alshawy, F., Ibrahim, A., Hussein, C., Lahlah, M., 2019. First guentheri Miranda Riberio, 1915) from the west-eastern
record of the oceanic puffer Lagocephalus lagocephalus Mediterranean Sea, Turkey. Journal of Black Sea/Mediter-
(Linnaeus, 1758) from the Syrian marine waters (eastern ranean Environment, 24 (2), 180-185.
16 Medit. Mar. Sci., 22/1 2021, 1-19
http://epublishing.ekt.gr | e-Publisher: EKT | Downloaded at 13/09/2021 06:41:04 |You can also read