Cost-Benefit Analysis of the Upland-Rice Root Architecture in Relation to Phosphate: 3D Simulations Highlight the Importance of S-Type Lateral ...
←
→
Page content transcription
If your browser does not render page correctly, please read the page content below
ORIGINAL RESEARCH
                                                                                                                                              published: 12 March 2021
                                                                                                                                         doi: 10.3389/fpls.2021.641835

                                             Cost-Benefit Analysis of the
                                             Upland-Rice Root Architecture in
                                             Relation to Phosphate: 3D
                                             Simulations Highlight the Importance
                                             of S-Type Lateral Roots for Reducing
                                             the Pay-Off Time
                                             Daniel Gonzalez 1,2 , Johannes Postma 3 and Matthias Wissuwa 2*
                                             1
                                               Graduate School of Agriculture and Life Sciences, The University of Tokyo, Tokyo, Japan, 2 Crop, Livestock,
                                             and Environment Division, Japan International Research Center for Agricultural Sciences, Tsukuba, Japan,
                             Edited by:      3
                                               Forschungszentrum Jülich GmbH, Institute of Bio- and Geoscience – IBG-2: Plant Science, Jülich, Germany
       Ricardo Fabiano Hettwer Giehl,
     Leibniz Institute of Plant Genetics
       and Crop Plant Research (IPK),        The rice root system develops a large number of nodal roots from which two types of
                                Germany      lateral roots branch out, large L-types and fine S-types, the latter being unique to the
                       Reviewed by:          species. All roots including S-types are covered by root hairs. To what extent these fine
                        Ulises Rosas,
     National Autonomous University          structures contribute to phosphate (P) uptake under P deficiency was investigated using
                   of Mexico, Mexico         a novel 3-D root growth model that treats root hairs as individual structures with their
                        Xiaorong Fan,
 Nanjing Agricultural University, China
                                             own Michaelis-Menten uptake kinetics. Model simulations indicated that nodal roots
                  *Correspondence:
                                             contribute most to P uptake followed by L-type lateral roots and S-type laterals and
                    Matthias Wissuwa         root hairs. This is due to the much larger root surface area of thicker nodal roots. This
                  wissuwa@affrc.go.jp        thickness, however, also meant that the investment in terms of P needed for producing
                   Specialty section:
                                             nodal roots was very large. Simulations relating P costs and time needed to recover that
         This article was submitted to       cost through P uptake suggest that producing nodal roots represents a considerable
                        Plant Nutrition,
                                             burden to a P-starved plant, with more than 20 times longer pay-off time compared to
               a section of the journal
            Frontiers in Plant Science       S-type laterals and root hairs. We estimated that the P cost of these fine root structures
       Received: 15 December 2020            is low enough to be recovered within a day of their formation. These results expose
        Accepted: 16 February 2021           a dilemma in terms of optimizing root system architecture to overcome P deficiency: P
         Published: 12 March 2021
                                             uptake could be maximized by developing more nodal root tissue, but when P is growth-
                              Citation:
            Gonzalez D, Postma J and
                                             limiting, adding more nodal root tissue represents an inefficient use of the limiting factor
      Wissuwa M (2021) Cost-Benefit          P. In order to improve adaption to P deficiency in rice breeding two complementary
     Analysis of the Upland-Rice Root
                                             strategies seem to exist: (1) decreasing the cost or pay-off time of nodal roots and (2)
Architecture in Relation to Phosphate:
              3D Simulations Highlight       increase the biomass allocation to S-type roots and root hairs. To what extent genotypic
     the Importance of S-Type Lateral        variation exists within the rice gene pool for either strategy should be investigated.
Roots for Reducing the Pay-Off Time.
          Front. Plant Sci. 12:641835.       Keywords: OpenSimRoot, Oryza sativa (L.), phosphate uptake, L-type lateral roots, root branching, root hairs,
       doi: 10.3389/fpls.2021.641835         modeling

Frontiers in Plant Science | www.frontiersin.org                                    1                                           March 2021 | Volume 12 | Article 641835
Gonzalez et al.                                                                                                  DJ123 Cost-Benefit Analysis Simulation

INTRODUCTION                                                                  hairs are directly involved in P uptake from the soil (Gahoonia
                                                                              and Nielsen, 1998) and that they are particularly effective in
Rice consumption in Africa is increasing rapidly, leading to a                overcoming the combined effects of water and P deficiency stress
widening gap between demand and local rice production (Nigatu                 (Brown et al., 2012). Considering that S-type lateral roots appear
et al., 2017). One reason for this widening gap is the relatively             to be unique to rice, that these roots can contribute more than
low rice productivity in Sub-Saharan Africa (SSA), which is due               half of the total root system length (Nestler et al., 2016), and that
to a combination of low production inputs and unfavorable                     they are covered by even finer root hairs, it becomes evident that
production environments (Saito et al., 2019). About 30% of the                rice has a particularly high proportion and amount of very fine
rice cropping area in Africa is in the more stress-prone uplands              root structures exploring the soil for resources like water and
(Diagne et al., 2013) where irrigation is nor provided. The average           nutrients, which should be especially beneficial for poorly mobile
upland rice yields in Africa are around 1.2 t ha−1 (Drame and                 nutrients like P.
Manneh, 2013) compared to an average of 4.75 t ha−1 in irrigated                 What is not known is to what extent each root class and the
rice in Asia in 2016 (IRRI World Rice Statistics, 2020).                      hairs developing on them contribute to total plant P uptake. It
    African farmers producing upland rice are generally low-                  would be of interest from a plant breeding point to estimate
income farmers that acquire very limited amounts of fertilizers               to what extent changes in properties of different root classes
and other inputs (Tsujimoto et al., 2019). Their economic                     and hairs would improve P uptake, as this would allow for
conditions exacerbate problems inherent to the uplands, where                 the formulation of clear breeding targets with relation to which
highly weathered soils such as Oxisols tend to bind phosphate                 specific root system trait would provide the largest improvements
(P) in plant-unavailable forms. High P fixation in soils coupled              in P uptake. For example, using a modeling approach Zygalakis
with low P fertilization rates cause P to be the primary limiting             et al. (2011) predicted that increasing root hair length would
factor in the production of rice in SSA (Saito et al., 2019). It is           improve P uptake more than increasing root hair density.
therefore of utmost importance that rice varieties with improved              Genotypic differences in root hair length have been reported for
P acquisition and utilization efficiency are developed, as these              rice grown in soil and gene bank accession DJ123 was found to
provide a cost-efficient partial solution to the soil fertility problem       have slightly longer hairs compared to other genotypes (Nestler
in SSA (Vandamme et al., 2015).                                               and Wissuwa, 2016). To what extent genotypes differ in S-type
    Screening experiments have shown that genotypic differences               lateral root development has not been investigated in detail.
exist for tolerance to P deficiency in the rice germplasm (Fageria               While mathematical models and computational simulations
et al., 2013; Vandamme et al., 2015) and that this can be caused              of rice and rice growth have been ongoing for almost 30 years
by differences in P acquisition efficiency (Mori et al., 2016), P             (Morita and Abe, 1994), to our knowledge, modeling studies have
utilization efficiency (Wissuwa et al., 2015), or by a combination            not yet addressed the effect of differences in S-type length and
of both (Rose et al., 2013). P acquisition was found to mainly                density in the presence of root hairs.
depend on differences in root system size with smaller effects                   Recently, De Bauw et al. (2020) presented a functional-
contributed by differences in P uptake efficiency characterized by            structural model that computes water and P uptake from an
superior P uptake per unit root size (Mori et al., 2016; Wissuwa              upland rice variety, Nerica4, utilizing CRootBox.They concluded
et al., 2020). One of the P deficiency tolerant rice genotypes                that S-type laterals would indeed contribute prominently to P
combining vigorous seedling root growth with high P uptake                    uptake. Furthermore, their main conclusion was that the total
efficiency is the gene bank accession ‘DJ123’ (Wissuwa et al.,                number of root tips growing into previously undepleted soil
2020). It originates from Bangladesh and belongs to the aus sub-              are the main contributors to overall P uptake from a low-P
species of rice that is well known as a source of donors for abiotic          soil and that L-type laterals and the secondary branching from
stress tolerance.                                                             these L-type laterals may contribute significantly to total root
    The size of a root system is the sum of its different components          tip number. The model developed by De Bauw et al. (2020)
and in rice four main classes of roots are distinguished; main root           successfully predicted water and P uptake in a P-fertilized soil,
axes are formed by the primary root and subsequent nodal roots                but underestimated P uptake from an unfertilized low-P soil.
(also called crown roots) and both classes give rise to two classes           They hypothesized that this underestimation may be due to four
of lateral roots (Rebouillat et al., 2009). The larger L-type lateral         factors; not accounting for the effect of mycorrhization, possible
roots contain several layers of cortex cells and typically have               solubilization of immobile P by root exudates, overestimation
secondary or even tertiary branches while the small S-type lateral            of the Michaelis constant (Km), and additional P uptake
roots contain only one layer of cortical cells, are unbranched                contributed by root hairs.
and short with a maximum of around 1 cm and a diameter                           Many of the current plant models have been developed and
smaller than 50 µm (Wissuwa et al., 2020). S-type laterals develop            designed based on the results from experiments conducted in
on both main axes and L-type laterals. They have so far only                  containers with relatively limited width. This has caused the
been reported for rice but not for other cereals. An order of                 issue of the root architecture being skewed toward a narrow
magnitude finer than these S-type laterals are root hairs and                 and deep spread of roots. Analyses of rice root growth in
recently Nestler et al. (2016) showed that these hairs develop on             the field has shown the opposite: a large proportion of roots
all root classes in rice, including on S-type roots, where they are           are concentrated in the topsoil (first 15 cm), even for upland
present in high density but at slightly reduced length compared               rice genotypes (Wissuwa et al., 2020). This was not only due
to hairs on the main axes. Experiments have shown that root                   to extensive root branching in the topsoil layer but also to

Frontiers in Plant Science | www.frontiersin.org                          2                                     March 2021 | Volume 12 | Article 641835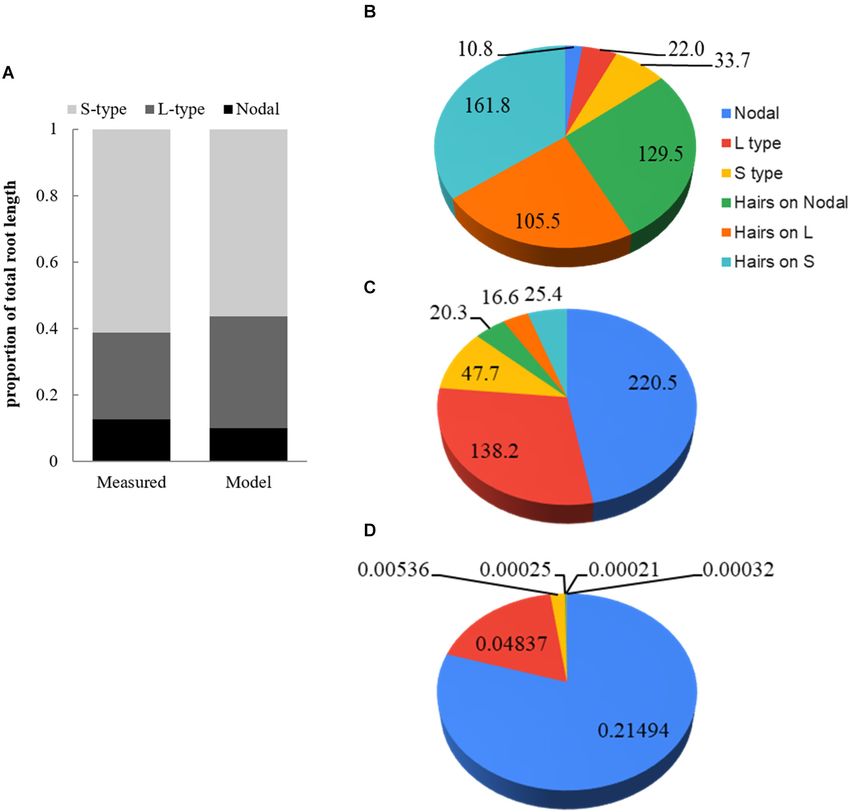
Gonzalez et al.                                                                                             DJ123 Cost-Benefit Analysis Simulation

considerable extension of crown roots horizontally (Mori et al.,          the determination of digest P concentrations in a microplate
2016). It is therefore imperative that model parameterization             reader at 882 nm wavelength using the molybdenum blue assay
be developed based on field data, and not just greenhouse                 defined by Murphy and Riley (1962).
data. We consider that the difference in root spread and depth               A greenhouse experiment used the same field soil in containers
seen from different experimental setups can be significant, as P          of dimensions 23 × 46 × 15 cm depth (22-L) for harvests at
concentrations in the topsoil are higher compared to deeper soil          7 and 14 DAE or dimensions of 40 × 60 × 30 cm (72 L)
layers (Mori et al., 2016).                                               for harvests at 21 and 28 DAE. Plants were sampled in weekly
   With this in mind, we believe that an assessment of the                intervals by cutting off one side from the container and using
influence of S-types, root hairs, and general positioning of roots        a gentle water spray to remove the soil. This allowed us to
on P uptake is necessary.                                                 excavate and scan intact root systems with minimum breakage.
   The lack of an upland rice model including all fine structures         Afterward, the plants were treated and stored in the same
and a root distribution pattern not affected by spatial limitations       manner as the excavated plants from the field experiments
in root proliferation enticed us to develop such a model. We              mentioned above.
decided to base our model on the P efficient breeding line
DJ123 for several reasons, namely that its root system had been           Root Scanning and Analysis
characterized in several prior studies which showed DJ123 to              Roots were spread out in a 20 × 25 cm Perspex tray filled
be similar to other rice genotypes for many root traits (Mori             with 0.5 cm of and scanned using an Epson Perfection V700
et al., 2016; Nestler and Wissuwa, 2016; Wissuwa et al., 2020);           photo dual-lens scanner with top lighting, with the following
and that its efficient P uptake appears due to a combination of           settings: 600 dpi, 8-bit grayscale, positive film. Obtained images
factors such as good early root vigor and high P uptake efficiency,       were analyzed by the WinRhizo software (Version 2008a, Regent
rather than being caused by the extreme expression of a single            Instruments Inc) using a manual pixel classification with a gray-
root phenotype (Wissuwa et al., 2020). Specifically, the objectives       scale value of 225, to improve fine root detection. The debris
of our study were (1) to obtain detailed data on root growth              filter was set to avoid counting debris with an area smaller
and P uptake of upland rice from both field and greenhouse                than 1 cm2 , and a length/width ratio smaller than 5. The root
experiments using DJ123 as a representative P-efficient upland            system was divided into diameter classes of: 0–90, 90–250,
rice genotype; (2) to use this data to parameterize and test a            250–400, 400–600, 600–1,000 nm, which correspond to S-type
root architecture model that includes root hairs; (3) to use this         laterals (
Gonzalez et al.                                                                                              DJ123 Cost-Benefit Analysis Simulation

static and variable input parameters defining the root system                 • Tillering: Rice tillering was also implemented in the model
development. For an extended explanation of the model, readers                  and tillers will produce nodal roots originating from the
can refer to Postma et al. (2017).                                              lowest tiller nodes.

    • Rate of root primordia formation (day−1 ): This variable is              In modeling root growth, we made defined parameters for the
      defined for crown roots as the rate at which their creation          following root classes:
      from the hypocotyl occurs, and is dependent on the time                 • Primary root (more highly branched compared
      that has passed since the seed was planted.                               to nodal roots).
    • Inter-branching distances (IBD, cm) define the distance                 • Nodal root branched.
      between one branching lateral root and the next. To                     • Nodal root fast (rapidly elongating nodal roots with less
      account for varying lateral root densities, we modeled IBDs               branching, increasing in frequency during later stages
      based on parent-root-specific distributions, using normal                 of development).
      distributions (means and standard deviations derived                    • Nodal roots of tillers (with a phenotype in between the
      from experimental data) with truncated tails defined by                   other two nodal root classes).
      maximum and/or minimum values. The model computes                       • L-type lateral roots, with a distinction between branching
      the rate of primordia formation from the IBD, using the                   off the primary root or nodal roots.
      parent root elongation rate at the time the primordia was               • S-type lateral roots, with a distinction between branching
      formed. Thus, faster growing roots form more primordia                    off the primary root versus branching off nodal roots and
      per time. IBD input parameters are given in Supplementary                 L-type lateral roots.
      Table 2. More frequent branching on the branched nodal
      roots was achieved manually through (i) modifying the                    Root hairs develop on each of the above root classes but with
      IBD distribution of fast nodal roots to roughly double the           varying root hair length and density between (i) primary root,
      IBD during the initial 2 weeks of root development, and              (ii) nodal and L-type lateral roots, and (iii) S-type lateral roots
      (ii) to reduce subsequent branching frequencies since we             (Nestler et al., 2016).
      observed that lateral root densities were higher in the basal            Making use of the modular nature of OpenSimRoot, we
      half of the branched nodal roots.                                    defined modules for growth of primary/nodal roots and L-type
    • Growth rates (cm day−1 ): These are defined depending                laterals, S-type laterals, and root hairs, and modules defining
      on the time since a root was created or branched                     branching of L-type laterals, S-type laterals, and root hairs.
      (in days). Each root class has its own growth rate                       Root growth of genotype DJ123 was simulated over a 35-day
      derived from observations from weekly samplings in                   period with a maximum timestep of 0.2 days for conditions of
      the greenhouse experiment. The growth rate is slower                 the highly P-fixing and therefore P deficient Andosol. Since P
      initially (root emergence), reaches a maximum 2–10 days              is considered the growth-limiting factor and since the root to
      after creation, and slows down thereafter. Each root                 shoot ratio is known to significantly increase in these conditions
      received a multiplication factor pooled from a (log) normal          (Wissuwa and Ae, 2001; Fageria et al., 2013), we did not model
      distribution such that roots of the same class vary in growth        root growth in dependence of photosynthetic carbon resources
      rate and final length (see Supplementary Table 3).                   but on the observed growth of P-deficient DJ123 (Wissuwa
    • General direction or growth: The initial growth direction            et al., 2020). The soil was assumed to have a homogeneous
      is set by specified radial and axial branching angles. As            distribution of P.
      the roots grow, the direction was changed by a tropism
      vector. The tropism vector is the combination of several             Modeling P Uptake in OpenSimRoot
      vectors representing gravitropism, random impedance, and             A radial advection-diffusion-reaction model was used to simulate
      nutrient tropisms.                                                   P uptake rates (µmol cm−1 day−1 ) at individual root vertices.
    • Root diameter: The root diameters were set static for all root       P-uptake rates were integrated over the length of the root
      classes (0.065, 0.05, 0.06, 0.02, and 0.0045 cm for primary          system and time to get the total P uptake by the plant
      and fast nodal roots, branched nodal roots, nodal roots of           (Silberbush and Barber, 1983, 1984). P uptake is modeled for
      tillers, L-type and, S-type lateral roots, respectively).            each individual root considering its length, radius, and presence
    • Specific root volume (cm3 g−1 ): It was assumed to be                of root hairs (at specific length and density). The soil parameters
      static, as senescence and cell apoptosis was not considered          related to P availability were obtained based on analyses of the
      in this model. Values were derived from measured root                Andosol used in pot and field experiments and are summarized
      biomass and corresponding root volume data of WinRhizo               in Supplementary Table 1 (Rakotoson, unpublished data).
      for the entire root system. Values used were 0.08 g cm−3             Simulations based on these values significantly underestimated
      for primary and nodal roots and this increased to 0.09 and           measured plant P uptake, despite the inclusion of root hairs and
      0.1 g cm−3 for L-type and S-type lateral roots, respectively.        S-type laterals (see introduction). We presume that rice roots can
      This increase is reflecting the decreasing proportion of             solubilize small amounts of P in the rhizosphere to achieve this
      aerenchyma in fine roots and was supported by the                    but did not simulate the solubilization per se as data describing
      observation of increasing specific root volume in root               the relevant processes is not available. To simulate the correct
      systems with a lower proportion of nodal roots.                      P uptake, we instead changed the initial P concentration in the

Frontiers in Plant Science | www.frontiersin.org                       4                                    March 2021 | Volume 12 | Article 641835
Gonzalez et al. DJ123 Cost-Benefit Analysis Simulation
soil solution from the measured 83 nM to 540 nM, which is still DAE in greenhouse/field experiments). Costs were estimated by
very low. For the buffer power (b) we used a value of 6,000 and multiplying simulated root class weight times the average root
the corresponding soil diffusion (De) was 9.227e−6 cm2 day−1 P concentration of DJ123 at 28 DAE (0.8 mg g−1 ). The cost
(Supplementary Table 1). recovery in days was estimated for three cases (see Table 3). In
addition, simulations of cost-benefits were run for hypothetical
Sensitivity Analysis and Model root systems with shorter (0.5×) or longer (2.0×) S-type or
L-type lateral roots and for reduced fast nodal root thickness
Simulations (from 0.65 to 0.50 cm diameter).
A sensitivity analysis with five repeat runs was conducted with
model base values altered by 25, 50, 100, 150, 200, and 400%.
The analysis was conducted for two soil parameters (soil P
concentration and buffer power) and six plant parameters: length RESULTS
and inter-branching distance for L-type and S-type roots, and
length and density of root hairs. Effects of parameter variations DJ123 Rice Root Architecture
on P uptake for a 28-day period were simulated. Observations made during root excavations and in root scans led
We explored the cost-benefit aspects of different root classes. us to define 4 major root classes (primary root, crown roots, and
The weight of roots was calculated by the model as a function of L-type and S-type laterals), of which nodal roots were divided into
root volume and specific densities of 0.06 g cm−3 for nodal roots, three subclasses we termed branched nodal roots, fast nodal roots
0.07 g cm−3 for L-type roots, and 0.1 g cm−3 for S-type roots (faster elongating and less branched compared to the branched
and root hairs. Different specific volumes (cm3 /g) were assigned nodal roots), and nodal roots forming on tillers (in-between fast
to root classes depending on the proportion of aerenchyma and branched nodal roots). The primary root was observed to
present in the respective class. The estimation of costs and be the most densely branched root with the longest lateral roots
benefits (P taken up) were simulated until day 31 (equal to 28 (Figure 1). The first nodal roots developing were of the branched
FIGURE 1 | (A) Scan of a root system excavated 14 DAE from the greenhouse experiment showing the highly branched primary root as well as two nodal root
classes and L-type and S-type lateral roots. Fast nodal roots start to develop between 7 and 14 DAE and therefore remain very small. (B) magnified region with a
high density of S-type lateral roots. (C) Simulated root at 21 DAE where roots with their surrounding P depletion zones are shown for better visibility of lateral roots.
Color coding identifies root classes: blue, primary root; dark red, branched nodal root; green, fast nodal root; yellow, L-type laterals; red, S-type laterals; light green,
nodal roots from tillers. (D) Top-down view of a simulated root system at 28 DAE.qq.
Frontiers in Plant Science | www.frontiersin.org 5 March 2021 | Volume 12 | Article 641835Gonzalez et al. DJ123 Cost-Benefit Analysis Simulation
class, being of intermediate length (35 cm at 28 DAE) with a primary root (0.02 cm) compared to crown and L-type laterals
growth rate of up to 1.5 cm day−1 and a root diameter between (0.015 cm). Root hairs on S-type laterals were shorter (0.012 cm)
340 and 650 µm (Table 1). Fast nodal roots started to develop and the maximum density was lower (400 hairs cm−1 ) compared
between 7 and 14 DAE and increased in frequency as the root to L-type lateral (700 hairs cm−1 ) and nodal roots (1,440 hairs
system matured. The length of the longest root excavated from cm−1 ). Based on observations by Nestler and Wissuwa (2016), it
the field at 28 DAE was 45 cm (Table 1). Assuming that the was assumed that the proportion of roots being alive is decreasing
longest root was also the oldest one, we estimated it to be 21 days over time and this was modeled as a linear decreasing root hair
old and derived an average growth rate of 2.14 cm day−1 . The density over time (e.g., from 600 hairs cm−1 on a 3-day old root
diameter of the fast nodal roots was larger compared to branched to 330 hairs cm−1 on a 40-day old root).
nodal roots, ranging from 550 to 850 µm. Measurements of root length and depths, taken during
Lateral roots varied in length and, presumably, in growth excavations in the field at 28 DAE, provided data for root growth
rates, with L-type and S-type lateral roots having developed on angles (RGA) of crown roots. These varied between 8 and 90
the primary root being 10% longer compared to roots from a degrees (from the soil surface), with most roots having RGAs
branched nodal root. Similarly, root hairs were longer on the between 16 and 30◦ (Figure 2A; n = 64). Overall, 62% of nodal
TABLE 1 | Observed maximum root length, derived maximum daily growth rates, and typical ranges of root diameters observed on primary, nodal, and lateral roots.
Root type Maximum length Estimatedx growth rate Diameter Root hair density Root hair length
cm cm day−1 µm cm−1 cm
Primary root 46 2.19 500–700 1,400 0.02
Nodal root (branched) 35 1.46 340–650 1,400 0.015
Nodal root (long) 45 2.14 550–850 1,400 0.015
L-Type root 14.6 0.73 130–200 700 0.015
S-Type root 1.08 0.14 35–45 400 0.012
x Growth rates were estimated by dividing maximum length by root age. It was assumed that maximum length of all roots was achieved by the oldest of their class and
that branched nodal roots formed from 2 DAE, fast nodal roots from 7 DAE, and L-type roots from 4 DAE.
FIGURE 2 | (A) Distribution of root growth angles (RGA, in degree from the soil surface) of nodal roots excavated 28 DAE from the field experiment and (B) partially
excavated root system used to determine RGAs. The fast nodal roots are indicated in comparison to their branched counterparts. (C) A branched nodal root growing
at a shallow angle developing a large number of L-type and S-type laterals. (D) Micrograph of an L-type lateral root section with S-type lateral roots and root hairs.
Frontiers in Plant Science | www.frontiersin.org 6 March 2021 | Volume 12 | Article 641835Gonzalez et al. DJ123 Cost-Benefit Analysis Simulation
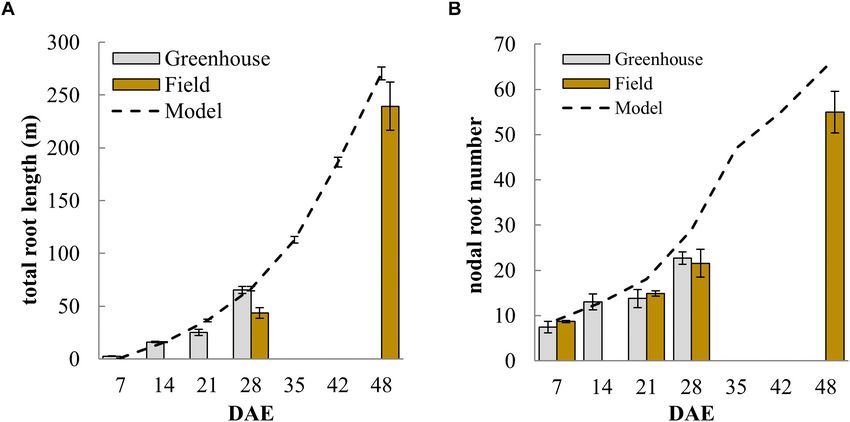
roots had an RGA ≤ 45◦ . The distribution of RGAs appears rapid during the first 7 to 10 days and that this was followed
to be steeper in Figure 2B than measured data would suggest by a slower increase in nodal root number during the next 7
(Figure 2A) but this is caused by roots growing toward the to 10 days (Figure 3B). Thus, root development during the first
observer having been fully excavated and thereby losing their 28 days neither followed a purely linear nor exponential growth
original root angle. trend. The model matched this initial slowdown (Figure 3B) by
L-type and S-type lateral roots were assumed to develop slowing the rate of nodal root formation from day 10. The slowing
perpendicular to their root of origin and their growth direction down might be associated with the depletion of seed reserves that
would therefore depend on where on the parent root they supported rapid root development initially.
were initiated. The distribution of root development along the
branched nodal root partially excavated from the field and Simulation of Root Hairs and Effects on
shown in Figure 2C would suggest that the L-type lateral roots Total Root Length and P Uptake
preferentially develop or extend on the downward side of nodal At 28 DAE the WinRhizo analysis of root scans indicated that
roots whereas S-type laterals appear as frequently on the upper about 61% of the total root length was contributed by S-type
half. This was simulated in OpenSimRoot by setting a boolean lateral roots, followed by 26% for L-type lateral and only 13%
command named “cannotgrowup” which ‘corrects’ the growth for nodal roots including the primary root (Figure 4A). Modeled
direction of upward growing roots to horizontal. The L and S proportions were in general agreement, but L-type laterals had
type roots have no gravitropism modifier, whereas the primary increased to 33.6% with ensuing minor reductions of other
root has a strong (−0.115 to −0.015 cm/cm/day) gravitropism, classes. Furthermore, simulations allowed us to compare the total
and crown roots a weak (−0.0001 cm/cm/day) gravitropism. length of root hairs to the length of the root system and individual
root classes. The total length of all root hairs is 6.9-time the length
Comparison of Simulated and Observed of the root system. Root hairs on S-type lateral roots are short
Root Growth of DJ123 (0.12 mm) and present in lower density compared to L-type and
The total root length (TRL) simulated by the model is the result nodal roots, nevertheless we estimated that 29.7% of the total
of the various model inputs and shall thus be used to verify that root hair length is due to hairs on S-types (Figure 4B). The
simulated root system development is reflecting the observed proportion of total root hair length on L-type laterals is 38.7%.
root growth. The model slightly over-estimated TRL at 21 DAE Hairs on all root classes combined have an estimated length of
and again at 48 DAE but was in-between the observed TRL 482.3 m compared to 52.9 m for the actual roots. Due to the
from greenhouse and field experiments at 28 DAE (Figure 3A). small diameter of root hairs (5 µm) their contribution to total
The biggest deviation form simulated total root length was seen root surface area is only 13.3% (Figure 4C). They only constitute
in the field sample at 28 DAS and this may have been due to 1.8% of total root volume (Figure 4D).
slower early root development in the field during the earlier
part of the season when lower night-time temperatures may have Simulation of P Uptake
limited growth. A main difficulty in modeling root development P uptake was initially modeled using the measured soil solution P
during the first 3 to 4 weeks stemmed from the observation that concentration of 83 nM and that resulted in a plant P content
nodal root emergence was non-linear. Nodal root emergence was of only 150.6 µg at day 28 (data not shown), compared to a
FIGURE 3 | Development of (A) nodal root number and (B) total root length over time comparing measured values from greenhouse and field experiments with
simulated data from the model. Error bars represent standard deviations (n = 4).
Frontiers in Plant Science | www.frontiersin.org 7 March 2021 | Volume 12 | Article 641835Gonzalez et al. DJ123 Cost-Benefit Analysis Simulation
FIGURE 4 | Comparison of root class distributions between (A) measured and model data and (B) modeled contribution (%) by root classes including root hairs
developing on respective classes for total root length, (C) surface area, and (D) volume.
measured P content of 774.3 µg. Such underestimation of P Sensitivity Analysis and Cost-Benefit
uptake under highly P deficient conditions is commonly observed Simulations
in P uptake models, indicating that more P is typically available
The sensitivity analysis estimated to what extent P uptake was
to the plant than suggested by soil P extractions (Kirk et al., affected by changes in model input parameters. Variations in soil
1999). To account for the higher measured P uptake, we assumed
P concentrations across the entire 16-fold range from 25% to
that the roots, possibly through pH changes or some other 400% showed a near-linear and proportional effect on P uptake
rhizosphere modification, can solubilize P thereby increasing (Table 2). Changes in soil buffer (b) and the corresponding
the P concentration in soil solution. Adopting a soil solution P changes in the diffusion coefficient (De) were less influential
concentration of 540 nM increased simulated P uptake to within and seemed to be more sensitive to large increases than to
standard deviations of measured P content at 21 and 28 DAE proportionally large decreases. Effects of altering lateral root
(Figure 5). All further simulations are using this higher soil P length and density were also assessed through changing the
concentration in order to generate simulated P uptake that is “inter-branching distance” (IBD). Greater IBD leads to fewer
comparable to observed uptake. However, even with this higher lateral roots and, consequently, less uptake. Changes in lateral
P concentration the model continued to underestimate P content root length and density were more influential in L-type than
in the field at 48 DAE (Figure 5) and this is because the P taken up S-type lateral roots and increasing L-type length was most
per unit root length increased in the field to 26.2 µg P m−1 from effective in increasing P uptake (Table 2). The model was less
12.1 µg P m−1 at 28 DAE (Supplementary Figure 1). Respective sensitive to proportional decreases than to increases in lateral
values simulated by the advection-diffusion model implemented root length and density. Similar effects were detected for root hair
in OpenSimRoot were almost constant, only changing from 11.6 length, but simulated P uptake was rather insensitive to changes
to 12.4 µg P m−1 between 28 and 48 DAE. in root hair density.
Frontiers in Plant Science | www.frontiersin.org 8 March 2021 | Volume 12 | Article 641835Gonzalez et al. DJ123 Cost-Benefit Analysis Simulation
Table 3). If one would simulate a root system without root hairs
(Case 3) a continuously growing nodal root system would never
reach the point where P uptake exceeds the P cost of producing
the root system.
To test to what extent these large differences in benefit
to cost ratio are affected by the model root parameterization,
additional simulations were conducted with hypothetical root
systems having reduced or increased S-type and L-type lateral
root length or reduced nodal root diameter. Halving or doubling
lateral root length had only minor effects on benefit-cost ratios
(Supplementary Table 4). More influential was a decrease in
diameter of fast nodal roots (from 0.65 to 0.50 cm), offering over-
proportionally high cost savings of 25% while lowering P uptake
by only 8.2% (Supplementary Table 4). While this meant nodal
roots changed from a net-sink to a source of P, benefit-cost ratios
of other root types remained several-fold higher.
DISCUSSION
FIGURE 5 | Plant P content over time comparing measured values from
greenhouse and field experiments with simulated data from the model. Error
The potential utility of root architectural models in
bars represent standard deviations (n = 4). conceptualizing factors determining resource acquisition
has long been recognized. Here our objective was to develop
a 3D root architectural model for upland rice, using root
When plant growth is directly limited by P availability, any developmental parameters obtained by stepwise excavation of
new tissue produced incurs a cost in term of P allocated to the partial root systems of field grown plants or of entire seedling root
respective tissue and this can be compared to the benefit this systems from experiments conducted in containers large enough
root provides in terms of P uptake. P uptake over a 28-day to not restrict root development of young plants. A further step
growth period was far higher in nodal roots compared to L-type to simulate an upland rice root system as realistically as possible
and S-type lateral roots, and this was associated with the larger was the inclusion of root hairs as individual cylinders of given
surface area nodal roots produced, despite having much lower length and diameter, as opposed to simply expanding the overall
total length (Table 3). Our simulations further showed that more radius of the parent root by the root hair length. Parameters of
than 80% of the total root system weight was due to nodal roots, root hair length and density were adopted from Nestler et al.
which also meant that they contributed a similarly high share to (2016), Nestler and Wissuwa (2016) who showed root hairs to
the cost of a root system in terms of P invested. Root hairs on exist even on S-type lateral roots. They furthermore showed root
the other hand were negligible in terms of cost but increased P hair length to differ between root classes and to be substantially
uptake by 19%, adding 22% of extra surface area and sixfold extra shorter in soil than in nutrient solutions. These findings have
length (Table 3). been included in the specification of root hair parameters for the
When P uptake efficiency was estimated as P taken up per first time in this model.
root length, main root axes were more efficient due to their larger
diameter and surface area, however, per root weight finer roots Modeling Root Development and 3D
and especially root hairs were far more efficient. When P uptake Root Architecture
efficiency was estimated based on root surface area, root classes Our model was able to simulate the root development of our
were rather similar with a slight efficiency advantage for S-type model genotype DJ123 closely in terms of total crown roots
lateral roots. As a result of their very low cost, roots hairs had or total root system length produced (Figure 3). The image
the best benefit to cost ratio, and we estimated that over the presented in Figure 1 furthermore showed that crown roots
31 day growth period, their cumulative P uptake exceeded their developed at different angles from shallow to near-vertical. Our
cost (P invested in producing them) by a factor 176.8 (Table 3). model estimated 87% of the roots to be present in the top 25 cm
Based on the cost of a root class and the daily P uptake of (data not shown) and this compares to 79% of root biomass in
that root class (static – both at 28 DAE) the number of days the top 25 cm detected in root excavations by Mori et al. (2016).
needed to recover that cost was estimated (Case 1, Table 3), Roots in that study were from 105-day old plants, which would
suggesting that S-type lateral roots recover their own cost on have developed a higher proportion of deep roots compared to
the day of their emergence, whereas a nodal root would require our simulated plant at 28 DAE.
more than 12 days. Using a different cost-recovery scenario that In excavating roots we could visibly distinguish 2 classes of
estimates the break-even time point of a hypothetical developing crown roots based on their thickness and the degree of branching.
root system made up entirely of one single root class puts nodal We have termed these branched and long nodal roots and to
roots even more at a disadvantage relative to lateral roots (Case 2, our knowledge such a distinction has not been made before.
Frontiers in Plant Science | www.frontiersin.org 9 March 2021 | Volume 12 | Article 641835Gonzalez et al. DJ123 Cost-Benefit Analysis Simulation
TABLE 2 | Sensitivity analysis for two soil parameters (P concentration in soil solution and soil buffer power) and six root parameters (length and density for L-type roots,
S-type roots, and root hairs).
P concentration in soil solution Soil buffer power
Factor level P content (µg) Change (%) Factor level P content (µg) Change (%)
0.25 416 30 0.25 866 62
0.5 732 53 0.5 1,071 77
1 1,391 100 1 1,391 100
1.5 2,029 146 1.5 1,622 117
2 2,659 191 2 1,827 131
4 5,087 366 4 2,738 197
L-type length S-type length
Factor level P content (µg) Change (%) Factor level P content (µg) Change (%)
0.25 947 68 0.25 1,160 83
0.5 1,080 78 0.5 1,221 88
1 1,391 100 1 1,391 100
1.5 1,696 122 1.5 1,520 109
2 1,995 143 2 1,678 121
4 3,301 237 4 2,273 163
L-type branching distance S-type branching distance
Factor level P content (µg) Change (%) Factor level P content (µg) Change (%)
4 974 70 4 1,155 83
2 1,100 79 2 1,230 88
1.5 1,196 86 1.5 1,282 92
1 1,391 100 1 1,391 100
0.5 1,925 138 0.5 1,669 120
0.25 3,042 219 0.25 2,232 161
Root hair length Root hair density
Factor level P content (µg) Change (%) Factor level P content (µg) Change (%)
0.25 1,190 86 0.25 1,222 88
0.5 1,215 87 0.5 1,278 92
1 1,391 100 1 1,391 100
1.5 1,624 117 1.5 1,481 107
2 1,899 137 2 1,545 111
4 3,168 228 4 1,804 130
Parameters were varied by a factor 0.25×, 0.5×, 1.5×, 2.0×, and 4×, with factor level 1 representing the base model. The sensitivity analysis estimated effects of
parameter variations on P uptake for a 28 day period (25 DAE). Data shown are means of 5 repeat simulations.
Nodal roots developing on young seedlings were of the branched presumably be to maximize exploration for water and nutrients
class and as the plant matured, an increasing proportion of and that fast nodal roots did not develop in young seedlings may
crown roots were of the faster and longer class. We hypothesized simply be a reflection of their larger diameter which incurs a
that such a change in predominant class is related to inter- higher cost in terms of P and biomass. In combination with less
root competition for resources as root zones may increasingly branching it would take longer to recover that cost compared to
overlap closer to the point of origin. Developing fast extending branched crown roots and this could be more of a limiting factor
roots with little branching in the first 10 cm would be a way in younger plants.
to limit placing resources in that overcrowded soil volume,
however, model simulations did not support this hypothesis as Modeling Total P Uptake Over Time
overlapping depletion zones were found to be generally low and Using the extremely low measured soil P concentrations (0.083
hardly affected by the presence or absence of the fast nodal nmol mL−1 ) in modeling P uptake severely underestimated the
root type (Supplementary Figure 2). Thus, the main advantage actual measured P uptake in DJ123. Such underestimation is
of rapidly extending roots into yet to be explored soil would common in Barber-Cushman-based models if soil P availability
Frontiers in Plant Science | www.frontiersin.org 10 March 2021 | Volume 12 | Article 641835Gonzalez et al. DJ123 Cost-Benefit Analysis Simulation
TABLE 3 | Model simulation results by root class (and root hairs) showing root dimensions, costs in terms of P needed to produce roots, and benefits in terms of
P taken up.
P uptake Total root P uptake efficiency Benefit to cost Cost recovery
Length Surface Weight Cost Length Surface Weight Case 1 Case 2 Case 3
µg m cm2 mg µg P µg m−1 µg cm−2 µg mg−1 ratio days days days
Hairs 110.0 395.9 62.2 0.78 0.6 0.3 1.77 141.4 176.8
S-type 107.4 33.7 47.7 4.6 3.7 3.2 2.25 23.1 28.9 0.4 1.0 1.0
L-type 174.5 21.9 138.2 50.5 40.4 7.9 1.26 3.5 4.3 2.7 4.8 5.1
Nodal 297.4 10.8 220.5 399.9 319.9 27.6 1.35 0.7 0.9 12.5 24.8 Never
Total 689.2 462.4 468.6 455.9 364.7 1.5 1.47 1.5 1.9
Costs were estimated based on a P concentration of 0.8 mg g−1 in all root classes including hairs. Data shown is for 31 days after germination (equivalent to 28 DAE in
field and greenhouse experiments). The cost recovery in days was estimated for three cases. Case 1 is forward looking, estimating the time needed to recover the cost
of a respective root class based on static costs and P uptake rates at 28 DAE. Case 2 and 3 are based on the cumulative costs and P uptake, starting at the time point a
respective root class had emerged and simulating the days needed until cumulative P uptake has surpassed cumulative costs. For case 2 root hairs are included on the
respective root classes whereas case 3 simulated P uptake without root hairs.
is very low (Kirk et al., 1999), indicating that some processes producing roots of a certain class. Due to their minute biomass,
that increase P availability, such as pH effects, root exudation, we estimated that root hairs have taken up 176-times more P
or soil microbial effects, are not properly accounted for in the than was necessary to construct them (at 28 DAE). P uptake
model. We acknowledge that such processes should ideally be to investment ratios were also high for S-type lateral roots and
addressed in future models, but that is beyond the scope of the simulating different root system architectures showed that the
present study primarily focusing on contributions of different cost-benefit advantage of root hairs and S-type lateral roots over
roots class to overall P uptake. We solved the underestimation of other root types was very consistent (Supplementary Table 4).
P uptake by increasing soil P concentrations to a level (540 nM) The high cost of producing nodal roots meant that their direct
where P uptake matched observed uptake. While this may appear P uptake did not fully recover their cost. This could be reversed
arbitrary, it allows us to model within the range of observed P by reducing the crown root diameter, which incurred savings
uptake without making further assumptions about specific but in terms of P cost that were greater than losses in P taken up.
untested P solubilization mechanisms. However, to what extent reduced crown root diameter would
The soil P concentrations used enabled us to closely match compromise water uptake needs to be considered. A slightly
observed P uptake of field and greenhouse experiments up to different way of evaluating cost and benefits would be to consider
28 DAE, however, at 48 DAE field P uptake remained 81% the cost recovery time. Despite some differences between cases
higher compared to our modeled uptake. We hypothesize that 1 to 3, the common picture emerging from the cost recovery
this may be due to additional P provided through the arbuscular analysis was that low-cost S-type lateral roots and root hairs break
mycorrhiza (AM) pathway. Using the same soil Wissuwa et al. even within 1 day, which would make them the root structure of
(2020) showed that roots of DJ123 and other rice genotypes choice for a root system adapted to P deficiency. The much later
started to be colonized by AM from 21 DAE onward and that break-even point for crown root would furthermore explain why
the symbiosis was active by 28 DAE without having contributed crown root number is very strongly reduced under P deficiency
much additional P until then. It is likely that P provided through (Wissuwa et al., 2020).
the AM pathway would increase with time in the field and may
therefore add significantly to total plant P content at 48 DAE.
If our hypothesis is true, at 48 days, as much as 40% of P Optimizing the Root System
uptake might have come from VAM. We note, however, that A question of practical relevance in plant breeding is related to
other mechanisms may contribute to additional P uptake as well, the choice of traits to be targeted in selection in order to maximize
including slow release of P, mineralization of P, or solubilization varietal performance. In the context of the present study one
through slowly changing rhizosphere pH. may explore different root classes and their properties as likely
targets for selection. The sensitivity analysis identified L-type
lateral root length and root hair length as the two most influential
Modeling P Uptake by Root Class and parameters. That the length of L-type lateral roots was more
Cost-Benefit Analysis influential compared to S-type length was likely due to the fact
In simulations of P uptake with and without root hairs present, that longer L-types automatically produce more S-type laterals,
we could estimate the contribution of root hairs and other root assuming a constant branching frequency of S-types on L-types.
classes to P uptake. Most P (43%) is taken up by the nodal This would be consistent with the conclusion by De Bauw et al.
roots with L-type laterals also contributing substantially (25%), (2020) that total P uptake was dependent on the number of
whereas S-type lateral roots and root hairs would only contribute total root tips, which in turn depends on the rate of secondary
around 15% each (Table 3). Their advantage becomes obvious, branching on L-type laterals. Thus, producing higher-order
however, when P uptake is examined in relation to the cost of roots would seem advantageous due to the knock-on effect
Frontiers in Plant Science | www.frontiersin.org 11 March 2021 | Volume 12 | Article 641835Gonzalez et al. DJ123 Cost-Benefit Analysis Simulation
on increasing subsequent roots classes and root hairs. However, its root system with S-type lateral roots more than doubled root
the cost-benefit analysis indicated higher-order roots are less system length and adding root hairs further increased total length
effective per P invested, which would favor the formation of root several-fold. Despite the presence of such extensive length in
hairs and S-type lateral roots as traits for better adaptation to fine structures, P uptake attributable to these structures was only
more severe P deficiency. This would also hold true in relation to around 30% because the corresponding surface area was small.
cost per root tip as S-type roots are by far the most numerous root The significance of the fine root structures characterizing an
type. A point to be addressed in future studies is to what extent upland rice root system appear to be related to their low cost.
the process of continuous root tip growth into yet unexplored Under severe P deficiency root growth is reduced, presumably
soil is crucial (De Bauw et al., 2020), as S-type roots will reach by the growth-limiting factor P. P invested in extending a
their maximum length of around 1 cm faster compared to longer root system therefore represents a crucial cost and the rapid
L-type laterals. recovery of that cost by S-type lateral roots and root hairs
The sensitivity analysis showed that increasing the length of may enable rice to continuously expand its root system, thereby
root hairs was far more beneficial for P uptake compared to maintaining P uptake.
increasing root hair density. Employing a very different modeling
approach Zygalakis et al. (2011) reached the same conclusion.
Should root hair length therefore be a primary target trait in rice DATA AVAILABILITY STATEMENT
improvement? This depends to what extent genotypic differences
in root hair extension will be realized in soil. Nestler et al. (2016) The model program code including input data used has
reported average root hair length of 430 µm on nodal roots grown been made publicly available at https://github.com/GDanielGzz/
in low-P nutrient solution, which decreased to below 200 µm on OpenSimRootDJ123.
soil-grown roots. In situ synchrotron images of a soil-grown root
with 243 visible root hairs furthermore clarified that a maximum
length of 395 µm could be reached by hairs developing into larger AUTHOR CONTRIBUTIONS
soil pores, but that the average length of root hairs was a mere
122 µm due to the physical barrier imposed by soil particles DG did the measurements and parameterizations for the model,
(Nestler et al., 2016) and the inability of hairs to bend and grow developed the model itself, and wrote the manuscript. JP created
around obstacles. Thus, a crucial question to be resolved is to the base program used for creating the model, provided technical
what extent potential genotypic differences in root hair length support and advice, and edited the manuscript. MW advised
would be realized in the field and whether genotypic differences and overviewed the development of the model, and provided
in the ability to extend root hairs against soil resistance exist. assistance in writing and editing the manuscript. All authors
Unlike root hairs, S-type lateral roots can modify their growth contributed to the article and approved the submitted version.
direction (see Figure 2D) and can therefore elongate around
soil particles, and selection for increased S-type length would
be the second-most efficient way to increase P uptake per cost. FUNDING
To our knowledge, efforts to systematically evaluate genotypic
differences in S-type lateral root length have not been made. One JP was institutionally funded by the Helmholtz Association (POF
interesting aspect of our cost-benefit analysis regarding S-type III Program–Research Field Key Technologies–Key Technologies
lateral roots is that they become a net-source of P after only for the Bioeconomy). Financial support to DG in the form of a
1 day of existence, much earlier compared to larger root classes. CONACYT I2 T2 Scholarship is acknowledged.
What remains unknown is for how long these S-type roots remain
active and contribute to uptake of P and other resources. Their
relative advantage would diminish if their active life span was very ACKNOWLEDGMENTS
limited and further investigations clarifying this point are needed.
As for S-type length, any genotypic difference in longevity would We thank Prof. Dr. B. Usadel for kindly allowing us to run all
potentially be worth exploiting in rice breeding. simulations on his computational cluster.
CONCLUSION SUPPLEMENTARY MATERIAL
We constructed a detailed model of the root architecture and The Supplementary Material for this article can be found
morphology of upland rice, using DJ123 as a representative of online at: https://www.frontiersin.org/articles/10.3389/fpls.2021.
upland rice genotypes with adaptations to low P soils. Modeling 641835/full#supplementary-material
REFERENCES to phosphorus deficiency in combination with water stress in barley (Hordeum
vulgare)? Ann. Bot. 110, 319–328. doi: 10.1093/aob/mcs085
Brown, L. K., George, T. S., Thompson, J. A., Wright, G., Lyon, J., Dupuy, L., et al. De Bauw, P., Mai, T. H., Schnepf, A., Merckx, R., Smolders, E., and Vanderborght,
(2012). What are the implications of variation in root hair length on tolerance J. (2020). A functional-structural model of upland rice root systems reveals the
Frontiers in Plant Science | www.frontiersin.org 12 March 2021 | Volume 12 | Article 641835Gonzalez et al. DJ123 Cost-Benefit Analysis Simulation importance of laterals and growing root tips for phosphate uptake from wet and Rebouillat, J., Dievart, A., Verdeil, J. L., Escoute, J., Giese, G., Breitler, j-c, et al. dry soils. Ann. Bot. 126, 789–806. doi: 10.1093/aob/mcaa120 (2009). Molecular genetics of rice root development. Rice 2, 15–34. doi: 10.1007/ Diagne, A., Amovin-Assagba, E., Koichi, F., and Wopereis, M. C. S. (2013). s12284-008-9016-5 “Estimation of cultivated area, number of farming households and yield for Rose, T. J., Impa, S. M., Rose, M. T., Pariasca-Tanaka, J., Mori, A., Heuer, S., et al. major rice-growing environments in Africa,” in Realizing Africa’s Rice Promise, (2013). Enhancing phosphorus and zinc acquisition efficiency in rice: a critical eds M. C. S. Wopereis, D. E. Johnson, N. Ahmadi, E. Tollens, and A. Jalloh review of root traits and their potential utility in rice breeding. Ann. Bot. 112, (Boston, MA: CABI), 35–45. 331–345. doi: 10.1093/aob/mcs217 Drame, N. K., and Manneh, B. (2013). “Rice genetic improvement for abiotic stress Saito, K., Vandamme, E., Johnson, J. M., Tanaka, A., Senthilkumar, K., Dieng, tolerance in Africa,” in Realizing Africa’s Rice Promise, eds M. C. S. Wopereis, I., et al. (2019). Yield-limiting macronutrients for rice in sub-Saharan Africa. D. E. Johnson, N. Ahmadi, E. Tollens, and A. Jalloh (Boston, MA: CABI), Geoderma 338, 546–554. doi: 10.1016/j.geoderma.2018.11.036 144–160. Silberbush, M., and Barber, S. (1984). Phosphorus and potassium uptake of field- Fageria, N. K., Moreira, A., and dos Santos, A. B. (2013). Phosphorus uptake grown soybean cultivars predicted by a simulation model. Soil Sci. Soc. Am. J. and use efficiency in field crops. J. Plant Nutr. 36, 2013–2022. doi: 10.1080/ 48, 592–596. 01904167.2013.816728 Silberbush, M., and Barber, S. (1983). Sensitivity of simulated phosphorus uptake to Freschet, G. T., Roumet, C., Comas, L. H., Weemstra, M., Bengough, A. G., Rewald, parameters used by a mechanistic-mathematical model. Plant Soil 74, 93–100. B., et al. (2020). Root traits as drivers of plant and ecosystem functioning: Tsujimoto, Y., Rakotoson, T., Tanaka, A., and Saito, K. (2019). Challenges and current understanding, pitfalls and future research needs. New Phytol. doi: opportunities for improving N use efficiency for rice production in sub-Saharan 10.1111/nph.17072 Africa. Plant Prod. Sci. 22, 413–427. doi: 10.1080/1343943X.2019.1617638 Gahoonia, T. S., and Nielsen, N. E. (1998). Direct evidence on participation of Vandamme, E., Rose, T., Saito, K., Jeong, K., and Wissuwa, M. (2015). root hairs in phosphorus (32P) uptake from soil. Plant Soil 198, 147–152. Integration of P acquisition efficiency, P utilization efficiency and low grain P doi: 10.1023/A:1004346412006 concentrations into P-efficient rice genotypes for specific target environments. IRRI World Rice Statistics (2020). Rice Yields in Asia. Available online at: http: Nutr. Cycl. Agroecosyst. 104, 413–427. doi: 10.1007/s10705-015-9716-3 //ricestat.irri.org:8080/wrsv3/entrypoint.htm (accessed July 26, 2019). Wissuwa, M., and Ae, N. (2001). Genotypic variation for tolerance to phosphorus Kirk, G. L. D., Santos, E. E., and Findenegg, G. R. (1999). Phosphate solubilization deficiency in rice and the potential for its exploitation in rice improvement. by organic anion excretion from rice (Oryza sativa L.) growing in aerobic soil. Plant Breed. 120, 43–48. doi: 10.1046/j.1439-0523.2001.00561.x Plant Soil 211, 11–18. Wissuwa, M., Gonzalez, D., and Watts-Williams, S. J. (2020). The contribution Mori, A., Fukuda, T., Vejchasarn, P., Nestler, J., Pariasca-Tanaka, J., and Wissuwa, of plant traits and soil microbes to phosphorus uptake from low-phosphorus M. (2016). The role of root size versus root efficiency in phosphorus acquisition soil in upland rice varieties. Plant Soil 448, 523–537. doi: 10.1007/s11104-020- in rice. J. Exp. Bot. 67, 1179–1189. doi: 10.1093/jxb/erv557 04453-z Morita, S., and Abe, J. (1994). “Modeling root system morphology in rice,” in Wissuwa, M., Kondo, K., Fukuda, T., Mori, A., Rose, M. T., Pariasca-Tanaka, J., Biology of Adventitious Root Formation, eds T. D. Davis and B. E. Haissig et al. (2015). Unmasking novel loci for internal phosphorus utilization efficiency (Boston, MA: SSBM). doi: 10.1007/978-1-4757-9492-2_15 in rice germplasm through Genome-Wide Association Analysis. PLoS One Murphy, J., and Riley, J. P. (1962). A modified single solution method for the 10:e0124215. doi: 10.1371/journal.pone.0124215 determination of phosphate in natural waters. Anal. Chim. Acta 27, 31–36. Zygalakis, K. C., Kirk, G. J. D., Jones, D. L., Wissuwa, M., and Roose, T. (2011). A doi: 10.1016/S0003-2670(00)88444-5 dual porosity model for nutrient uptake by root hairs. New Phytol. 192, 676–688. Nestler, J., Keyes, S. D., and Wissuwa, M. (2016). Root hair formation in rice (Oryza doi: 10.1111/j.1469-8137.2011.03840.x sativa L.) differs between root types and is altered in artificial growth conditions. J. Exp. Bot. 67, 3699–3708. doi: 10.1093/jxb/erw115 Conflict of Interest: The authors declare that the research was conducted in the Nestler, J., and Wissuwa, M. (2016). Superior root hair formation confers root absence of any commercial or financial relationships that could be construed as a efficiency in some, but not all, rice genotypes upon P deficiency. Front. Plant potential conflict of interest. Sci. 7:1935. doi: 10.3389/fpls.2016.01935 Nigatu, G., Hansen, J., Childs, N., and Seeley, R. (2017). Sub-Saharan Africa is Copyright © 2021 Gonzalez, Postma and Wissuwa. This is an open-access article projected to be the leader in global rice imports. Amber Waves 9:17. doi: 10. distributed under the terms of the Creative Commons Attribution License (CC BY). 22004/AG.ECON.266026 The use, distribution or reproduction in other forums is permitted, provided the Postma, J. A., Kuppe, C., Owen, M. R., Mellor, N., Griffiths, M., Bennett, M. J., et al. original author(s) and the copyright owner(s) are credited and that the original (2017). OpenSimRoot: widening the scope and application of root architectural publication in this journal is cited, in accordance with accepted academic practice. No models. New Phytol. 215, 1274–1286. doi: 10.1111/nph.14641 use, distribution or reproduction is permitted which does not comply with these terms. Frontiers in Plant Science | www.frontiersin.org 13 March 2021 | Volume 12 | Article 641835
You can also read