Untangling the knots Clearing the way to fast green hydrogen deployment - June 2021 - Sandbag Climate ...
←
→
Page content transcription
If your browser does not render page correctly, please read the page content below
Hydrogen production:
      Untangling  the knots
            Clearing the way to fast green hydrogen deployment
June 2021

                                                                 June 2021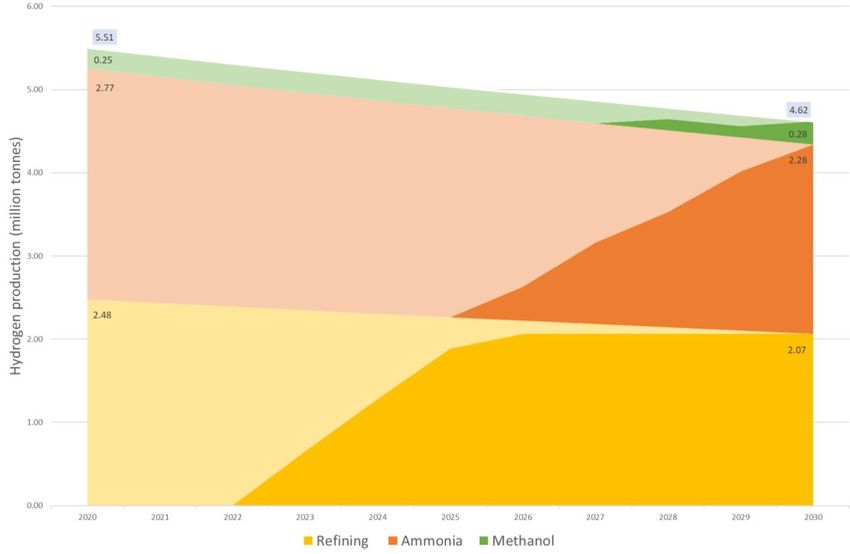
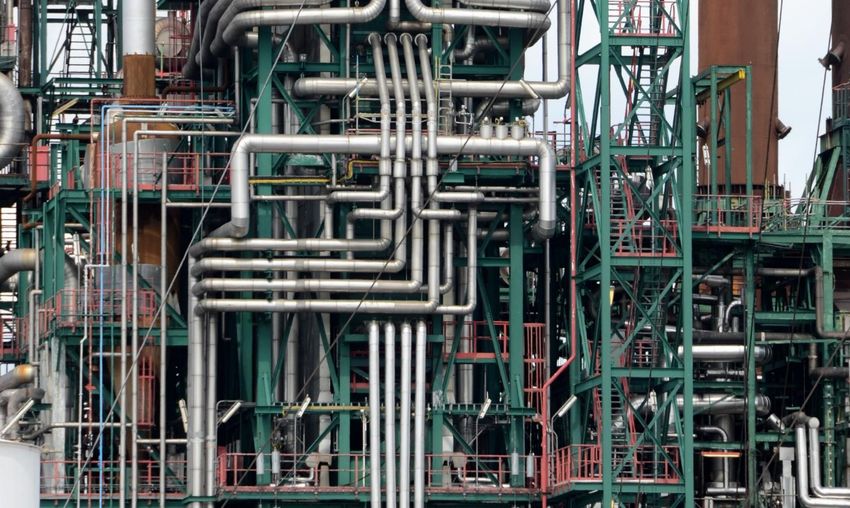
Published in June 2021 by Sandbag. This report is published under a Creative Commons licence.
You are free to share and adapt the report, but you must credit the authors and title, and you
must share any material you create under the same licence.

Principal Author
Samuel Gonzalez Holguera

Thanks
With thanks to Ciara Barry, Julie Ducasse, Adrien Assous for helpful comments and input on this
report, and to the industry experts and government representatives who were consulted for this
research.

Image credits
Paul Teysen

Report design
Julie Ducasse

Copyright © Sandbag, 2021
Contents

INTRODUCTION                              1

1. CURRENT HYDROGEN USES IN INDUSTRY      4

     1.1 Ammonia production                4

     1.2 Refining                          5

     1.3 Methanol production               5

2. THE COST OF UNABATED FOSSIL HYDROGEN   7

3. THE PRODUCTION OF RENEWABLE HYDROGEN   8

     3.1 Electrolyser technology           8

     3.2 Electricity costs                11

4. ABATEMENT COST CURVE                   15

5. RENEWABLE CAPACITY REQUIRED            20

CONCLUSION                                22

REFERENCES                                24
Tables
Table 1: Assumptions for costs of water electrolysis and steam methane reforming ..................... 11
Table 2: LCOE estimates and forecasts for new solar PV, onshore and offshore wind power
capacity ......................................................................................................................................... 13
Table 3: Cost of electricity paid by hydrogen producers in Northern and Southern Europe ........... 14
Table 4: Required renewable capacity .............................................................................................. 21
Figures
Figure 1: Expected evolution of dedicated hydrogen production for current uses in industry ......... 6
Figure 2: Projection of abatement costs for a switch to renewable hydrogen in the ammonia
and methanol sectors ................................................................................................................... 15
Figure 3: Projection of abatement costs for a switch to renewable hydrogen in the refining
sector ............................................................................................................................................ 16
Figure 4: Marginal abatement cost curve for the ammonia, refining and methanol sectors
in Phase IV .................................................................................................................................... 17Untangling the knots - clearing the way to fast green hydrogen deployment
Introduction
The transformation of global industry will not be achieved through any one technology
or energy carrier. While energy and resource efficiency measures, paired with direct
electrification with renewable energies, will be the backbone of industrial decarbonisation,
there will be a need for renewable hydrogen use in certain applications in energy-intensive
sectors. Hydrogen will likely also play a role in decarbonising aviation and long-distance
shipping, sectors which, like emissions-intensive industries, are responsible for a large and
growing share of greenhouse gas emissions.
The importance of hydrogen is widely acknowledged within the EU. The European
Commission launched its Hydrogen Strategy for a climate-neutral Europe in July 2020 (EC,
2020a), and many European states have also developed their own hydrogen strategies.
Hydrogen projects are beginning to attract public funding, through instruments like the
Important Projects of Common European Interest (IPCEI), the Recovery and Resilience Facility
and Carbon Contracts for Difference (CCfD). At the same time, industry actors are heavily
promoting hydrogen as a decarbonisation solution in many sectors, and not only those in
which there are no more efficient alternatives available. This “hydrogen hype” is
accompanied with calls for significant investments in hydrogen production technologies and
associated hydrogen infrastructure.
The hydrogen hype comes not only from potential producers of renewable hydrogen, but
largely from the oil and gas industry, for whom a future hydrogen economy offers the chance
to prolong the tenability of their business models. While renewable hydrogen is made with
renewable electricity, there is also the option to produce “low-carbon hydrogen” using
natural gas with carbon capture and storage/use (CCS/U). Both technologies are in their
infancies in terms of market deployment, and both require large infrastructure investments,
whether in renewable energy infrastructure or CO2 transport and storage. As low-carbon
hydrogen, which still produces some greenhouse gas emissions, is not ultimately compatible
with the EU’s 2050 carbon neutrality target, it is at best viewed as a transition option to aid
the development of renewable hydrogen.
This is the stance taken in the EU’s Hydrogen Strategy, which acknowledges a role for low-
carbon hydrogen in as far as it contributes to the development of a renewable hydrogen
market. The strategy aims for 10Mt of renewable hydrogen production by 2030, and many
stakeholders claim that there is not currently enough hydrogen demand to incentivise the
production of this amount of renewable hydrogen. Renewable hydrogen is seen as being too
expensive to provide adequate market take-up by 2030. The argument follows that low-
carbon hydrogen will be necessary in order to stimulate hydrogen demand, allowing
renewable hydrogen to develop to meet the 2030 target.
Sandbag | June 2021 1Untangling the knots - clearing the way to fast green hydrogen deployment
Demand for hydrogen today is far from non-existent. Hydrogen is widely used in the
ammonia, refining and methanol sectors. However, this is almost entirely hydrogen produced
from unabated fossil fuels. The European ammonia, refining and methanol sectors consume
a net amount of 5.51m tonnes of hydrogen (consumption minus own production as by-
product), the production of which emits at least 49 million tonnes of CO2 annually. This is
equivalent to the annual emissions of member states like Finland or Bulgaria, or 3% of EU ETS
emissions. Nevertheless, these sectors have the technical capability to switch to using
renewable hydrogen directly. This switch would create large demand for renewable
hydrogen, enabling the nascent market to develop and achieve economies of scale, so that
adequate and affordable hydrogen production is in place for use in other applications after
2030, such as aviation fuels, shipping and the steel sector. However, this switch is expected
to come at a high cost, and there are a wide range of predictions as to how the cost of
renewable hydrogen compares to unabated fossil hydrogen.1
However, less attention has been paid to the practical costs of switching to renewable
hydrogen in sectors already using hydrogen today. In this report, we compare the cost of
producing hydrogen using water electrolysis with that of steam methane reforming, the
conventional hydrogen production method in Europe. To conduct this research, we have
consulted the latest reports from prominent organisations in the field, which we completed
with more targeted consultations, using data from national government agencies and direct
exchanges with industry actors.
This report also seeks to improve transparency around the costs of the renewable hydrogen
switch. Transparency on industry’s decarbonisation costs is important to help policymakers
to spend taxpayers’ money where it is most needed and to provide stability to the carbon
market by sharing knowledge on abatement potential and costs. For this reason, we outline
as clearly as possible our different assumptions and the data sources used. As this research
compiled a large range of different data, it may still have flaws related to remaining gaps in
our information. If so, we invite the readers to contribute to plugging any such gaps that they
identify, by contacting us at contact@sandbag.be.
1
See for instance European Commission (2020a), BNPP (2020) and IEA (2019).
Sandbag | June 2021 2Untangling the knots - clearing the way to fast green hydrogen deployment So many colours in the hydrogen rainbow Many terms are used by industry players and policy makers to describe the different technologies available to produce hydrogen. To ensure clarity, we will stick to the terms ‘renewable hydrogen’ (hydrogen from water electrolysis powered by renewable energy) and ‘unabated fossil hydrogen’ (hydrogen from fossil fuels without carbon capture). Here are a few other names you might encounter: Green hydrogen is another name for hydrogen produced from renewable energy. The most technologically mature option is to produce hydrogen through water electrolysis powered by renewable electricity. Grey hydrogen is another name for hydrogen produced using unabated fossil fuels. Hydrogen from steam reformed natural gas accounts for the majority of hydrogen production today. Hydrogen from coal gasification makes up the majority of the rest. Blue hydrogen is produced using fossil fuels, but with the capture and storage/use of CO2 emissions. This is often also referred to as “low-carbon hydrogen”, as it has lower carbon emissions than unabated fossil hydrogen, but carbon dioxide emissions cannot be entirely eliminated. There is no reduction in the lifecycle methane emissions of low-carbon hydrogen production. Pink hydrogen is generated through electrolysis powered through nuclear energy. Hydrogen from nuclear energy is also sometimes referred to as “low-carbon” or “sustainable” hydrogen. Yellow hydrogen is made through electrolysis using solar energy. Confusingly, it is also sometimes used to describe hydrogen made through electrolysis using power of mixed origin (both renewables and fossil power), for example using power from a partially decarbonised grid. Turquoise hydrogen is produced via methane pyrolysis. In this new way to extract hydrogen from natural gas, the carbon contained in methane is not released as CO2 but becomes solid carbon which could be stored more easily. Clean hydrogen can have different meanings depending on who is using the term. Sometimes, clean hydrogen is used synonymously with renewable hydrogen. In other cases, clean hydrogen is understood to include both renewable and low-carbon hydrogen (which can mean hydrogen from abated fossil fuels or nuclear energy). Sandbag | June 2021 3
Untangling the knots - clearing the way to fast green hydrogen deployment

1. Current hydrogen uses in industry

    Globally, current hydrogen use is dominated by three applications in industry: oil refining
(33% of total global demand), ammonia manufacture (27%) and methanol production (11%)
(IEA, 2019). Within the EU-27, hydrogen demand from these three sectors in 2020 amounted
to about 6.9 Mt.2

By far the most common production method for hydrogen production in Europe is Steam
Methane Reforming (SMR), and less commonly partial oxidation (POX) or autothermal
reforming (ATR). For simplicity, in this analysis we focus on SMR, which emits 8.9 tCO2 per
tonne of hydrogen produced. As some refining activities produce hydrogen as a by-product,
which is used to meet part of the sector’s hydrogen demand (see section 1.3), we estimate
that today about 5.5 Mt of hydrogen production could be replaced by electrolytic hydrogen.
This would avoid 49 MtCO2 emissions per year.

1.1 Ammonia production
Ammonia is the second most produced chemical in the world, and it is mostly used for
nitrogen fertiliser manufacturing. It is produced by the Haber Bosch process which combines
nitrogen (N2) captured from air with hydrogen to produce ammonia, NH3.

In 2019, 15.6 Mt of ammonia was produced in the EU-27 (IFA, 2020).3 90% of this ammonia is
used for producing nitrogen fertilisers (Material Economics, 2019). The growth in demand for
ammonia will therefore hinge on how the use of fertilisers in food production evolves in
future years. In its Farm to Fork Strategy (2020b), the European Commission set the target to
reduce the use of fertilisers by at least 20% by 2030. Our baseline scenario therefore assumes
a 20% fall in ammonia-based fertilisers over the next decade. We also assume that demand
for the remaining 10% ammonia production, going to other industrial applications, remains
constant. This sums up to 18% fall in ammonia production by 2030.

Since producing one tonne of ammonia requires 178 kg of hydrogen (Dechema, 2017), the
production of ammonia required 2.77 Mt of hydrogen in 2019. We expect this to fall to 2.28
Mt in 2030.

2
  This is an estimated figure for the EU-27. The figure for the EU-28 would be 7.4 Mt, so broadly consistent
with Agora-Afry’s (2021) 7.7 Mt estimate.
3
  The International Fertilizer Association provides a figure for the EU-28: 16.4 Mt of ammonia. See IFA (2020).
This is discounted by the share of production capacity located in the United Kingdom (5.23%). See CEPS (2014).

Sandbag | June 2021                                                                                         4
Untangling the knots - clearing the way to fast green hydrogen deployment 1.2 Refining Hydrogen is used in refineries for two purposes: hydrotreating, the process of removing impurities like sulphur from the final products, and hydrocracking, whereby heavy feedstocks are converted (cracked) into lighter distillates (naphtha, kerosene, diesel). Hydrogen production is typically responsible for around 15% of total emissions from refineries (JRC, 2018). Under the Renewable Energy Directive (RED II), Member States must require fuel suppliers to supply a minimum of 14% of the energy consumed in road and rail transport by 2030 as renewable energy. The use of electrolytic hydrogen in refineries is seen by fuel producers as one of the easiest ways to meet that target. For the refining sector, given the very diverse range of products, we used data on current and projected hydrogen consumption from Agora-Afry's 2021 study. Hydrogen demand from refineries in the EU-27 was 3.90 Mt in 2020 and is expected to fall to 3.25 Mt by 2030.4 This fall is mainly the consequence of a gradual electrification of transport, which is expected to accelerate after 2030. Only a share of this hydrogen volume, however, is a candidate to substitution with renewable hydrogen, as some of the hydrogen demand from refineries is met with by-products from refining operations. The IEA (2019) classifies the sources of hydrogen supply in European refineries as ‘refinery by-product’ (35%), ‘on-site SMR’ (51%) and ‘merchant supply’ (14%). The vast majority (90%) of the merchant supply is itself also produced by SMR (the remaining 10% is by-production from chlor-alkali and coke oven gas) (FCHO, 2020). All in all, 63.6% of the hydrogen currently used in refineries in Europe could therefore be replaced by renewable hydrogen. This amounts to 2.48 Mt of hydrogen in 2020, which will fall to 2.07 Mt by 2030. 1.3 Methanol production Methanol (CH3OH) is one of the most widely produced chemicals globally. It serves as an important base chemical to produce thousands of everyday products, including plastics, paints, cosmetics and fuels. Its production also relies on natural gas reforming. The alternative low-carbon pathway to produce methanol relies on switching to renewable hydrogen, which must then be combined with CO2 as the source of carbon (Dechema, 2017). In 2015, the production of methanol in the EU-27 amounted to about 1.27 Mt (Dechema, 2017).5 Following Dechema, we assume a 1% annual growth in demand for traditional uses. With each tonne of methanol produced requiring 189 kg of hydrogen, a hydrogen production of 0.25 Mt will be required in 2020, rising to 0.28 Mt in 2030. 4 Subtracting from the overall demand for Europe the demand from the UK and Norway (see the online data workbook accompanying their paper). 5 We discount from the EU-28 value a share equal to the weight of the UK economy in the EU in 2019. Sandbag | June 2021 5
Untangling the knots - clearing the way to fast green hydrogen deployment

Figure 1 shows the expected evolution of dedicated hydrogen production in these three
sectors. Driven by the electrification of transport and the fall in fertiliser use, we expect this
production to fall from 5.51 Mt to 4.62 Mt over the decade. The pale areas show the
production of fossil-based hydrogen in each sector, and the darker area its progressive
substitution by renewable hydrogen. This substitution first occurs in refining, the sector
where the abatement cost is lowest (see section 4).

The decarbonisation of hydrogen production will happen gradually. Although some projects
are already under way, we assume that the first investment is made in 2021, with a 2-year
lag until commercial operation. A linear production ramp-up occurs until 2030, with the last
investments made in 2028. Such ramp-up would avoid 193 MtCO2 emissions out of 445
MtCO2 that would otherwise be emitted by the hydrogen needs of these sectors over 2021-
2030.

Figure 1: Expected evolution of dedicated hydrogen production for current uses in industry

Source: Sandbag based on data described above. The pale areas show the production of fossil-based hydrogen in each sector,
and the darker area its progressive substitution by renewable hydrogen.

Sandbag | June 2021                                                                                                    6
Untangling the knots - clearing the way to fast green hydrogen deployment

2. The cost of unabated fossil hydrogen

    Investigating the cost incurred by refineries or ammonia producers who operate a switch
to renewable hydrogen implies a comparison with current production costs.

As we are examining the additional costs incurred by current hydrogen users, the sunk capital
costs of an SMR plant is not included in the comparison as they have already been paid.
However, we include a fixed annual operating cost for the maintenance and replacement of
parts of the SMR plant, as this payment is no longer necessary once the switch to electrolysis
is carried out. Following IEA (2019), this is set at an annual fixed opex of 4.7% of the €304/tH2
capex needed for SMR.

The main operating cost for the production of hydrogen by SMR is for natural gas
consumption. Producing one tonne of hydrogen requires about 45.14 MWh of natural gas:
this value is the average of two consumption rates found in the literature (IEA, 2017 and
Argonne National Laboratory, 2019). Since we assumed projects commissioned today would
be operational in two years, our first year of interest for gas prices is 2023. Based on current
market prices (TTF Calendar Y+2 futures), we assume a natural gas price of €17.2/MWh in
2023, constant until 2030. This assumption is more conservative than that made by the
European Commission in its Hydrogen Strategy (2020), which is €22 per MWh (lower natural
gas prices will make SMR more competitive).

Powering the reforming process also requires electricity, but the electricity needs of an SMR
plant are covered by a steam turbine driven by the superheated steam created during the
production of hydrogen (IEA, 2017). We therefore set the electricity consumption for SMR at
0.

Carbon costs are not included in this calculation, the aim of this analysis being to determine
the carbon price at which the switch to renewable hydrogen becomes profitable. For
simplification, we apply the same discount rate for SMR as for green hydrogen production
even though it should be much lower. A discount rate captures the risks associated with an
operation, and such risks are very low for SMR plants already in operation. Decisions to
produce can be taken on the spot with no initial commitment, or passing gas supply costs
through to finished output prices e.g. under a tolling agreement, bearing no risk on the input
price.

Sandbag | June 2021                                                                           7
Untangling the knots - clearing the way to fast green hydrogen deployment 3. The production of renewable hydrogen 3.1 Electrolyser technology 3.1.1 Alkaline vs PEM Two main electrolysis technologies are commercially available, alkaline and Proton Membrane Exchange (PEM) electrolysers. Alkaline water electrolysis is a mature technology, which has been in use since the 1920s. Driven by the expansion of fertiliser use during the twentieth century, alkaline electrolysis was widely used until the 1970s, when steam methane reforming became a cheaper hydrogen production method. Introduced in the 1960s, PEM electrolysers are a less mature and therefore more expensive technology. Unlike their alkaline counterparts, they also rely on expensive platinum catalysts (Schmidt et al., 2017). PEM electrolysers benefit from a faster dynamic response (the time the electrolyser takes to ramp up or down its production of hydrogen), and it is therefore often argued that PEM electrolysers are more suited for use with variable renewables. BNEF’s analysis (2019), however, shows that “the response time of alkaline electrolysers is short enough in almost all applications, and is able to be powered by variable renewables”. Given the cost advantage alkaline electrolysers currently enjoy and the fact that this will “likely continue to be the case over the coming decade” (BNEF, 2019), we assume in this study that the decarbonisation of hydrogen production in Europe will use alkaline technology. 3.1.2 Cost of alkaline electrolysers Electrolyser costs are expected to fall rapidly in the coming decade as production scales up. In its Hydrogen Strategy, the European Commission notes electrolyser costs have already been reduced by 60% in the last decade and expects they will halve again by 2030 compared to today with further economies of scale. Scale can deliver cost reductions through several mechanisms. At today’s production volumes, many of the electrolyser manufacturing steps are still done manually as higher automation rates are not yet profitable. Greater production volumes also allow manufacturers to purchase larger quantities of raw material, at a cheaper unit cost. Finally, the scale of the typical electrolyser itself is also growing, from 2-3 MW in 2018 towards tens or even hundreds of MW today. This allows for cheaper modular design and to spread Balance of Plants (BOP) costs (for gas separation and purification, power control etc.) over more units of output, thus lowering unit capex (BNEF, 2019). In its Hydrogen Strategy, the European Commission forecasts, without specifying the technology, that costs will decline to “€450/kW or less in the period after 2030, and €180/kW after 2040”. However, this assumption is clearly overstated given that, according to BNEF, Chinese-made alkaline electrolysers already retail around €180/kW. Sandbag has seen Sandbag | June 2021 8
Untangling the knots - clearing the way to fast green hydrogen deployment

industry examples around €650/kW in projects where the PEM/alkaline choice had not yet
been made, and experts we consulted believe that large-scale alkaline electrolysers are
available for €500/kW in Europe now, so this is our starting assumption. We expect this to go
down to €103/kW in 2030 (as per BNEF’s forecast). Note that we assume a lag of two years
between the electrolyser purchasing agreement and the first year of operation. An
electrolyser first active in 2023 will therefore have been paid at the prices prevailing in 2021.

3.1.3 Other costs
Beyond the cost of the electrolyser itself, the costs of equipment for the compression and
storage of hydrogen must also be included. In line with industry examples, we assume a
compression cost of €0.07/W of electrolyser capacity for storage in hydrogen tanks, and a
cost of €700 per kg of hydrogen stored. In our calculations, we assume that electrolysers have
a storage capacity of 12 hours at full load, which would allow a hydrogen-using plant to
function beyond the number hours (assumed here at 5000 hours, see 3.2.1) when renewable
energy is available. Conversations with experts showed it usually makes most sense for
industrial consumers to produce hydrogen at the point of consumption as it is easy to
produce, rather than having to incur the cost of transporting it over long distances. We
therefore assume that hydrogen is produced near the point of consumption, for example in
an industrial hydrogen cluster, and do not include additional transport costs.

Following BNEF, we assume a 10-year lifetime for the stack,6 after which it must be replaced.
This is included as a fixed annual Opex set at 2% of the electrolyser capex. We also add for
the operation and maintenance of the compression and storage equipment a fixed annual
Opex of 1.5% of the associated capital cost.

The main operating cost for the production of green hydrogen comes from the electricity
required to power the electrolyser. We follow the IEA (2019) and assume water electrolysis
had an efficiency (the rate at which the electrolyser converts electrical energy into hydrogen)
in 2019 of about 64%: this means that producing 10 MWh (300 kg) of hydrogen requires 16
MWh of electricity.7 This efficiency is expected to increase to 69% in 2030 (IEA, 2019). This
translates into an electricity consumption of 52.0 kWh/kgH2 in 2019 that decreases to 48.2
kWh/kgH2 in 2030.8 We assume this electricity is paid at the Levelised Cost of Electricity
(LCOE) from renewables plus connection costs, as explained in the next section. An increased
efficiency will reduce the production costs of electrolytic hydrogen both by reducing
electricity consumption and by reducing the electrolyser capacity required to produce a given
volume of hydrogen.

6
  The ‘cells’ in which hydrogen is produced are assembled in a series of cell ‘stacks’.
7
  Efficiency is expressed here at the Lower Heating Value (LHV) of hydrogen. It can also be expressed as an
efficiency of 76% at the Higher Heating Value (HHV) of hydrogen. The energy content of 1 kg of hydrogen is
39.4 kWh at the HHV, when it is used as industrial feedstock, and 33.3 kWh at the LHV, when hydrogen is used
as fuel and some of the gross potential energy value is lost in the combustion process. The efficiency of an
electrolyser can therefore be expressed using either the LHV or the HHV of hydrogen.
8
  This is close to BNEF (2019), which expect a reduction from 53 kWh/kgH2 in 2019 to 48 kWh/kgH2 in 2030.

Sandbag | June 2021                                                                                       9
Untangling the knots - clearing the way to fast green hydrogen deployment

While the efficiency of new electrolysers will improve, electrolysers in use will gradually
decrease in efficiency due to degradation, until the stack is replaced. To take this into account,
we assume an average efficiency over the decade of operation before stack replacement that
is 3 percentage points under the initial efficiency.

One more cost element is the (non-renewable) electricity needed to power an electrolyser
while it is not producing hydrogen, in order to allow a hot startup when renewable electricity
becomes available again. Although the power needed for such “hot standby” mode varies
between equipments, alkaline electrolysers generally need the electrodes to be supplied with
only 0.2-0.3 % of maximal capacity, whereas PEM electrolysers typically need about 1%,
according to experts consulted by Sandbag. Based on the assumption of alkaline electrolysers,
we added to the costs grid power at €60/MWh for 0.3% of electrolysers’ nominal capacity
over the assumed unavailability periods of renewable energy.

Exchanges with industry have shown that the cost of water supply to feed the electrolyser
was low enough to be ignored here. We assume a plant lifetime of 25 years and a discount
rate of 6%, reflecting the perceived risk level of these assets.

Finally, in the case of the refining sector only, we add an additional element to the cost
analysis. This is because RED II-compliant fuels should be able to capture a market premium,
as they will help consumers to meet their obligation to use 14% “renewable fuel”. The green
hydrogen that allowed the fuel supplier to comply with the directive can therefore be
assigned a premium value, which we set at €2.5/kgH2 until 2030 based on our exchanges with
industry stakeholders.

Table 1 summarises these assumptions.

Sandbag | June 2021                                                                           10
Untangling the knots - clearing the way to fast green hydrogen deployment

Table 1: Assumptions for costs of water electrolysis and steam methane reforming

                                              2021                             2030
 Water electrolysis
 Electrolyser cost                          500 €/kW                         103 €/kW
 Electrolyser efficiency,
                                              61.9%                           66.00%
 including stack degradation
                                       57% (5000 hours             57% (5000 hours
 Electrolyser utilisation rate
                                          per annum)                  per annum)
 Compression cost                    0.07 €/W of capacity        0.07 €/W of capacity
 Storage cost                     700 €/kg of hydrogen stored 700 €/kg of hydrogen stored
 Storage duration                          12 hours                    12 hours
 Fixed annual Opex
                                          2% of Capex                      2% of Capex
 (electrolyser)
 Fixed annual Opex
                                         1.5% of Capex                    1.5% of Capex
 (compression and storage)
 Green hydrogen premium in
                                           2.5 €/kgH2                       2.5 €/kgH2
 the refining sector
 Plant lifetime                             25 years                         25 years
 Discount rate                                6%                               6%
 Steam methane reforming
 Fixed annual Opex                       4.7% of Capex                    4.7% of Capex
 (maintenance)                        (Capex = 304 €/tH2)              (Capex = 304 €/tH2)
 Natural gas consumption                45.14 MWh/tH2                    45.14 MWh/tH2
 Cost natural gas                         17.2 €/MWh                       17.2 €/MWh
 Discount rate                                 6%                               6%

3.2 Electricity costs

3.2.1 On-site electricity production
Electricity costs for hydrogen production are often assumed to follow market dynamics, which
is not necessarily the case. It is true if one assumes an electrolyser which is fed by grid
electricity, which has the significant advantage of allowing a near continuous operation. This
translates into relatively lower investment costs, as the capex is amortised more quickly. But
grid electricity is expensive. Electricity prices from the grid are set by the marginal cost of the
electricity plant used to meet the last megawatt of demand. This role is played in Europe by
gas power plants, whose costs are set to increase with the carbon price. A connection to the
grid also comes with grid fees and taxes levied on large industrial consumers. Between energy
supply costs, network costs and other taxes, large industrial consumers in several European
countries pay electricity prices above 100 EUR/MWh (IRENA, 2021a).

Sandbag | June 2021                                                                            11
Untangling the knots - clearing the way to fast green hydrogen deployment The high cost of grid electricity for the comfort of running electrolysers for 90% of the year should be compared with the much lower cost of using intermittent renewable electricity. Furthermore, from an energy system perspective, an overreliance of hydrogen production on grid electricity would increase overall demand on the grid and could delay the overall decarbonisation of the electricity mix. Electrolysis from direct renewable resources better assures the additionality of renewable hydrogen production. In this analysis, we therefore investigate abatement costs for hydrogen users based on the assumption that the electricity is directly purchased from renewables suppliers at the levelised cost of electricity from renewables (with a 20% extra cost to account for connection costs, see below). Direct agreements between hydrogen users and renewable suppliers are indeed increasingly common, and we expect this pattern to grow. The direct cost of choosing a direct renewable energy source is that high electrolyser utilisation rates cannot be achieved. We make the assumption of the electrolyser running on a combination of solar and wind can run 5000 hours per year (a 57% load factor). This is an assumption commonly found both in industry projects and publications on the economics of hydrogen. Such load factor typically reflects the situation of an electrolyser powered by a combination of onshore wind and solar energy. It therefore requires that each hydrogen plant is not connected to only one but two renewable energy sources. Such pooling of renewable resources would add connection costs, which we assume to be 20% of LCOEs. Agreements between hydrogen consumers and renewables suppliers are becoming increasingly common Fertiberia, a Spanish fertiliser company, announced in 2020 a partnership with utility company Iberdrola to power a 20 MW electrolyser with a dedicated 100 MW solar PV plant. The two companies announced a €1.8 billion partnership to install a total of 800 MW of electrolyser capacity at Fertiberia plants by 2027 (Iberdrola, 2020). Similarly, BP is working together with Ørsted to build an initial 50 MW electrolyser to produce renewable hydrogen at their Lingen refinery in Germany, which will be powered by an offshore wind farm in the North Sea. This project could be operational by 2024 (BP, 2020). Sandbag | June 2021 12
Untangling the knots - clearing the way to fast green hydrogen deployment

3.2.2 Levelised cost of new renewable electricity
Table 2 presents estimates of LCOEs from solar PV, onshore and offshore wind in 2020,
together with forecasts for 2030.

Table 2: LCOE estimates and forecasts for new solar PV, onshore and offshore wind power
capacity

        Renewable energy source                    2020 (EUR/MWh)                 2030 (EUR/MWh)
    Solar Photovoltaics: Northern Europe                      38                        24
    Solar Photovoltaics: Southern Europe                      25                        16
    Onshore wind                                              40                        26
    Offshore wind (fixed-bottom)                             499                        35
    Average (Northern Europe)                                 45                        32
    Average (Southern Europe)                                 35                        23

For solar PV, we used the estimates cited in the European Commission’s “Clean Energy
Transition – Technologies and Innovations” (CETTIR) report (2020c), which are taken from
Vartiainen et al. (2019). These authors provide cost estimates and forecasts for five European
locations. We selected two middle-ground locations to represent Northern and Southern
Europe (London and Rome, respectively). In those two locations, Vartiainen et al. (2019)
indicate LCOEs of €38/MWh and €25MWh in 2020, and expect them to fall to €24/MWh and
€16/MWh in 2030, respectively.10 The figures for Southern Europe seem fairly conservative,
if one considers that the latest Portuguese auction (September 2020) awarded 670MW
capacity for €11.14 per MWh and the latest Spanish auction (January 2021) awarded 2GW for
an average €24.4. Once adjusted by present value, those feed-in prices correspond to LCOEs
of €9.9/MWh and €21.7/MWh, respectively.11

For onshore wind, we used WindEurope's forecast cited in the same CETTIR report, of a fall
from €40/MWh in 2019 to €26/MWh in 2030.

For offshore wind, we considered recent auction bids in the EU as good indicators of the
current LCOE from bottom-fixed offshore wind. In 2019, the French government announced
a winning bid of €44/MWh for a 600 MW wind farm off the coast of Dunkirk (WindEurope,
2019). Also in 2019, contracts were awarded in the UK for offshore wind farms in the North
Sea at a similar price of £39.65/MWh12, with first power generation expected in 2023. Once
converted into LCOE, this fixed price is equivalent to a cost of €38.1/MWh.

9
  Implied cost in 2020 for a cost of €44/MWh in 2023 that falls to €35/MWh in 2030.
10
   At a WACC of 7%.
11
   Assuming a conservative 4% discount rate and start of operation in 2023.
12
   €44.6/MWh using the 2020 average exchange rate.

Sandbag | June 2021                                                                              13
Untangling the knots - clearing the way to fast green hydrogen deployment
We took a more conservative assumption that power from new offshore wind capacity will
be available in 2023 at an average cost of €44/MWh, and that the cost will reach €35/MWh
in 2030.
We did not include hydropower, as green hydrogen production is expected to be powered
principally by new capacity, which will probably mostly come from solar and wind.
Taking into account new development trends, we assume, like BNPP (2020), that 47% of the
energy required to power water electrolysis in Europe will be provided by offshore wind, 18%
by onshore wind and 35% by solar PV. To reflect the disparity of costs between sources of
renewable energy and renewable potential across the continent, we created two
geographical zones, “Northern Europe” and “Southern Europe”.13 Greater shares are assigned
to solar PV in the South than in the North (50% vs. 20%) and greater shares of offshore wind
in the North than in the South (67% vs. 27%).14 We then deduced a ‘renewable LCOE’ for both
regions, in 2020 and 2030 as the average of LCOEs from solar PV, onshore and offshore wind,
weighted by the assumed respective share of each renewable source in each region.
This all leads to the forecast that, on average, the LCOE of renewable electricity will fall from
€45/MWh in 2020 to €32/MWh in 2030 in Northern Europe, and from €35/MWh in 2020 to
€23/MWh in 2030 in Southern Europe.
We added 20% to account for connection costs needed to connect renewable capacity
sources together. The electricity costs paid by the renewable hydrogen producer becomes
then:
Table 3: Cost of electricity paid by hydrogen producers in Northern and Southern Europe
2020 (EUR/MWh) 2030 (EUR/MWh)
Northern Europe 54 38
Southern Europe 42 28
13
Our “Northern Europe” group includes Belgium, Czech Republic, Denmark, Estonia, Finland, Germany,
Ireland, Latvia, Lithuania, Luxembourg, the Netherlands, Poland, Slovakia and Sweden. The “Southern Europe”
group includes Austria, Bulgaria, Croatia, Cyprus, France, Greece, Hungary, Italy, Malta, Portugal, Romania,
Slovenia and Spain.
14
The exact proportions are 20% solar PV, 67% offshore, 13% onshore in Northern Europe, and 50% solar PV,
27% offshore, 13% in Southern Europe.
Sandbag | June 2021 14Untangling the knots - clearing the way to fast green hydrogen deployment
4. Abatement costs
Based on these assumptions, we calculated abatement costs for a switch to green
hydrogen in the ammonia, methanol and refining sectors, in both Northern and Southern
Europe. This switch is profitable in a given year without additional subsidies if the abatement
cost is lower than the carbon market price (€52/tCO2 on 10 May 2021). We focused our
attention on phase IV of the EU ETS (2021-2030). We assumed projects commissioned in 2021
would start avoiding emissions in 2023. The last investment is therefore made in 2028
delivering abatement in 2030.
Figure 2: Projection of abatement costs for a switch to renewable hydrogen in the ammonia
and methanol sectors
Source: Sandbag. The years indicates investment decisions. The first abatement occurs two years later.
Sandbag | June 2021 15Untangling the knots - clearing the way to fast green hydrogen deployment
Figure 2 shows abatement cost forecasts in the ammonia and methanol sectors (the assumed
costs are identical in these two sectors) in Southern and Northern Europe, broken down
between Capex and Opex. It suggests that abatement costs will fall below current market CO2
prices in the late 2020s.
In the refining sector, the need to comply with the Renewable Energy Directive should create
a premium for green hydrogen. This is because using green hydrogen for refining is believed
by the industry to be the cheapest option for the sector to comply with the 14% green fuel
objective by 2030, as our exchanges with stakeholders revealed. Assuming a premium of
€2.5/kgH2 (as per industry sources), Figure 3 shows abatement available already below
current market CO2 prices in 2021-22.
Figure 3: Projection of abatement costs for a switch to renewable hydrogen in the refining
sector
Source: Sandbag. The years indicates investment decisions. The first abatement occurs two years later.
Sandbag | June 2021 16Untangling the knots - clearing the way to fast green hydrogen deployment
The above findings are aggregated in a Marginal Abatement Cost curve for all three sectors.
How to read a MAC curve?
A Marginal Abatement Cost (MAC) curve is an intuitive way to present both the cost and
the decarbonisation potential of different abatement measures or technologies. Each
technology is ranked by merit order, according to its abatement cost, or the cost associated
with the last tonne of CO2 avoided (on the vertical axis). The horizontal axis represents the
abatement potential: a technology with a larger base has a larger abatement potential. The
abatement potential is calculated by comparing the emission intensity of the new
production process with that of the currently predominant technology (in this case, the
emission intensity of water electrolysis with that of SMR).
MAC curves are often used to compare a variety of abatement options in different sectors
(e.g. recycling of steel, electrification of transport, housing renovations). In this case, we
are analysing a single abatement option, hydrogen production by water electrolysis instead
of SMR, which is deployed in three sectors and in different years. The year indicates the
year of investment, with the first abatement occurring two years later.
Figure 4: Marginal abatement cost curve for the ammonia, refining and methanol sectors in
Phase IV (this curve can be seen and updated online here)
Note : The years indicate investment decision, the first emission reductions being delivered two years later.
Sandbag | June 2021 17Untangling the knots - clearing the way to fast green hydrogen deployment The above MAC curve shows that about 75m tonnes of CO2 emissions can be avoided at costs below the prevailing market CO2 price (about €55 at the time of writing), while the rest of the 193 Mt abatement potential is “out of reach” of the current carbon price. These residual costs beyond the market price can be reduced for industry through subsidies, so that abatement is done even if/where it is more expensive. We have developed an online functionality to simulate the effect of a subsidy, designed like a Carbon Contract for Difference, on industry’s cost and potential for abatement. The figure below shows that, with only €1bn subsidies, all abatement costs fall to less than the current carbon price, letting the market achieve the bulk of the switch. Figure 5: Impact of a €1.00bn subsidy on the MAC curve (also parametrable here) The curse of free allocation So a large part of the switching from grey to renewable hydrogen in industry could happen at costs below the current market price, and the rest for a modest subsidy of €1bn. Does this make green hydrogen competitive compared to grey hydrogen? Unfortunately not, because of free allocation under the EU ETS. Under the current regime, SMR hydrogen producers receive free carbon allowances for each unit of hydrogen they produce, so the carbon price creates no incentive for a switch to green hydrogen. While grey hydrogen producers receive this subsidy automatically, green hydrogen producers are constrained to seek subsidies by knocking on a multitude of doors, submitting application files to lengthy, bureaucratic beauty contests. These include the Horizon 2020 programme, several rounds of review panels for the Innovation Fund, having to provide evidence of Important Project of Common European Interest (IPCEI) to deserve the right for exceptional state aid, etc. Sandbag | June 2021 18
Untangling the knots - clearing the way to fast green hydrogen deployment

Ultimately, the projects ending up to successfully pass all these stages receive subsidies which
barely balance out the competitive distortion created by free allocation. This money, which
is spent twice by the European Union and its citizens, is therefore as useful as if it weren’t
spent at all.

Under the current free allocation regime, grey hydrogen manufacturing is set to receive 6.840
CO2 allowances per tonne of hydrogen produced in 2021-25, and 6.018 allowances per tonne
produced in 2026-30. To meet the demand projected over this decade (as illustrated in figure
1), at a unit price of €55, this should represent €18bn in free allowances distributed to steam
methane reformers over 2021-30, most of which could easily be replaced by electrolysers.

Sandbag | June 2021                                                                          19
Untangling the knots - clearing the way to fast green hydrogen deployment

5. Renewable capacity required

    Producing the volumes of green hydrogen required by the ammonia, refining and
methanol sectors will demand substantial investments in additional renewable capacity to
power the electrolysers. Together, these three sectors within EU-27 would require an annual
production of 4.62 Mt of electrolytic hydrogen by 2030. The total hydrogen demand from
these sectors is currently about 6.9 Mt, but the demand from refineries and ammonia plants
is expected to fall, and demand for refining purposes is partly met through the use of on-site
by-product hydrogen. Assuming the electrolysers run 5000 hours a year and an efficiency of
63%,15 producing these volumes will require the installation of 49 GW of electrolysers: 24
GW for ammonia production, 22 GW for refining and 3 GW for methanol production.

Following BNPP (2020), we assume 47% of the energy required to power these electrolysers
will be provided by offshore wind, 18% by onshore wind and 35% by solar PV. We assume
these dedicated new solar, onshore- and offshore-wind capacity run at 20%, 32%16 and 46%17
respectively. This means 92 GW of dedicated renewables (28 GW, 15 GW and 49 GW for
offshore, onshore and solar PV respectively) will be required to service the 49 GW of
electrolyser capacity.

By comparison, the EU-27’s renewables capacity (from all renewable sources) was 503 GW at
the end of 2020 (IRENA, 2021b). The 92 GW objective over 10 years (9.2 GW per year)
compares with 28 GW new capacity installed in 2019 and 30 GW in 2020 (IRENA, 2021b).

By 2030, the policy scenarios explored in the European Commission’s Impact Assessment to
achieve the -55% target envisage a combined wind and solar capacity of 796-809 GW
(European Commission, 2020b, p. 58-59), against 313 GW currently installed in 2020 (IRENA,
2021b). This implies an installation of about 489 GW of solar and wind capacity during this
decade. An additional 92 GW to power renewable hydrogen production in these three sectors
would therefore represent an important increase to this objective, of about 19%.

15
   At the LHV. This is the average expected efficiency between 2023 and 2030, when gradual stack degradation
is accounted for.
16
   Irena (2018) forecast for onshore wind capacity factor in 2025 in Europe.
17
   Capacity factor for offshore in Europe was 42% in 2020 (WindEurope, 2020). We assume a four-point
increase this decade.

Sandbag | June 2021                                                                                     20
Untangling the knots - clearing the way to fast green hydrogen deployment
Table 4: Required renewable capacity
Offshore Onshore Total
Electrolyser Solar
wind wind renewables
Capacity (GW) 48.5 28.4 15.3 48.6 92.3
Load factor (hours) 5,000 4,030 2,803 1752 n/a
Gross throughput (TWh) 242 114 43 85 242
Net Output (TWh) 154 73 27 54 154
Net Green Hydrogen (Mt) 4.6 2.2 0.8 1.6 4.6
Note: Adapted from BNPP (2020). To be able to power the required renewable capacity, the total gross throughput from
renewables must be equal to that of the electrolyser, 242 TWh. The split between renewable sources follows BNPP (2020).
47% of the total required power is produced by offshore wind, 18% by onshore wind, and 35% by solar PV. By backward
induction, assuming the solar and wind load factors cited above, we derive the capacity by renewable source.
Assuming costs of €2bn/GW for offshore wind, €1.2bn/GW for onshore wind and €800m/GW
for solar (BNPP, 2020), this amounts to an investment of €114 bn in new, dedicated
renewables to support the decarbonisation of these three sectors. This represents a
significant investment, but with falling costs and predictable returns, solar and wind projects
are now attractive investments which often do not require public subsidies (ICIS, 2019).
To put these figures into context, in its Hydrogen Strategy (EC 2020a), the European
Commission states that powering the targeted 40 GW of electrolyser capacity in Europe by
2030 will require 80-120 GW of solar and wind energy production capacity, and an investment
of 220-340 bn Euros for this capacity alone. Our estimated required investment for 49 GW of
electrolyser capacity is vastly inferior (less than half) to that forecasted by the European
Commission, which seems to be assuming exaggerated capital costs for renewables.
Sandbag | June 2021 21Untangling the knots - clearing the way to fast green hydrogen deployment
Conclusion
Our analysis shows that a switch from unabated fossil hydrogen to renewable
hydrogen is nearly viable economically. The financial costs of such a switch are very close to
the current CO2 market price in the methanol and fertiliser sectors, and are already below
the CO2 price in the refining sector, thanks to a market premium expected from selling RED
II compatible transport fuel. Indeed, the switch may already be profitable in all sectors in
certain locations, as the values shown in this report are average values which do not reflect
all differences between countries. Furthermore, the cost of the hydrogen switch is expected
to fall dramatically during this decade, calling into question the necessity of “low-carbon
hydrogen” (fossil-based using CCS) as a transition fuel.
This analysis illustrates that, in some Member States and certain sectors, the switch to
renewable hydrogen could already be incentivised by the current CO2 price, without any need
for non-market interventions or public funding. This result should be read keeping in mind
the assumptions made. In particular:
➢ Our renewables LCOE estimates are average values taken across Europe (or in the case
of solar PV, two large regions which we called ‘North’ and ‘South’). Around these
average values, there are some differences, some areas having lower costs (as shown
by the latest Portuguese auction, but also abundant cheap hydro power in
Scandinavia) and others having higher costs.
➢ We assumed that hydrogen producers will have access to a combination of wind and
solar electricity at the LCOE (plus a connection cost) calculated at the date of
investment and industrial consumers signing PPAs with renewables producers, which
is not always possible. However, the use of PPAs makes more sense for hydrogen
production than the reliance on the broader power market, which neither renewable
producers (who cannot commit to selling baseload or peak power) nor consumers
(who can perfectly do without expensive baseload or peak power) need. The PPA
trend is developing, and public policy could help develop a thriving renewables PPA
market to make it more efficient and speed up the convergence of prices and costs.
➢ We have assumed that RED II will create a market premium of €2.5 on renewable
hydrogen for the refining sector, as per industry sources. This premium, which will
make fuel distributors willing to pay more in order to comply with RED II, is a vibrant
example of regulation enabling precious savings in subsidies.
➢ We have assumed a natural gas price of €17.2/MWh based on current market prices
(for delivery in 2023). This is significantly lower than assumptions found elsewhere
(e.g. €22/MWh in the European Commission’s Hydrogen Strategy). Should gas prices
rise, the switch to renewable hydrogen will become more profitable, sooner. Even for
industrials who can see no obvious gain to switch today, by investing in renewable
hydrogen early, they could hedge the risk of grey hydrogen becoming more expensive
Sandbag | June 2021 22Untangling the knots - clearing the way to fast green hydrogen deployment
due to higher gas prices (and carbon prices) in the future. Although, in a market of
declining costs some could be tempted to just wait and see, those investing in a switch
now may become more competitive early on, than those who don’t.
The switch to renewable hydrogen will require significant build-out of renewable electricity
capacity. But to become cheap, this renewables capacity must be directly connected to the
electrolysers, which can withstand intermittency, rather than contribute to the power grid
and market instability.
As hydrogen production from renewable electricity is a less efficient means of energy system
decarbonisation than direct electrification, this new renewable energy capacity must come
on top of that which is needed for the decarbonisation of the electricity grid, or from
renewable electricity that would otherwise be curtailed. This not only necessitates a
substantial increase in the EU’s renewable energy targets, but also the preservation of clear
additionality requirements for renewable hydrogen production. Our analysis shows that this
additionality requirement is not overly burdensome on hydrogen projects and may even bring
cost advantages compared to a direct connection to the grid.
Our analysis also shows that there is currently a considerable hydrogen demand from the
ammonia, methanol and refining sectors, even in the direct short term. If it were to be
replaced by renewables-based hydrogen, this would provide a significant boost to the nascent
renewable hydrogen market. When paired with future demand from the steel, aviation and
shipping sectors that will increase towards 2030, significant renewable hydrogen demand will
exist from the sectors identified as priority hydrogen users in the EC’s Hydrogen Strategy. This
calls into question the necessity of using hydrogen in non-priority sectors (e.g. blending into
natural gas pipelines), which is often justified by the need to create new demand for
renewables-based hydrogen.
The EU and many Member States are keen to support the deployment of renewable hydrogen
and are offering generous subsidies to do so, through instruments like the Innovation Fund,
IPCEIs, national schemes and CCfDs. However, our analysis illustrates that such public funding
may (nearly) not be necessary thanks to the EU ETS and RED II. In any case, public funding
for hydrogen projects should be carefully assessed to see whether and in what quantity such
support is necessary. This should be coupled with increased transparency on hydrogen costs,
from both companies and funders, to improve decision-making and investment strategies.
Above all, the competitiveness of green hydrogen will hinge on one key measure: abolishing
free allocation in the EU ETS, which Sandbag has identified for many years as one of the
greatest obstacles to innovation for industrial sectors.
Sandbag | June 2021 23Untangling the knots - clearing the way to fast green hydrogen deployment
References
Agora Energiewende and AFRY Management Consulting (2021) “No-regret hydrogen: Charting early steps for
H2 infrastructure in Europe”
Argonne National Laboratory (2019) “Updates of hydrogen production from SMR process in GREET 2019”.
Available at: https://greet.es.anl.gov/publication-smr_h2_2019
BloombergNEF (2019) “Hydrogen: The economics of production from renewables”
BNP Paribas (2020) “Green Hydrogen, Net Zero, and the Future of the EU-ETS”
BP (2020) “bp and Ørsted to create renewable hydrogen partnership in Germany” [Press release]. 10/11.
Available at: https://www.bp.com/content/dam/bp/business-sites/en/global/corporate/pdfs/news-and-
insights/press-releases/bp-and-orsted-to-create-renewable-hydrogen-partnership-in-germany.pdf
Centre for European Policy Studies (2014) “Final Report for a study on composition and drivers of energy
prices and costs in energy intensive industries: the case of the chemical industry – Ammonia”
DECHEMA Gesellschaft für Chemische Technik und Biotechnologie e.V (2017) “Low carbon energy and
feedstock for the European chemical industry”
EMBER (2021) “Europe’s Power Sector in 2020 dataset”. Available at: https://ember-
climate.org/data/european-electricity/
European Commission (2020a) “A hydrogen strategy for a climate-neutral Europe”. COM(2020) 301 final
European Commission (2020b) “Farm to Fork Strategy. For a fair, healthy and environmentally-friendly food
system”
European Commission (2020c) “Clean Energy Transition – Technologies and Innovations” (accompanying the
document ‘Report from the Commission to the European Parliament and the Council on progress of clean
energy competitinvess’). Accessible at: https://eur-lex.europa.eu/legal-
content/EN/TXT/?uri=CELEX%3A52020SC0953
European Commission (2020d) “Impact Assessment [part 2, annex] to ‘Stepping up Europe’s 2030 climate
ambition. Investing in a climate-neutral future for the benefit of our people’”. Available at:
https://ec.europa.eu/clima/sites/clima/files/eu-climate-action/docs/impact_part2_en.pdf
Fuel Cells and Hydrogen Observatory (2020) “Chapter 2 : Hydrogen Molecule Market”. Available at at:
https://www.fchobservatory.eu/sites/default/files/reports/Chapter_2_Hydrogen_Molecule_Market_0709
20.pdf
Iberdrola, 2020. “Iberdrola and Fertiberia place Spain at the forefront of green hydrogen in Europe, with 800
MW and €1.8 billion investment projected by 2027” [Press release]. 28/10. Available at:
https://www.iberdrola.com/press-room/news/detail/iberdrola-fertiberia-place-spain-forefront-green-
hydrogen-europe-with-1-8-billion-investment-projected-2027
ICIS (2019) "Subsidy-free renewables in Europe : Market data and outlook”. Available at :
https://www.icis.com/explore/resources/news/2019/09/09/10415456/power-perspective-subsidy-free-
renewables-in-europe-market-data-and-outlook
IEA (2017) “Techno-Economic Evaluation of SMR Based Standalone (Merchant) Hydrogen Plant with CCS”
IEA (2019) “The Future of Hydrogen”
International Fertilizer Association (2020) “Production and Trade Tables by Region”. Available at:
https://www.ifastat.org/supply/Nitrogen%20Products/Ammonia
Irena (2018) “Renewable energy prospects for the European Union”
Sandbag | June 2021 24You can also read