2011 Cost of Eating in British Columbia
←
→
Page content transcription
If your browser does not render page correctly, please read the page content below

Cost of Eating
in British Columbia

     2011

       $
Executive Summary
The Cost of Eating in BC has been published for over a decade to detail how much it costs for
individuals and families in BC to access an adequate amount of food, to relate this cost to
income, and to consider the reasons why many people cannot meet this basic need.

In 2011, the provincial average cost of the nutritious food basket for a family of
four is $868.43 per month. Those earning minimum wage, receiving income
assistance, or facing other challenges (high rents, child care, or transportation
costs, for example) struggle to find ways to purchase food as well as meet
their other basic needs.

In the ten years that the Cost of Eating in BC Report has been published, the situation has only
gotten worse for individuals and families earning low wages or receiving government assistance.

In short, food security is having nutritious food that is readily accessible in sufficient amounts
and that each person finds acceptable. The absence of food security, termed food insecurity, can
lead to negative physical and mental health effects whose consequences ripple out to affect all
British Columbians.

Ensuring that individuals and families are food secure is more than addressing the immediate
need to feed our hungry citizens. The solution rests in addressing the underlying factors that
cause food insecurity, specifically poverty and the food system. Recommendations for change
outlined in this report:

   1     Establish a provincial poverty reduction strategy
   2     Build affordable housing
   3     Update income assistance to reflect the cost of living
   4     Enact a living wage policy
   5     Work toward sustainable food systems that no longer require food banks

Individuals, communities, and all levels of government need to be involved to make British
Columbians food secure. This report provides many ways that individual British Columbians
can create change.

       THE PURPOSE OF THIS REPORT

    British Columbia (BC) is a truly beautiful and unique province,      What many of us fail to realize is that society as a whole
    with much to offer both citizens and visitors alike. It is also      suffers when our neighbours and friends face food insecurity
    home to a staggeringly high poverty rate: the highest in Canada      and poverty. Whether directly or indirectly, these issues
    with 12% of British Columbians unable to meet basic needs.1          affect each and every one of us.
    The right to food is recognized in the United Nations’ (UN)
    Universal Declaration of Human Rights2. Despite this fact,           The purpose of this report is to detail how much it currently
    many individuals and families in BC struggle to access food.         costs for individuals and families in BC to access an adequate
                                                                         amount of food, to relate this cost to income, and to consider
    Food insecurity, or the lack of adequate food, is prevalent in       the reasons why many people cannot meet this basic need.
    many communities in BC. The BC Community Nutritionists’              To this end, this report provides a snapshot of the factors
    Council and, now, Dietitians of Canada have been researching         that allow food insecurity to continue and suggests solutions
    the economic cost of accessing a basic, healthy diet based on a      to which individuals, communities, and governments can
    defined “nutritious food basket” for over a decade 3. These costs,   lend support.
    as well as the contributing social and systemic factors, speak
    volumes as to why so many people go without enough food.
Who faces food insecurity and
how it affects the province                                                                           Prolonged food
                                                                                                      insecurity can lead to:

DEFINITION
                                                                                                     • poor pregnancy outcomes,
The definition of food security encompasses many elements. In 2002, The UN Food and
Agriculture Organization defined food security as                                                    • poor growth and development
                                                                                                       in children,

    “… a situation that exists when all people, at all times, have                                   • learning deficits,
    physical, social and economic access to sufficient, safe, and
                                                                                                     • poor school performance,
    nutritious food that meets their dietary needs and food
    preferences for an active and healthy life.” 4                                                   • increased illness and
                                                                                                       susceptibility to disease for
                                                                                                       people of all ages,
The Ryerson Centre for Studies in Food Security refined this definition by adding that the food
should be produced and obtained in environmentally sustainable ways that do not compromise           • increased medical costs, and
the dignity, self-respect, or human rights of both producers and consumers and, further, that
                                                                                                     • decreased life expectancy.8
policies and processes be put into place to achieve food security.5

                                                                                                       Mental anguish also
In short, food security is having nutritious food that is readily accessible in sufficient amounts     troubles food insecure
and that each person finds acceptable. Food energizes mind, body, and spirit, and plays                individuals and families.
a role in the health and productivity of all British Columbians. It is surprising, then, that
7.7% of British Columbians are considered food insecure,6 with disrupted
eating patterns and reduced food intakes.7

Barriers that British Columbians face to accessing
food include:

• income level,
• purchasing power,
• proximity to places where food is sold
  (especially those in remote locations),
• mobility, and
• lack of knowledge or space for food preparation
  and storage.

The goal of food security is to eliminate
these barriers for every single individual
in the province.

                                                                                                                                       3
A wide variety of people suffer from food
     insecurity, most prominently women, Aboriginal
     peoples, the working poor, seniors, the homeless
     population, and those with mental or physical health
     issues.9 Food insecurity affects different people in
     different ways, depending on the extent to which
     they face barriers to access.

    MEET OUR REFERENCE FAMILY OF FOUR

    Bruno works full-time in Vancouver for $11 an hour. With limited     and rarely have enough money for fresh fruits and vegetables.
    transit options at his disposal, he commutes from his family’s       They also go to their local food bank but are not guaranteed to
    home in the suburban town of Aldergrove for at least two hours       take home items of high nutritional value or quality. Because
    each day. They recently moved from Langley to a home they            of his poor eating habits, Bruno is often lethargic during his
    could better afford. Bruno’s wife, Maria, stays home with their      long days at his labour-intensive job. On his next trip to the
    four-year old daughter, Ana, as they are unable to pay for           doctor, he will be informed that he has been diagnosed with
    childcare costs. Their son, Alexander, is 14 years old, and          diabetes. He does not receive extended health benefits at
    attends public school in Langley. Despite the fact that Bruno        work to help cover the medications and testing strips needed
    works, the family still struggles with money. After they pay for     to manage diabetes, although he may be eligible for some
    housing and food, they only have $867 leftover to cover other        coverage under the Pharmacare program. Maria often skips
    costs including transportation, clothing, and school supplies.       meals so that her children have enough to eat. Alexander
    Maria stresses about finances and the items they cannot afford.      struggles to concentrate on his schoolwork as he does not eat
    When it comes to buying groceries, there is not much available       a substantial breakfast or lunch regularly. He is in danger of
    in their neighbourhood. They must drive to the nearest large         being held back a grade. In a few years, he will likely drop out
    grocery store, where they purchase cheaper, processed foods          of school and continue the cycle of poverty as an adult.

    This is just one example of how a family may be affected by food insecurity.

How food insecurity affects us all
When individuals like Bruno and Maria and their family are food insecure, all British Columbians suffer in one way or another10. While
price is certainly a factor in accessing food, the cost of food is only a symptom of a much larger problem. Individual or household
food security is part of the larger context that … “includes the economic, social and food systems, food policies, food culture, and the
engagement of community in shaping the context.”11 Our communities as a whole experience higher health care costs, lost economic
activity, and increased crime and policing costs, which can largely be attributed to the overall condition of poverty.12

Actions taken to deal with food insecurity are better framed from a community perspective rather than an individual one. To maintain
the status quo of poverty, the cost to the province is an overwhelming $8.1-9.2 billion per year. The implementation of a poverty
reduction strategy would cost just half that, at roughly $4 billion.13 By not addressing the issue of poverty, governments and citizens
are losing money and lives are negatively affected.

4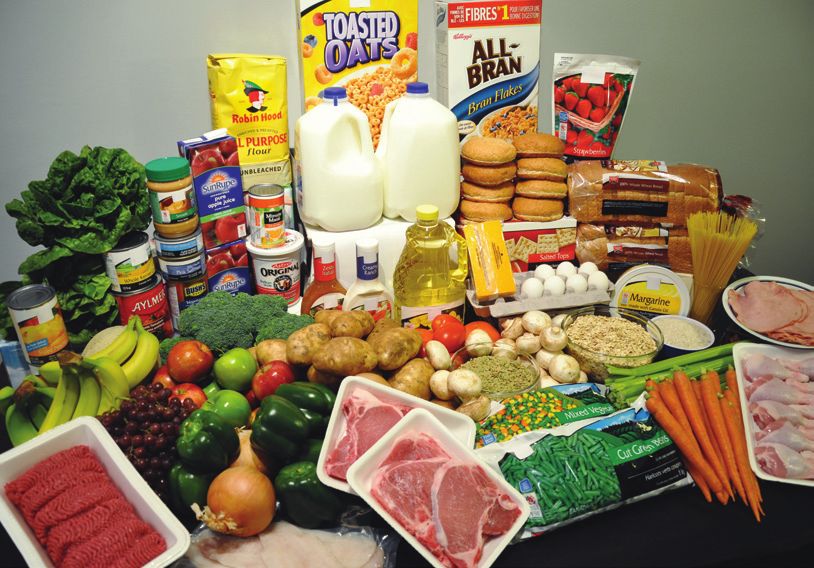
The foods in the nutritious

Determining the cost of the                                                                        food basket are foods that
                                                                                                   require preparation.

nutritious food basket                                                                             The basket does not include:
                                                                                                   • take-out, restaurant foods, or
Among all of the needs that British Columbians must meet to survive, food almost always              pre-packaged meals;
takes a backseat. Health Canada’s National Nutritious Food Basket (NNFB)14 is a tool used to       • any non-food items that can be
monitor the cost and affordability of healthy eating. It was first introduced in Canada in 1974      purchased at grocery stores like
and was most recently updated in 2008 based on current healthy dietary guidelines and data           personal care items and
on foods consumed. The NNFB describes the quantity and purchase units of about 60 foods              household supplies; or
that represent a basic nutritious diet for people of different ages and sexes.                     • additional items essential for food
                                                                                                     preparation such as cooking
There are six health authorities in British Columbia. Five of the health authorities serve           equipment and utensils, spices
                                                                                                     and condiments, and proper
geographic regions in BC as shown in Figure 1. The sixth health authority is the Provincial
                                                                                                     storage facilities.
Health Services Authority (PHSA), ensuring that BC residents have access to a coordinated
network of high-quality specialized health care services. In May 2011, public health dietitians/   The basket does not take into account
community nutritionists, health authority staff, and volunteers compiled the costs of the          any special dietary needs, cultural or
foods in stores within each of the five regional health authorities. The stores in each region     other food preferences that may
                                                                                                   influence food choices nor the additional
were randomly drawn from a list of all grocery stores in the province. The population of the
                                                                                                   costs that are associated with food
regional health authority and the variation in food costs among stores in the previous year        purchase. These additional costs include
determined the number of stores sampled in each region. In total, costing of food for 2011         travel costs that can significantly affect
                                                                                                   the total cost. For people in urban
was carried out in 133 stores throughout the province. The data was then analyzed by PHSA
                                                                                                   settings, grocery stores are more
to determine the monthly cost.                                                                     accessible and public transit is
                                                                                                   available, keeping these costs to a
                                                                                                   minimum. In more remote areas,
Figure 1
                                                                                                   significant travel costs can exist
                                                                                                   because these populations are further
                                                                                                   removed from places to access the foods
                                                                                                   contained in the nutritious food basket.
                                                                                                   People drive for hours to get to, and
                                                                                                   home from, a grocery store.

                                                                      BC Average                   The cost of a healthy

                                    Northern Health
                                                                       $868.43                     food basket.

                                        $841.01                                                    The 2011 average monthly cost of
                                                                                                   the nutritious food basket for a
                                                                                                   family of four in BC is $868.43.

                                                                                                   The cost of the food basket in BC
                                                                                                   is the average cost, weighted by
                                                                                                   population, of the basket in each
                                                                                                   geographic health region as shown
             Vancouver Coastal Health                                                              in Figure 1. The actual cost of food
                                                                                                   varies from community to
                     $944.16
                                                                                                   community within each region.
                                                            Interior Health
                                                                                                   Vancouver Coastal Health (VCH)
                                                              $832.82                              has the highest monthly food cost
                                                                                                   for a family of four at $944.19, while
                 Vancouver Island Health           Fraser Health                                   Interior Health (IH) has the lowest
                        $873.08                      $851.07                                       cost at $832.82.

                                                                                                                                                5
Accessing basic food
needs in BC
Table 1 lists the cost of food and the cost of housing as a proportion of disposable income
for several different households in BC, including our reference family (family 6). This table
illustrates that, once families or individuals receiving income assistance (commonly known
as ‘welfare’) have paid for housing and food, they have virtually nothing left for other living
costs. In some instances, once they have paid their rent, they are unable to afford the
healthy food basket. They must choose between having a roof over their heads and
eating enough food.

Families and individuals on income assistance in BC require anywhere
from 34% to 49% of their disposable income to pay for food.

A low-income family of four where one parent makes $11.00 per hour, such as Bruno and
Maria’s family, must use 34% of their monthly disposable income to purchase the nutritious
food basket. The chosen low-income wage of $11.00 is more than the minimum wage in BC,
which currently sits at $9.50 per hour and is scheduled to increase to $10.25 in May of 2012.
Median income, as opposed to low income, is the amount that divides the overall income
distribution into two equal groups - half having income above that amount, and half having
income below that amount.15 A family with one median income earner spends just 15% of
their income on food.

    TABLE 1: Cost of food as a proportion of disposable income for seven scenarios

    Monthly Income
     Family of 4,                        Single parent,   Single older,        Young,           Single man,    Family of 4,    Family of 4,
    and costs
       income                              2 children,      woman         pregnant woman          disability   low-earned     median income
      assistance                             income          income           income             assistance      income
    		                                     assistance      assistance        assistance

    Disposable income      $1,851           $1,786           $663              $708                $959          $2,530           $5,621
    Cost of housing         $1,107          $1,107           $732              $732                $732           $795            $1,491
    Percentage of income
    required for housing    60%              62%             110%              103%                76%            31%              27%
    Cost of food            $868             $689             $218             $273                $322           $868             $868
    Percentage of income
    required for food       47%              39%             33%               39%                 34%            34%              15%
    What’s left after
    housing and food       - $124            - $10          - $287            - $297               - $95          $867            $3,262

As seen in Table 2, the cost of the healthy food basket in BC has not changed significantly since the 2009 Cost of Eating in BC Report.16
Income assistance rates continue to remain virtually unchanged, even with a substantial increase in the cost of living over the past few
years. The reference family of four living on income assistance was receiving $401 in support allowance (non-shelter allowance) in 2001
and is still receiving the same amount in 2011.17 This clearly illustrates that the support allowance provided is inadequate to cover the cost
of healthy food and that the cost of food has risen substantially since 2001, now taking 216% of the support allowance as compared to
156% in 2001. This leaves nothing for other costs, meaning people are left in a negative balance without having yet purchased any other
essentials.

6
TABLE 2: Cost of food as a proportion of the support allowance for the reference family of four, 2001 – 2011

    Family of 4,
    income assistance           2011           2009             2007           2006             2005             2004             2003             2002            2001

    Support income              $401           $401             $401            $401             $401            $401             $401             $401            $401
    Cost of food               $868            $872             $715           $653              $654            $632             $648             $629            $626
    Cost of food as %
    support allowance          216%            217%             178%           163%             163%            158%              162%             157%            156%

Table 3 shows the details of how the disposable income and the housing costs of the different family scenarios were determined.

    TABLE 3: Food as a proportion of disposable income for seven family scenarios – the details
                                Family 1               Family 2             Family 3             Family 4            Family 5          Family 6          Family 7
    Monthly Income          Reference family        Single parent,        Single older       Young pregnant,       Single man,     Reference family, Reference family,
    and costs                   income           2 children, income      woman, income       woman, income           disability      low-earned       median income
                               assistance             assistance           assistance           assistance          assistance          income

    Net income (after
    payroll deductions)1         $1,101                $1,036                 $610                  $610                $906              $1,793               $5,6002

    Child/family benefits3        $726                  $726                   $50                  $50                 $50                $737                  $142

    Additional benefits4          $24                    $24                   $3                   $48                  $3                 $0                    $0

    Medical services plan          $0                    $0                    $0                    $0                  $0                 $0                    $121

    Disposable income            $1,851                $1,786                 $663                 $708                 $959             $2,530                 $5,621

    Housing $1,107
             5
                   $1,107 $732 $732 $732 $1,107                                                                                                                 $1,491
    						                               - 312
    						                               $ 795

    % disposable income
    required for housing         60%                    62%                   110%                 103%                 76%                31%                   27%

    Cost of food6                $868                   $689                  $218                  $273                $322              $868                   $868

    % disposable income
    required to purchase food 47%                       39%                   33%                   39%                 34%                34%                   15%

    What’s left for all
    other costs                  - $124                 - $10                - $287                - $297               - $95             $867                  $3,262
    Note: All dollars and numbers rounded to the nearest whole number.

1
  Reference Family: mother and father, 31 – 50 years; boy 14 years; girl 4 years
  Family 1: reference family, income assistance. Shelter allowance $700.00; support allowance $401.06
  Family 2: one parent family, mother 31 – 50 years; boy 14 years; girl 8 years; income assistance. Shelter allowance $660.00; support allowance $375.58
  Family 3: single older female, 60 years; income assistance. Shelter allowance $375.00; support allowance $235.00
  Family 4: single pregnant woman, 19 years; income assistance. Shelter allowance $375.00; support allowance $235.00
  Family 5: single male, 25 years; disability assistance. Shelter allowance $375.00; support allowance $531.42
  Family 6: reference family, one low-income earner, $11.00/hour, before tax yearly income $22,880.00. After payroll deductions: (CPP of 960.32 and EI of 407.34 –
		           no income taxes payable) = $21,512.34 (yearly)
  Family 7: reference family, one earner, median income after tax yearly income $67,200.00
2
  Statistics Canada. Selected income concepts for economic families of two persons or more by province, 2009, median total income, by family type, by province and territory,
  modified 2011-07-05
3
  Child/family tax benefits 2011 estimate. Includes, where applicable, basic family monthly bonus, national child benefit monthly supplement, BC family bonus monthly
  supplement; GST/HST quarterly credit, BC Low Income Climate Action Tax Credit (BCLICATC) quarterly supplement, and BC HST Credit (BCHSTC) quarterly amount,
  BC Earned Income Benefit monthly supplement
4
  Includes, where applicable, Christmas supplement and school start-up supplement and natal supplement
5
  Housing includes rent and telephone. Utilities (e.g. electricity, gas, water) may or may not be included. Source: Canada Mortgage and Housing Rental Market Survey,
  October 2011 Custom Tables, Vancouver Census Metropolitan Area. Rent for families 1, 2 & 6 is for a 3-bedroom apartment (25th percentile). Family 6 is eligible for an
  estimated rental assistance of $312.29. Rent for families 3, 4 & 5 is for bachelor apartment (25th percentile). Rent for Family 7 is for 3-bedroom apartment (average rent).
  Telephone is basic service in Vancouver area: $28.97 plus 911 fee plus HST for a total fee of $32.45 per month.
6
  2011 BC monthly average cost of the national nutritious food basket

                                                                                                                                                                             7
Table 4 illustrates the cost of the nutritious food basket for
different individuals and families based on the 2011 data. This
data can be used to calculate the cost of a nutritious food basket
for any individual or family unit.

    TABLE 4: Average monthly cost of the food basket in BC 2011

      Age/gender groups                                        Monthly Cost*

    Family of Four
    woman 31-50; man 31-50; boy 14-18; girl 4-8               $     868.43

    Family of Three
    woman 31-50;
    boy 14-18; girl 4-8                                       $     688.90

    Boy
    2-3 years		                                               $      114.82
    4-8 years		                                               $     148.01
    9-13 years		                                              $     195.24
    14-18 years		                                             $     275.82

    Girl
    2-3 years		                                               $       112.32
    4-8 years		                                               $      143.03
    9-13 years		                                              $      168.36
    14-18 years		                                             $     200.66

    Man
    19-30 years                                               $     268.55
    31-50 years		                                             $     243.59
    51-70 years		                                             $     234.02
    Over 70 years                                             $      231.37

    Woman
    19-30 years                                               $     208.72
    31-50 years		                                             $     206.00
    51-70 years		                                             $       181.51
    Over 70 years                                             $      178.30

    Pregnancy
    Younger than 18 years                                     $     223.89
    19-30 years                                               $     227.22
    31-50 years		                                             $     221.62

    Breastfeeding
    Younger than 18 years                                     $     232.69
    19-30 years                                               $     240.50
    31-50 years		                                             $     234.90

    * Food costs reported are based on living in a family of four. It costs more
      per person to feed smaller families and less to feed larger families.
      To calculate the monthly cost for families of different sizes, see the
      table below.

    Household Size Adjustment Factor

    Family Size                                 Adjustment Factor

    Individual		                                Multiply by 1.20
    Two people                                  Multiply by 1.10
    Three people                                Multiply by 1.05
    Four people                                 Multiply by 1.0 (no change)
    Five to six people                          Multiply by 0.95
    Seven people or more                        Multiply by 0.90

8
To achieve food security,
Nothing is improving                                                                                 it is best to view it as
                                                                                                     a continuum. This
Despite all of the research, statistics, and policy suggestions available, very little has changed   continuum27 illustrates
in terms of legislated food security and poverty reduction initiatives. Child
                                                           poverty in                                how communities can
BC remains the highest in Canada for eight years straight,18 food bank                               transition toward long-
usage is at an all-time high,19 income assistance has not been changed                               term solutions while still
to coincide with inflation,20 and BC is one of the few remaining                                     filling short-term needs.
provinces without a poverty reduction strategy in place. To compound
this, a food supply chain that, at times, is inefficient and unsustainable can complicate a
person’s ability to access food.                                                                     Stage 1
Food banks, which began in Canada in 1989 as a temporary measure,21 are one avenue to                Short-term Relief (efficiency)
                                                                                                     Short-term relief includes
                                      Now, more than ever, many
which those who are food insecure continue to turn.
                                                                                                     emergency/charitable food
British Columbians depend on food banks to survive. These charitable                                 programs such as food banks
institutions take on the responsibility of feeding citizens when they often do not have the
                                                                                                     and soup kitchens that primarily
capacity to do so.22 Reliant on donations from the public and corporations, food banks and
                                                                                                     address immediate hunger.
other services cannot always provide the items required for a healthy, balanced diet and
struggle to keep up with demand.23

Those assisted by British Columbia’s 91 food banks, in numbers:24                                    Stage 2
• 90,193 individuals used food banks from 2010-2011; this is a 15.5% increase in use                 Capacity-building (transitional)
  since 2008;
                                                                                                     Capacity-building food programs,
• 31.8% were children and youth;
                                                                                                     such as community kitchens and
• 45.1% were women;                                                                                  community gardens, have the
• 16.4% of households receiving food had income from current or recent employment                    potential to empower participants
• 14.7% of food bank users identified as Aboriginal; and                                             through education and training,
• 76.1% of food bank users are market housing renters (not subsidized by government).                and help raise awareness of food
                                                                                                     issues.
These statistics indicate that there are underlying contributors adding to the plight of our food
insecure population. The lack of other basic rights, such as adequate housing and education,
often undermines one’s right to food.25 For example, the fact that the majority of food bank
users are market housing renters attests to the clear lack of affordable housing in BC. The cost
                                                                                                     Stage 3
of living in BC is one of the highest in Canada,26 which means that families on even median          Redesign (systemic)
incomes must depend on charities to feed themselves. That so many individuals use food               Redesign of the food system,
banks despite current or recent employment speaks to the need to update wage structures              through food policy councils,
and income assistance.                                                                               implementation of food
                                                                                                     policies, social enterprises, and
Many of the reasons why British Columbians live in poverty have to do with the outdated              social advocacy to address
policies in place. Food
                  banks have always been a band-aid solution to the                                  poverty, deals with the
                                                                                                     shortcomings of both the
larger problem of poverty in BC. On the surface, it may look as if those who are
                                                                                                     short-term relief and capacity-
hungry have options but free food from the food bank alone does not relieve food insecurity.
                                                                                                     building programs and is aimed
It is a concern that as long as people are fed, action to address the root causes of poverty will
                                                                                                     at improving the economic,
be delayed. While food banks are necessary to feed people today, long-term solutions must
                                                                                                     ecological and social sustainability
be found to end poverty. Our governments need to be held accountable for taking such little
                                                                                                     of the food system.
action in terms of reducing hunger and poverty. British Columbians have the power to make
this possible.

                                                                                                                                            9
Best practices for reducing
hunger and poverty
POVERTY REDUCTION STRATEGIES
While British Columbia is still without a poverty reduction strategy in place, other provinces
have made excellent headway in their own efforts. Ontario introduced a Poverty Reduction
                                                                                                  “A ‘living wage’ is meant
Act in 2009, which pledged to invest in education and early learning, foster positive local
initiatives, and review income assistance programs.28 To date, Ontario has reduced their child
                                                                                                  to reflect the actual income
poverty rate from 15.2% to 14.6%. Quebec and Newfoundland & Labrador have been                    required for a two-earner,
exemplary in terms of their strategies. In 5 years, the number of individuals and families        two-child household to
using income assistance in Quebec dropped nearly 3%, from 12% to 9.4%.29 Their govern-            live above the poverty line.
ment invested in training and supporting access to employment, improved disposable income         … The living wage policy
for low-income earners, increased access to social housing, and have implemented a Child
                                                                                                  passed unanimously by
Assistance and Work Program and a new five-year plan (2010 – 2015).30 Newfoundland &
                                                                                                  New Westminster council
Labrador once surpassed BC as the province with the highest poverty rate in Canada. After
using community consultation to establish their strategy in 2006, poverty dropped from 12%        last year will see workers
to 7% by 2009.31 This was in part due to the fact that their government indexed welfare rates     paid at least $16.74 per
in accordance with inflation, something the provincial government in BC has yet to do. The BC     hour. … Esquimalt passed
Poverty Reduction Coalition suggests that BC has much to learn from strategies such as the        a similar policy, and the
one in place in Newfoundland.32                                                                   municipalities of
                                                                                                  Cowichan, Williams
LIVING WAGE POLICY
                                                                                                  Lake, and Cranbrook
The City of New Westminster became the first municipality in BC to introduce a Living Wage
policy in April of 2010. The public showed overwhelming support for the initiative through        are considering it.”34
their votes: city councillors in the November 2011 elections who backed the policy saw a
substantial increase in their popularity.33

LOCAL FOOD INITIATIVES
The root cause of hunger is not a lack of food, but a lack of access to available food, whether
that is due to purchasing power, food prices, or other factors.35 Growing food locally and
regionally alleviates some of these issues with accessibility.

BC has embraced the local food movement already. Many cities and municipalities are
creating policies and councils to speak to food security issues. Metro Vancouver, for
example, has already developed a Regional Food System Strategy.36 The Kamloops Food
Policy Council (KFPC),37 established in 1995, was one of the first councils of its kind in
Canada.In 2006, the KFPC published their Food Action Plan,38 which detailed their initiatives
for a food secure community. Goals and actions included:

• amending bylaws in higher density, urban areas to allow for food production;
• promoting opportunities for Aboriginal people to maintain connections to land, traditions,
  communities, and identities;
• establishing an alternative currency for food purchases to ensure dollars stay in
  the community;
• acknowledging that local food can boost economic development; and
• increasing public awareness and education not only about food security but also on
  food-skills.

10
Most recently, the KFPC has been working on an Urban Agriculture Plan to encourage
community gardening (with a goal of 4 to 5 spaces for every 1000 residents) and
edible landscaping.
Schools are now seeing the need to implement programs that start children on a lifelong path
of healthy eating by connecting them with their food early in life. A number of programs in
BC work towards this goal, such as the Farm to School Salad Bar program run by the Public
Health Association of BC. The Farm to School Salad Bar program objectives include increasing
student knowledge about local food systems and nutrition, enhancing student skills in the
food sector, and strengthening partnerships and the local economy.39
Recommendations
Ensuring that communities are food secure is more than addressing the immediate need to
feed our hungry citizens. The larger issues leading to food insecurity demonstrate a need
for system change; no single solution will solve this problem.
The following are recommendations that may begin to alleviate some of the barriers to accessing food:
Establish a provincial poverty reduction strategy
A common misconception is that a poverty reduction strategy will cost more than the good it will do. The reality is that such
legislation will save billions of dollars per year. As previously stated, creating a strategy would cost about $4 billion, whereas
maintaining the status quo costs taxpayers $8 billion or more through higher public health care costs, increased policing
and crime costs, lost productivity, and foregone economic activity.40 Other provinces have already demonstrated that a
comprehensive poverty reduction strategy can be truly effective. The issues at hand, unique to British Columbia and otherwise,
must be acknowledged and the provincial government must work with other levels of government to make the lives of
impoverished British Columbians better.
Build affordable housing
Land and real estate are at a premium in BC. Space for housing is becoming increasingly limited due to restrictions caused by
topographical elements such as water and mountains. The demand for housing, especially single family homes, and the lack
of land create a strong seller’s market, putting an exorbitant price tag on most available housing options whether buying or
renting. No individual or family should have to make a choice between housing and food.
Affordable housing, which includes both social and market housing, must be included in community planning initiatives. Social
housing developments need to take into consideration the needs of tenants, including food access, preparation, and storage.
Social housing designed to meet the needs of tenants may help empower impoverished individuals and families to elevate
themselves out of their situation.
Update income assistance to reflect the cost of living
As mentioned, many people suffering from food insecurity receive income assistance from the BC Ministry of Social
Development. These income assistance amounts have increased very little since 2001. The costs of housing, food, and other
expenses have increased greatly, yet those on assistance are expected to survive with what little allowance they receive.
This is unrealistic. Like affordable housing, government services such as income assistance should provide the help needed
to propel a person out of poverty in a dignified manner, not extend the constant struggle to balance priorities. An adequate
amount of income assistance to cover basic expenses would help achieve this goal.
11Recommendations (continued)
Enact a living wage policy
Food insecurity also strikes those who are employed. Even with the minimum wage in BC rising, there remains a gap between
this and the estimated living wage in BC, which ranges from $14.16 per hour (Cranbrook) to $18.81 (Metro Vancouver). A
living wage would cover the bare bones living expenses, including food, clothing, shelter, medical services/other health care,
transportation, and child care (if necessary).41 A living wage benefits employers by reducing employee turnover, improving job
quality and efficiency, and lowering absenteeism.42 More importantly, quality of life improves for employees. Individuals
earning a living wage are able to make better food choices, can more actively contribute to the community, and are not
forced to choose one basic need over another.
Work toward sustainable food systems that no longer require food banks
Working toward change in our food systems will be a long process requiring collaborative efforts from food producers,
consumers, and governments of all levels (municipal, provincial, federal, and First Nations). This would require a shift in
consumer attitude, policies, and community planning, making it a fairly complicated but necessary recommendation.
One way that the province could work toward food security is by streamlining and localizing the food supply chain as much
as possible. Research has shown that “growing, producing, and processing more local, healthy, safe food can contribute to
a more food secure province by reducing BC’s dependence on imported food and improving access to healthy foods in those
communities and neighbourhoods in which it may be limited.”43 By doing so, it is possible to prevent the immense loss of
resources and edible food that occurs right now – one-third of food that is produced in North America is wasted.44 The cost
of such waste is expected by producers and is factored into the cost to the consumer, raising the price of food.45
A change in the food system may save consumers money eventually but it is also about connecting consumers with what they
eat, being less intrusive on the environment, and boosting the local economy.46 In fact, BC’s agricultural sector generates more
than $22 billion in sales from only 3% of our province’s land base.47 This can only increase with more suitable land used for
food production. To facilitate the transition in the food systems, farmers and consumers can work together, establishing an
adequate number of farmers markets, co-operatives, community gardens, and food share programs. Local food should be
made more readily available through the three most dominant sectors: retail, restaurant/industry, and institutions (schools,
hospitals, etc).48 Educational and interactive food programs in schools are important to start children on the path to healthy
eating through local food.
A more productive, efficient food supply chain combined with other policy changes such as an increase in wages and income
assistance could mean a possible end for emergency food aid. These recommendations must occur in conjunction to ensure
individuals and families access their food in a dignified manner and through their own means.
“ Many Canadians seem to be concerned that reducing poverty means more spending
on people living in poverty, leaving others worse off. The growing body of research and
experience, however, tells a very different story. It shows that investing to reduce
poverty improves wellbeing for everyone.
John Rook, chairperson of the National Council of Welfare,
”
in the Council’s 2011 Report The Dollars and Sense of Solving Poverty 49
12How can you help?
Fighting poverty and social exclusion is a collective responsibility.50
Individuals, communities, and all levels of government need to be involved to make this
happen for BC. It may seem daunting but, as an individual who is concerned that people in
BC do not have enough to eat, there are ways you can help.
Some suggestions to get you started include:
• Log onto the BC Poverty Reduction Coalition website at http://bcpovertyreduction.ca. This site is a wealth of information on
• the cost of poverty in BC (watch the videos at http://bcpovertyreduction.ca/category/video to find out more)
• how to take action (email the Premier and add your voice to the call to the Government of British Columbia to
reduce poverty and homelessness in our province at http://bcpovertyreduction.ca/take-action-2).
• Contact your local MLA (find out who represents your area at www.leg.bc.ca/mla/index.htm) and enlist his or her help.
• Support the Living Wage for Families campaign in BC (find out more at http://livingwageforfamilies.ca) Suggest to your local
government officials that your community support this initiative. Find out how your company can benefit from this campaign.
• Volunteer your time and skills at an organization that supports poverty reduction at your local and regional level.
Raise the Rates is a good place to learn more (www.raisetherates.org/home2.html).
• Volunteer at and support your local food bank knowing that we must help in the short-term, while working to find long-term
solutions that may eliminate the need for food banks.
• Check out the BC Food Security Gateway at www.bcfoodsecuritygateway.ca. The Gateway will inform and link you to
projects, initiatives, and organizations in BC so that you can contribute to building a healthy BC.
• Help to build a strong market for local food by demanding it at restaurants, grocery stores, and other institutions
(get started at www.getlocalbc.org).
• Help the next generation learn about healthy eating and transitioning to local, sustainable food systems by suggesting a Farm
to School program be implemented in the curriculum of your child’s school or one in your neighbourhood. Find out more at
www.phabc.org/modules.php?name=Farmtoschool.
• Get involved in your local food policy council or start one. Check out the councils in your area for how to do so. Look to the
Kamloops Food Policy Council for exceptional ideas that could be implemented at http://kamloopsfoodpolicycouncil.com.
• Support affordable housing in BC by contacting the Ministry of Energy and Mines, Office of Housing and Construction Standards
at www.housing.gov.bc.ca/housing.
• Promote dialogue in your community to look critically at food security issues using the Community Food Assessment Guide
www.healbc.ca/files/Community_food_assessment_guide_final_(2).pdf.
• Engage in conversations with family, friends and neighbours about food security initiatives and possible solutions.
• Share this report with family, friends, co-workers, neighbours, and others.
13References
1
B.C. Poverty Reduction Coalition. Join the call for action. http://bcpovertyreduction.ca/ Accessed 27 Dec 2011.
2
United Nations. The Universal Declaration of Human Rights. http://www.un.org/en/documents/udhr/ Accessed 22 Jan 2012.
3
Dietitians of Canada and the Community Nutritionists Council of BC. The cost of eating in BC, Dietitians of Canada, 2001 – 2009.
http://www.dietitians.ca/Secondary-Pages/Public/The-Cost-of-Eating-in-British-Columbia.aspx. Accessed 19 Oct 2011.
4
Food and Agricultural Organization of the United Nations FAO, 2002. The State of Food Insecurity in the World 2001. Rome.
http://www.fao.org/docrep/005/y4671e/y4671e06.htm#fn31. Accessed 22 Jan 2012.
5
Ryerson University. Centre for Studies in Food Security. http://www.ryerson.ca/foodsecurity/definition/index.html. Accessed 5 Nov 2011.
6
Health Canada. Household Food Insecurity in Canada in 2007-2008: Key Statistics and Graphics.
http://www.hc-sc.gc.ca/fn-an/surveill/nutrition/commun/insecurit/key-stats-cles-2007-2008-eng.php#d. Accessed 22 Jan 2012.
7
Provincial Health Services Authority. Food for Thought. The issues and challenges of food security. August 2010.
http://www.phsa.ca/NR/rdonlyres/C3E70150-66FF-48E1-B2F1-45BB83B03019/0/FoodforThought_ResearchBooklet_FINAL.pdf. Accessed 5 Nov 2011.
8
Kines, Lindsay. ‘Huge’ Health Gaps between North and South Mapped Out in UVic Project. Times Colonist, January 13 2012.
http://www.vancouversun.com/health/Huge%2Bhealth%2Bgaps%2Bbetween%2Bnorth%2Bsouth%2Bregions%2Bmapped%2BUVic%2Bproject/5991737/
story.html Accessed 23 Jan 2012.
9
Klein, S., Griffin Cohen, M., Garner, T., Inanova, I, Lee, M, Wallace, B. and Young, M.
A Poverty Reduction Plan for BC, December 2008. Canadian Centre for Policy Alternatives – BC Office.
http://www.policyalternatives.ca/sites/default/files/uploads/publications/BC_Office_Pubs/bc_2008/ccpa_bc_poverty_reduction_full.pdf.
Accessed 5 Nov 2012.
10
Ivanova, Iglika. Cost of Poverty in BC Report, July 2011. Co-published by the Canadian Centre for Policy Alternatives – BC Office, the Public Health Association of BC,
and the Social Planning and Research Council of BC.
11
Ross, Sue and Simces, Zena. Community Food Assessment Guide, March 2008. Provincial Health Services Authority.
http://www.healbc.ca/files/Community_food_assessment_guide_final_(2).pdf. Accessed 22 Jan 2012.
12
Ivanova, Iglika. Cost of Poverty in BC Report, July 2011.
13
ibid
14
Health Canada. National Nutritious Food Basket. http://www.hc-sc.gc.ca/fn-an/surveill/basket-panier/index-eng.php. Accessed 2 Dec 2011.
15
The Conference Board of Canada. Hot Topic: Canadian Income Inequality. July 2011. http://www.conferenceboard.ca/hcp/hot-topics/canInequality.aspx.
Accessed 22 Jan 2012.
16
Dietitians of Canada and the Community Nutritionists Council of BC. The cost of eating in BC 2009, Dietitians of Canada.
http://www.dietitians.ca/Secondary-Pages/Public/The-Cost-of-Eating-in-British-Columbia.aspx. Accessed 19 Oct 2011.
17
ibid
18
First Call: BC Child and Youth Advocacy Coalition. BC Campaign 2000. 2011 Child Poverty Report Card, November 2011. Vancouver: First Call: BC Child and Youth
Advocacy Coalition with the collaboration and support of SPARC BC and AMSSA.
19
Food Banks Canada. Hunger Count 2011. A comprehensive report on hunger and food bank use in Canada, and recommendations for change.
http://foodbankscanada.ca/getmedia/dc2aa860-4c33-4929-ac36-fb5d40f0b7e7/HungerCount-2011.pdf.aspx. Accessed 27 Dec 2011.
20
Dietitians of Canada and the Community Nutritionists Council of BC. The cost of eating in BC, Dietitians of Canada, 2001 – 2009.
http://www.dietitians.ca/Secondary-Pages/Public/The-Cost-of-Eating-in-British-Columbia.aspx. Accessed 19 Oct 2011.
21
Food Banks Canada. Hunger Count 2011.
22
Riches, Graham. Why Governments Can Safely Ignore Hunger, February 1, 2011. Canadian Centre for Policy Alternatives – National Office.
http://www.policyalternatives.ca/publications/monitor/why-governments-can-safely-ignore-hunger. Accessed 5 Nov 2011.
23
Rock, Melanie. We don’t want to manage poverty: community groups politicize food insecurity and charitable food donations. IUHPE – Promotion and Education
Vol. XIII, No. 1, 2006. http://www.cacis.umontreal.ca/pdf/PE_managepoverty_Rock.pdf. Accessed 5 Nov 2011.
1424
Food Banks Canada. Hunger Count 2011.
25
Food and Agriculture Organization of the United Nations. The right to food. http://www.fao.org/righttofood/index_en.htm. Accessed 5 Nov 2011.
26
Food Banks Canada. Hunger Count 2011.
27
Ross, Sue and Simces, Zena. Community Food Assessment Guide, March 2008.
28
Legislative Assembly of Ontario. Bill 152, Poverty Reduction Act, 2009.
http://www.ontla.on.ca/web/bills/bills_detail.do?locale=en&BillID=2147. Accessed 20 Dec 2011.
29
B.C. Poverty Reduction Coalition. National Plans. http://bcpovertyreduction.ca/learn-more/poverty-reduction-plans/. Accessed 27 Dec 2011.
30
Government of Quebec. Quebec’s Combat Against Poverty. Government Action Plan for Solidarity and Social Inclusion 2010 – 2015.
http://www.mess.gouv.qc.ca/publications/pdf/ADMIN_Plan_de_lutte_2010-2015_en.pdf. Accessed 27 Dec 2011.
31
B.C. Poverty Reduction Coalition. National Plans.
32
ibid
33
A Living Wage for Families. Municipalities and the Living Wage. http://livingwageforfamilies.ca/?page_id=9. Accessed 27 Dec 2011.
34
ACORN Canada. The link: Surrey Council Needs to Endorse New Westminster’s Living Wage Policy.
http://www.acorncanada.org/new-westminster-living-wage. Accessed 27 Dec 2011.
35
Food and Agriculture Organization of the United Nations. Global Food Losses and Food Waste 2011.
http://www.fao.org/fileadmin/user_upload/ags/publications/GFL_web.pdf. Accessed 5 Nov 2011.
36
Metro Vancouver. Regional Food System Strategy, February 2011.
http://www.metrovancouver.org/planning/development/AgricultureAndFood/Documents/RegionalFoodSystemStrategy.pdf. Accessed 27 Dec 2011.
37
Kamloops Food Policy Council. http://lookkamloops.ca/kamloops_food_policy_council.htm. Accessed 27 Dec 2011.
38
Interior Health Community Food Action Initiative. Project Overview and Kamloops Food Action Plan, September 2006.
http://kamloopsfoodpolicycouncil.com/wp-content/uploads/2010/04/Kamloops_Food_Plan1.pdf. Accessed 27 Dec 2011.
39
Farm to School Program. What is Farm to School. http://www.phabc.org/modules.php?name=Farmtoschool&pa=showpage&pid=11. Accessed 6 Feb 2011.
40
Ivanova, Iglika. Cost of Poverty in BC Report, July 2011.
41
Iglika, Ivanova, and Klein, Seth. Working for a Living Wage, March 2011. Canadian Centre for Policy Alternatives, BC Office.
http://www.policyalternatives.ca/livingwage2011. Accessed 5 Nov 2011.
42
ibid
43
Ottem, Andrea. Healthy Eating and Food Security. Promising Strategies for BC, April 2010. Dietitians of Canada.
http://www.dietitians.ca/Downloadable-Content/Public/Healthy-Eating-and-Food-Security-Strategies-BC.aspx. Accessed 27 Dec 2011.
44
Food and Agriculture Organization of the United Nations. Global Food Losses and Food Waste 2011.
45
Riches, Graham. Why Governments Can Safely Ignore Hunger, February 1, 2011. Canadian Centre for Policy Alternatives – National Office.
http://www.policyalternatives.ca/publications/monitor/why-governments-can-safely-ignore-hunger. Accessed 5 Nov 2011.
46
A Seat at The Table: Resource guide for local governments to promote food secure communities, June 2008. Provincial Health Services Association.
http://www.healbc.ca/files/PHSA_report_-_a_seat_at_the_table_(4).pdf. Accessed 22 Jan 2012.
47
ibid
48
Ottem, Andrea. Healthy Eating and Food Security. Promising Strategies for BC, April 2010.
49
First Call: BC Child and Youth Advocacy Coalition. BC Campaign 2000. 2011 Child Poverty Report Card, November 2011.
50
Government of Quebec. Quebec’s Combat Against Poverty. Government Action Plan for Solidarity and Social Inclusion 2010 – 2015.
http://www.mess.gouv.qc.ca/publications/pdf/ADMIN_Plan_de_lutte_2010-2015_en.pdf. Accessed 27 Dec 2011.
15THIS REPORT IS ENDORSED BY
ACORN Canada
BC Association of Social Workers
BC Coalition of People with Disabilities
BC Food Systems Network
BC Healthy Living Alliance
BC Poverty Reduction Coalition
Canada Without Poverty
Canadian Cancer Society of BC and Yukon
Canadian Centre for Policy Alternatives - BC Office
Canadian Diabetes Association - Western Canada
Farm Folk City Folk
First Call, BC Child and Youth Advocacy Coalition
Health Officers Council of BC
Heart and Stroke Foundation BC & Yukon
Public Health Association of BC
Raise the Rates
The Coalition of Child Care Advocates of BC (CCCABC)
United Way of the Lower Mainland
Vibrant Abbotsford
©Dietitians of Canada 2012
This report is published by Dietitians of Canada BC Region. The publishers gratefully acknowledge the members of the Cost of Eating in BC Committee for their
vision; the dietitians, health authority staff and volunteers throughout the province who contributed to data collection; the grocery stores that allowed food
costing on their premises; the Provincial Health Services Authority for technical assistance provided in analyzing the costing data; and At the Table Nutrition
Consulting Inc for data analysis and writing of this report. Without the significant efforts of these many people this work could not be done.
A copy of this report and previous reports can be downloaded from Dietitians of Canada at www.dietitians.ca/bccostofeating. Permission is granted to
reproduce copies of the report in its entirety for personal or educational purposes, provided credit to the publishers is included.You can also read