Predicting Disease Transmission from Geo-Tagged Micro-Blog Data
←
→
Page content transcription
If your browser does not render page correctly, please read the page content below

Predicting Disease Transmission from Geo-Tagged Micro-Blog Data

              Adam Sadilek                                   Henry Kautz                         Vincent Silenzio
      Department of Computer Science               Department of Computer Science         School of Medicine and Dentistry
          University of Rochester                      University of Rochester                 University of Rochester
           Rochester, NY 14627                          Rochester, NY 14627                     Rochester, NY 14627
         sadilek@cs.rochester.edu                      kautz@cs.rochester.edu                v.m.silenzio@rochester.edu

                           Abstract                                  dynamic properties of participants in large real-world so-
                                                                     cial networks. We begin by building upon previous work on
  Researchers have begun to mine social network data in order        classification of health-related text messages (Culotta 2010;
  to predict a variety of social, economic, and health related       Paul and Dredze 2011a; Sadilek, Kautz, and Silenzio 2012),
  phenomena. While previous work has focused on predict-
                                                                     to learn a robust SVM classifier that infers the health state of
  ing aggregate properties, such as the prevalence of seasonal
  influenza in a given country, we consider the task of fine-        a person based on the content of his tweets. We then learn a
  grained prediction of the health of specific people from noisy     conditional random field (CRF) model that predicts an indi-
  and incomplete data. We construct a probabilistic model that       vidual’s health status, using features derived from the tweets
  can predict if and when an individual will fall ill with high      and locations of other people. Performance of the CRF is
  precision and good recall on the basis of his social ties and      significantly enhanced by including features that are not
  co-locations with other people, as revealed by their Twitter       only based on the health status of friends, but are also based
  posts. Our model is highly scalable and can be used to pre-        on the estimated encounters with already sick, symptomatic
  dict general dynamic properties of individuals in large real-      individuals in the dataset, including non-friends. Thus, the
  world social networks. These results provide a foundation for      model is able to capture the role of location in the spread
  research on fundamental questions of public health, including
                                                                     of an infectious disease, the impact of the duration of co-
  the identification of non-cooperative disease carriers (“Ty-
  phoid Marys”), adaptive vaccination policies, and our under-       location on disease transmission, as well as the delay be-
  standing of the emergence of global epidemics from day-to-         tween a contagion event and the onset of the symptoms. Us-
  day interpersonal interactions.                                    ing the Viterbi algorithm to infer the most likely sequence
                                                                     of a subject’s health states over time, we are able to predict
                                                                     the days a person is ill with 0.94 precision and 0.18 recall.
                       Introduction                                  These results far outperform alternative models.
Recent work has demonstrated that micro-blogging data can               This work is an important step towards the development
be used to predict a variety of phenomena, including movie           of automated methods that identify disease vectors, trace the
box-office revenues (Asur and Huberman 2010), elections              transmission between concrete individuals, and ultimately
(Tumasjan et al. 2010), and flu epidemics (Lampos, De Bie,           help us understand and predict the spread of infectious dis-
and Cristianini 2010). Most research to date has focused on          eases with fine granularity. It provides a foundation for
predicting aggregate properties of the population from the           research on fundamental questions of public health, such
activity of the bloggers. A different kind of problem one can        as: How does an epidemic on a population scale emerge
pose, however, is to predict the behavior or state of particu-       from low-level interactions between people in the course
lar individuals within the social network. For instance, one         of their everyday lives? Can we identify a potentially non-
could try to predict whether a person will go to a movie or          cooperative individual who is a vector of a dangerous dis-
vote for a particular candidate based on micro-blog data. The        ease, i.e., a “Typhoid Mary”? What is the interaction be-
individual’s own data may or may not be accessible. At one           tween friendship, location, and co-location in the spread of
extreme, the task is to predict his behavior or state by con-        communicable diseases?
sidering only data from other people. For example, Sadilek,             Our results also prove useful for deploying sickness pre-
Kautz, and Bigham (2012) show that a person’s location can           vention resources, and for applications that help an individ-
be predicted with a high degree of accuracy based on only            ual maintain his or her health. For example, a person pre-
the geo-tagged posts (a.k.a. tweets) of his friends on Twitter.      dicted to be at high risk of the flu could be specifically en-
   This paper explores fine-grained prediction of the health         couraged to get the flu vaccine, and recommendations can be
of individuals on the basis of such social network data—             made about which places pose a high risk of getting infected.
an important instance of the general problem of modeling             Finally, the kinds of models we explore are not limited to the
                                                                     health domain. The close relationship between the spread of
Copyright c 2012, Association for the Advancement of Artificial      disease and information in general is well known (Easley
Intelligence (www.aaai.org). All rights reserved.                    and Kleinberg 2010). For example, by changing the map-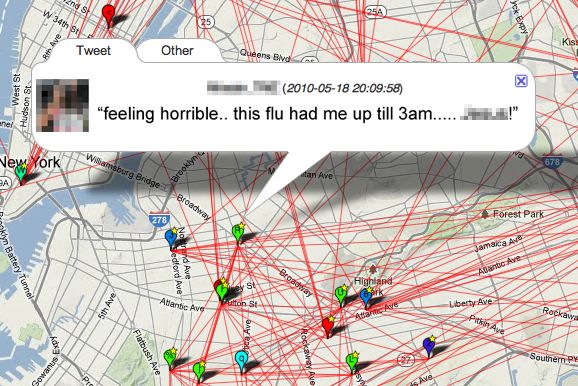
New York City Dataset
       Unique users                                  632,611
       Unique geo-active users                         6,237
       Tweets total                               15,944,084
       GPS-tagged tweets                           4,405,961
       GPS-tagged tweets by geo-active users       2,535,706
       GPS-tagged tweets by geo-active users           2,047
       that show a symptom of an illness
       Distinct visited locations                      57,109
       “Follows” relationships                        102,739
       between geo-active users
       “Friends” relationships                         31,874
       between geo-active users

Table 1: Summary statistics of the data collected from NYC. Geo-
active users are ones who geo-tag their tweets relatively frequently
(more than 100 times per month). Note that following reciprocity       Figure 1: Visualization of a sample of friends in New York City.
is about 31%, which is consistent with previous findings (Kwak et      The red links between users represent friendships, and the col-
al. 2010). The number of distinct visited locations is calculated as   ored pins show their current location on a map. We see the high-
the number of cells (100 by 100 meters) of the NYC grid that have      lighted person X complaining about her health, and hinting about
been visited by at least one geo-active individual.                    the specifics of her ailment. This work investigates to what extent
                                                                       can we predict the day-to-day health of individuals by considering
                                                                       their physical encounters and social interactions with people like
ping from text to features, the same approach can be used              X.
to model and predict the transmission of political ideas, pur-
chasing preferences, or practically any other behavioral phe-
nomena.                                                                               Methodology and Models
                                                                       Given that five of your online friends have flu-like symp-
                           The Data                                    toms, and that you have recently met eight people, possibly
Our experiments are based on data obtained from Twitter, a             strangers, who complained about having runny noses and
popular micro-blogging service where people post message               headaches, how accurately can we predict that you will soon
updates at most 140 characters long. The forced brevity en-            become ill as well? In the remainder of this paper, we pro-
courages frequent mobile updates, as we show below. Rela-              pose and evaluate a model that provides answers to such
tionships between users on Twitter are not necessarily sym-            questions across a large sample of people participating in
metric. One can follow (subscribe to receive messages from)            online social media (see Fig. 1).
a user without being followed back. When users do recipro-                In this section, we first review our method for automatic
cate following, we say they are friends on Twitter. There is           detection of Twitter messages that suggest the author con-
anecdotal evidence that Twitter friendships have a substan-            tracted an infectious disease3 (Sadilek, Kautz, and Silenzio
tial overlap with offline friendships (Gruzd, Wellman, and             2012). We then develop a CRF model that leverages the la-
Takhteyev 2011). Twitter launched in 2006 and has been ex-             beled tweets and makes accurate predictions about people’s
periencing an explosive growth since then. As of June 2011,            health state.
over 300 million accounts are registered on Twitter.
   Using the Twitter Search API1 , we collected a sample of            Detecting Illness-Related Messages
public tweets that originated from the New York City (NYC)             In order to train and evaluate a predictive model of personal
metropolitan area. The collection period was one month long            health, we first need to identify ill individuals, and estimate
and started on May 18, 2010. Using a Python script, we peri-           the time when they became contagious. We focus on self-
odically queried Twitter for all recent tweets within 100 kilo-        reported symptoms and complaints that appear in the text
meters of the NYC city center. Altogether, we have logged              of Twitter status updates. Our prior work has shown we can
nearly 16 million tweets authored by more than 630 thou-               identify them with high precision as well as high recall, even
sand unique users (see Table 1). To put these statistics in            though such messages are rare (Sadilek, Kautz, and Silenzio
context, the entire NYC metropolitan area has an estimated             2012). We achieve this by learning a linear support vector
population of 19 million people.2 Since this work studies the          machine (SVM) binary classifier Cf while directly optimiz-
effects of people’s location and co-location on disease trans-         ing the area under the ROC curve (Joachims 2005). This
mission, we concentrate on accounts that posted more than              SVM is robust even in the presence of strong class imbal-
100 GPS-tagged tweets during the one-month data collec-                ance, where for every health-related message there are more
tion period. We refer to them as geo-active users, and our             than 1,000 unrelated ones. This is a necessary precondition
dataset contains 6,237 such individuals.
                                                                          3
                                                                           In this paper, such diseases include those with symptoms that
   1
     http://search.twitter.com/api/                                    overlap with, but are not necessarily limited to, influenza-like ill-
   2
     http://www.census.gov/popest/metro/                               ness (http://en.wikipedia.org/wiki/Influenza-like illness).
Random sample of about other topics with Co from the corpus of 1.6 million
200 milion tweets
Corpus of
tweets. We further supplement the final corpus with mes-
Labeling
"other"
tweets
Cf
sages from a sample of 200 million tweets (also disjoint
Training
Training from all other corpora considered here) that Co classified
Corpus of Co
5,128 tweets Corpus of 1.6
Final
as “other” with high probability. We apply thresholding on
labeled by million machine- +
human labeled tweets
corpus the classification score to reduce the noise in the cascade, as
workers Cs
Training
Corpus
shown in Fig. 2.
Labeling of "sick"
tweets As SVM features, we use all unigram, bigram, and tri-
gram word tokens that appear in the training data. For ex-
ample, a tweet “I feel sick.” is represented by the following
Figure 2: A diagram of our cascade learning of our SVM classifier feature vector:
Cf that we use to detect tweets indicating an infectious sickness
and ! symbols denote thresholding of the
` ˘
of the author. The i, feel, sick, i feel, feel sick, i feel sick .
classification score, where we select the bottom 10% of the scores
predicted by Co (i.e., tweets that are normal with high probabil- Before tokenization, we convert all text to lower case, strip
ity), and the top 10% of scores predicted by Cs (i.e., likely “sick” punctuation and special characters, and remove mentions
tweets). of user names (the “@” tag) and re-tweets (analogous to
email forwarding). However, we do keep hashtags (such as
Positive Features Negative Features “#sick”), as those are often relevant to the author’s health
Feature Weight Feature Weight state, and are particularly useful for disambiguation of short
sick 0.9579 sick of ´0.4005 or ill-formed messages. Table 2 lists examples of significant
headache 0.5249 you ´0.3662 features found in the process of learning Cf .
flu 0.5051 lol ´0.3017 Evaluation of Cf on a held-out set shows 0.98 preci-
fever 0.3879 love ´0.1753 sion and 0.97 recall. Furthermore, the correlation between
feel 0.3451 i feel your ´0.1416 the prevalence of infectious diseases predicted by Cf and
coughing 0.2917 so sick of ´0.0887 the predictions made by Google Flu Trends specifically for
being sick 0.1919 bieber fever ´0.1026 New York City is 0.73. The official Center for Disease
better 0.1988 smoking ´0.0980 Control and Prevention data for NYC is not available with
being 0.1943 i’m sick of ´0.0894
sufficiently fine granularity, but previous work has shown
stomach 0.1703 pressure ´0.0837
and my 0.1687 massage ´0.0726
that Google’s predictions closely correspond to the offi-
infection 0.1686 i love ´0.0719 cial statistics for larger geographical areas (Ginsberg et al.
morning 0.1647 pregnant ´0.0639 2008). Google Flu Trends may have greater specificity to
“influenza-like illness”, whereas our approach may be less
Table 2: Example positively and negatively weighted significant specific, but more sensitive to detect other, related infec-
features of our SVM model Cf . tious processes exhibiting these nonspecific features in Twit-
ter content.
for further progress, as false negatives and false positives Predicting the Spread of Disease
cannot be traded-off against each other in this domain—they Human contact is the single most important factor in the
both carry equal importance. In this work, we use Cf to dis- transmission of infectious diseases (Clayton, Hills, and
tinguish between tweets indicating the author is afflicted by Pickles 1993). Since the contact is often indirect, such as
an infectious ailment (we call such tweets “sick”), and all via a doorknob, we focus on a more general notion of co-
other tweets (called “other” or “normal”). location. We consider two individuals co-located if they visit
We need to obtain sufficient amount of labeled training the same 100 by 100 meter cell within a time window (slack)
data in order to learn Cf . We do this by first training two of length T . For clarity, we show results for T “ 12 hours,
“helper” SVMs, Cs and Co , on a dataset of 5,128 tweets, but we obtained virtually identical prediction performance
each labeled as either “sick” or “other” by multiple Ama- for T P t1, . . . , 24u hours. We use the 100m threshold, as
zon Mechanical Turk workers and carefully checked by the that is the typical lower bound on the accuracy of a GPS sen-
authors. Cs is highly penalized for inducing false positives sor in obstructed areas, such as Manhattan. Since we focus
(mistakenly labeling a normal tweet as “sick”), whereas Co on geo-active individuals, we can calculate co-location with
is heavily penalized for creating false negatives (labeling high accuracy. The results below are for a condition, where
symptomatic tweets as normal). After training, we used Cs we consider a person ill up to four days after they write a
and Co to label a set of 1.6 million tweets that are likely “sick” tweet. As with the parameter T , it is important to
health-related, but contain some noise. We obtained both note that the results are consistent over a wide range of dura-
datasets from Paul and Dredze (2011a), and they are com- tion of contagiousness (from 1 to 7 days). Few diseases with
pletely disjoint from our NYC data. influenza-like symptoms are contagious for periods of time
The intuition behind this cascading process, illustrated in beyond these bounds.
Fig. 2, is to extract tweets that are with high confidence Statistical analysis of the data shows that avoiding en-
about sickness with Cs , and tweets that are almost certainly counters with infected people generally decreases yourall random variables in our model, we use a special missing
... ht −1 ht ht +1 ... value to represent unavailable data.
Before we turn to our experiments, we will discuss the
limitations that apply to any indirect method of modeling
public health.
Limitations Our observations are limited by the preva-
Ot −1 Ot Ot +1
lence of public tweets in which users talk about their health,
and by our ability to identify them in the flood of other types
of messages. Both these factors contribute to the fact that
Figure 3: This conditional random field models the health of an the number of infected individuals is systematically under-
individual over a number of days (ht ). The observations for each estimated, but evaluation of Cf suggests that the latter effect
day (ot ) include day of week, history of sick friends in the near is small. We can approximate the magnitude of this bias us-
past, the intensity of recent co-location with sick individuals, and ing the statistics presented earlier. We see that about 1 in 30
the number of such individuals encountered. residents of NYC appears in our dataset. If we strictly focus
on the geo-active individuals, the ratio is roughly 1:3,000.
However, the results in this paper indicate, that by leverag-
chances of becoming ill, whereas a large amount of con- ing the latent effects of our observations, such a sampling
tact with them makes an onset of a disease almost certain ratio is sufficient to predict the health state of a large frac-
(Sadilek, Kautz, and Silenzio 2012). We find a definite ex- tion of the users with high precision.
ponential relationship between the intensity of co-location We note that currently used methods suffer from similar
and the probability of getting ill. Similarly, by interpreting biasing effects. For example, infected people who do not
a Twitter friendship as a proxy for unobservable phenomena visit a doctor, or do not respond to surveys are virtually in-
and interactions, we see that the likelihood of becoming ill visible to the traditional methods. Similarly, efforts such as
increases as the number of infected friends grows. For ex- Google Flu Trends can only observe individuals who search
ample, having more than 5 sick friends increases one’s like- the web for certain types of content when sick. A fully com-
lihood of getting sick by a factor of 3, as compared to prior prehensive coverage of a population will require a combina-
probability, and even more with respect to the probability tion of diverse methods, and application of AI techniques—
given no sick friends. Additionally, we model the joint in- like the ones presented in this work—capable of inferring
fluence of co-location and social ties, and conclude that the the missing information.
latent impact of friendships is weaker (linear in the number
of sick friends), but nonetheless important, as some observed
patterns cannot be explained by co-location alone (Sadilek,
Experiments and Results
Kautz, and Silenzio 2012). In this section, we evaluate our approach in a number of ex-
Our goal now is to leverage the interplay of co-location perimental conditions, compare the results of our CRF mod-
and friendships to predict the health state of any individ- els with a baseline, and discuss insights gained. We perform
ual on a given day. For this purpose, we learn a dynamic 6237-fold cross-validation (the number of geo-active users),
conditional random field (CRF), a discriminative undirected where in order to make predictions for a given user, we train
graphical model (Lafferty 2001). CRFs have been success- and test the CRF while treating all other users as observed.
fully applied in a wide range of domains from language un- We report results aggregated over all cross-validation runs.
derstanding to robotics. They can systematically outperform While the structure of the CRF model remains constant
alternative approaches, such as hidden Markov models, in across our experiments, we consider two types of infer-
domains where it is unrealistic to assume that observations ence: Viterbi decoding, and the forwards-backwards algo-
are independent given the hidden state. rithm (smoothing). While the former finds the most likely
In our approach, each person X is captured by one dy- sequence of hidden variables (health states) given obser-
namic CRF model with a linear chain structure shown in vations, the latter infers each state by finding maximal
Fig. 3. Each time slice t contains one hidden binary random marginal probabilities. The tree structure of our CRF allows
variable (X is either “healthy” or “sick” on day t), and a for scalable, yet exact, learning and inference by applying
25-element vector of observed discrete random variables ot dynamic programming (Sutton and McCallum 2006), while
given by the rich temporal features capture longer-range dependen-
` ˘ cies in the data. L1 regularization is used to limit the num-
ot “ weekday, c0 , . . . , c7 , u0 , . . . , u7 , f0 , . . . , f7 ,
ber of parameters in our model. Maximum-likelihood pa-
where cn denotes the number of estimated encounters (co- rameter estimation is done via quasi-Newton method, and
locations) with sick individuals n days ago. For example, we are guaranteed to find a global optimum since the likeli-
the value of c1 indicates the number of co-location events hood function is convex.
a person had a day ago (t ´ 1), and c0 shows co-location As a baseline, we consider a model that draws its predic-
count for the current day t. Analogously, un and fn denote tions from a Bernoulli distribution with the “success” pa-
the number of unique sick individuals encountered, and the rameter p set to the prior probability of being sick learned
number of sick Twitter friends, respectively, n days ago. For from the training data.1 1
1
0.8 0.8
0.8
0.6 0.6
0.6 Precision Viterbi
Precision smoothing
0.4 0.4 Recall Viterbi
0.4 Recall smoothing
Precision baseline
0.2 0.2 0.2 Recall baseline
0 0 0
0 2 4 6 8 0 2 4 6 8 0 2 4 6 8
Number of days into the future (x) Number of days into the future (x) Number of days into the future (x)
(a) Only Friends Observed (b) Only Co-Location Observed (c) Both Observed
Figure 4: Summary of results. Each plot shows the precision and recall of our three models for predictions made with hindsight (x “ 0),
and up to 8 days into the future (x “ 8). We see that when leveraging the effect of social ties or co-locations individually (plots (a) and (b),
respectively) the CRF models perform inconsistently as we make predictions further into the future. By contrast, when considering friendships
and co-location jointly (c), the performance stabilizes and improves, achieving up to 0.94 precision and 0.18 recall (AUC of 0.85).
Fig. 4 summarizes the performance of our models that these latent events often exhibit themselves in the activ-
(Bernoulli baseline, and CRF with Viterbi and forwards- ity of the sample of people we can observe. For instance, we
backwards inference, respectively) in terms of precision and have seen that having online social ties to infected people
recall along two main dimensions. The first dimension is the significantly increases one’s chances of becoming ill in the
type of features the CRF leverges: only information about near future (Sadilek, Kautz, and Silenzio 2012). However,
sick friends (plus weekday) is observed in Fig. 4a; only co- we do not believe that the social ties themselves cause or
location (plus weekday) is leveraged in Fig. 4b; and the full even facilitate the spread of an infection. Instead, the Twit-
observation set ot is available in Fig. 4c. The second dimen- ter friendships are proxies and indicators for a complex set
sion is the time for which we make predictions, shown on of phenomena that may not be directly accessible. For ex-
the horizontal axes (x) in Fig. 4. For x “ 0, the plots show ample, friends often eat out together, meet in classes, share
the performance when inferring the most likely health state items, and travel together. While most of these events are
for the entire observation sequence (i.e., up to the present never explicitly mentioned online, they are crucial from the
day). For x ą 0, we show the precision and recall when disease transmission perspective. However, their likelihood
predicting x days into the future, where observations are not is modulated by the structure of the social ties, allowing us
available. (As described in the previous section, variables to reason about contagion.
corresponding to future observations are simply set to the
special “missing” value.) Related Work
We see that the results of our CRFs significantly outper-
Since the famous cholera study by John Snow (1855), much
form the baseline model. When leveraging the effect of so-
work has been done in capturing the mechanisms of epi-
cial ties or co-locations individually (Figs. 4a and 4b, respec-
demics. There is ample previous work in computational epi-
tively), the CRF models perform inconsistently as we make
demiology on building relatively coarse-grained models of
predictions further into the future. By contrast, when con-
disease spread via differential equations and graph theory
sidering friendships and co-location jointly, the performance
(Anderson and May 1979; Newman 2002), by harnessing
stabilizes and improves, achieving up to 0.94 precision and
simulated populations (Eubank et al. 2004), and by analysis
0.18 recall (Fig. 4c).
of official statistics (Grenfell, Bjornstad, and Kappey 2001).
In general, we see that Viterbi decoding results in bet- Such models are typically developed for the purposes of as-
ter precision and worse recall, whereas forwards-backwards sessing the impact a particular combination of an outbreak
inference yields slightly worse precision, but improves re- and a containment strategy would have on humanity or ecol-
call. The relatively low recall indicates that about 80% of ogy (Chen, David, and Kempe 2010). However, the above
infections occur without any evidence in social media as re- works focus on simulated populations and hypothetical sce-
flected in our features. For example, there are a number of narios. By contrast, we address the problem of predicting
instances of users getting ill even though they had no recent the health of real-world populations composed of individu-
encounters with sick individuals and all their friends have als embedded in a fine social structure. As a result, our work
been healthy for a long time. is a major step towards prediction of actual threats and the
Clearly, there are complex events and interactions that emergence of disease outbreaks.
take place “behind the scenes”, which are not directly In the context of social media, Krieck et al. (2011) ex-
recorded in online social media. However, this work posits plore augmenting the traditional notification channels abouta disease outbreak with data extracted from Twitter. By man-
ually examining a large number of tweets, they show that
self-reported symptoms are the most reliable signal in de-
tecting if a tweet is relevant to an outbreak or not. This is
because people often do not know what their true problem is
until diagnosed by an expert, but they can readily write about
how they feel. Researchers have also concentrated on cap-
turing the overall trend of a particular disease outbreak, typ-
ically influenza, by monitoring social media (Culotta 2010;
Lampos, De Bie, and Cristianini 2010; Chunara, Andrews,
and Brownstein 2012). Freifeld et al. (2010) use information
actively submitted by cell phone users to model aggregate
public health. However, scaling such systems poses consid-
erable challenges.
Other researchers focus on a more detailed modeling of
the language of the tweets and its relevance to public health
in general (Paul and Dredze 2011a), and to influenza surveil-
lance in particular (Collier, Son, and Nguyen 2011). Paul et Figure 5: Visualization of a sample of Twitter users (yellow pins)
al. develop a variant of topic models that captures the symp- at an airport. The highlighted person X says he will be back
toms and possible treatments for ailments, such traumatic in 16 days and mentions specific friends for whom this message
injuries and allergies, that people discuss on Twitter. In a is relevant. We immediately see the people at the airport who
follow-up work Paul and Dredze (2011b) begin to consider could have come into contact with X. This work shows that we
the geographical patterns in the prevalence of such ailments, can accurately predict the health of X from his co-location with
and show a good agreement of their models with official other individuals and the heath of his friends. However, additional
information can be inferred using methods developed by previ-
statistics and Google Flu Trends. ous work (Crandall et al. 2010; Backstrom and Leskovec 2011;
Even the state of the art systems suffer from two major Cho, Myers, and Leskovec 2011; Sadilek, Kautz, and Bigham
drawbacks. First, they produce only coarse, aggregate statis- 2012). It can be expected that putting all this information together
tics, such as the expected number of people afflicted by flu in will yield even stronger and more comprehensive predictions about
Texas. Furthermore, they often perform mere passive mon- the spread of an infection.
itoring, and prediction is severely limited by the low res-
olution of the aggregate approach, or by scalability issues.
shows that by far the most effective way to fight an epi-
By contrast, the primary contribution of this paper is a fine-
demic in urban areas is to quickly confine infected individ-
grained analysis of the interplay among human mobility, so-
uals to their homes. However, this strategy is truly effective
cial structure, and disease transmission. Our framework al-
only when applied early on in the outbreak. The speed of
lows us to make predictions about likely events of contagion
targeted vaccination ranks second in effectiveness. This pa-
between specific individuals without active user participa-
per shows that finding some of these key symptomatic indi-
tion.
viduals, along with other people that may have already con-
tracted the disease, can be done effectively and in a timely
Conclusions and Future Work manner through social media.
This work is the first to take on prediction of the spread of In future work, we will focus on larger geographical ar-
infectious diseases throughout a real-world population with eas (including airplane travel), while maintaining the same
fine granularity. We focus on self-reported symptoms that level of detail (i.e., social ties between concerete individuals
appear in people’s Twitter status updates, and show that al- and their fine-grained location). This will allow us to model
though such messages are rare, we can identify them with and predict the emergence of global epidemics from the day-
systematically high precision and high recall. to-day interactions of individuals, and subsequently answer
The key contribution of this work is a scalable probabilis- questions such as “How did the current flu epidemic in city
tic model that demonstrates that the health of a person can A start and where did it come from?” and “How likely I am
be accurately inferred from her location and social interac- to catch a cold if I visit the mall?”
tions observed via social media. Furthermore, we show that For example, Fig. 5 illustrates an instance in our dataset,
future health states can be predicted with consistently high where a sick person at an airport posts a message, and we can
accuracy more than a week into the future. For example, over see other people nearby with whom he could have come into
10% of cases of sickness are predicted with 90% confidence contact. Prior work has developed a repertoire of powerful
even a week before they occur. For predictions one day into AI techniques for revealing hidden social ties and predicting
the future, our model covers almost 20% of cases with the user location—two features heavily leveraged by our pub-
same confidence. lic health model. Therefore, there are opportunities for great
An early identification of infected individuals is espe- synergy in these areas.
cially crucial in preventing and containing devastating dis- Finally, while this paper concentrates on “traditional” in-
ease outbreaks. Important work by Eubank et al. (2004) fectious diseases, such as flu, similar techniques can be ap-plied to study mental health disorders, such as depression, Freifeld, C.; Chunara, R.; Mekaru, S.; Chan, E.; Kass-Hout,
that have strong contagion patterns as well. T.; Iacucci, A.; and Brownstein, J. 2010. Participatory
epidemiology: use of mobile phones for community-based
Acknowledgements health reporting. PLoS medicine 7(12):e1000376.
We thank Michael Paul for providing his datasets; and Wal- Ginsberg, J.; Mohebbi, M.; Patel, R.; Brammer, L.; Smolin-
ter Lasecki and Wendy Beatty for their insightful com- ski, M.; and Brilliant, L. 2008. Detecting influenza
ments. This research was partly funded by ARO grant epidemics using search engine query data. Nature
W911NF-08-1-0242, ONR grant N00014-11-10417, OSD 457(7232):1012–1014.
grant W81XWH-08-C0740, and a gift from the Kodak Com- Grenfell, B.; Bjornstad, O.; and Kappey, J. 2001. Travelling
pany. The views and conclusions contained in this document waves and spatial hierarchies in measles epidemics. Nature
are those of the authors and should not be interpreted as nec- 414(6865):716–723.
essarily representing the official policies, either expressed or Gruzd, A.; Wellman, B.; and Takhteyev, Y. 2011. Imagining
implied, of any of these organizations. Twitter as an imagined community. In American Behavioral
Scientist, Special issue on Imagined Communities.
References Joachims, T. 2005. A support vector method for multivariate
Anderson, R., and May, R. 1979. Population biology of performance measures. In ICML 2005, 377–384. ACM.
infectious diseases: Part I. Nature 280(5721):361. Krieck, M.; Dreesman, J.; Otrusina, L.; and Denecke, K.
Asur, S., and Huberman, B. 2010. Predicting the future 2011. A new age of public health: Identifying disease out-
with social media. In Web Intelligence and Intelligent Agent breaks by analyzing tweets. Proceedings of Health Web-
Technology (WI-IAT), 2010 IEEE/WIC/ACM International Science Workshop, ACM Web Science Conference.
Conference on, volume 1, 492–499. IEEE. Kwak, H.; Lee, C.; Park, H.; and Moon, S. 2010. What is
Backstrom, L., and Leskovec, J. 2011. Supervised ran- Twitter, a Social Network or a News Media? In WWW.
dom walks: predicting and recommending links in social Lafferty, J. 2001. Conditional random fields: Probabilistic
networks. In WSDM 2011, 635–644. ACM. models for segmenting and labeling sequence data. In In-
Chen, P.; David, M.; and Kempe, D. 2010. Better vaccina- ternational Conference on Machine Learning (ICML), 282–
tion strategies for better people. In Proceedings of the 11th 289. Morgan Kaufmann.
ACM conference on Electronic commerce, 179–188. ACM. Lampos, V.; De Bie, T.; and Cristianini, N. 2010. Flu
Cho, E.; Myers, S. A.; and Leskovec, J. 2011. Friendship detector-tracking epidemics on Twitter. Machine Learning
and mobility: User movement in location-based social net- and Knowledge Discovery in Databases 599–602.
works. ACM SIGKDD International Conference on Knowl- Newman, M. 2002. Spread of epidemic disease on networks.
edge Discovery and Data Mining (KDD). Physical Review E 66(1):016128.
Chunara, R.; Andrews, J.; and Brownstein, J. 2012. Social Paul, M., and Dredze, M. 2011a. A model for mining public
and news media enable estimation of epidemiological pat- health topics from Twitter. Technical Report. Johns Hopkins
terns early in the 2010 Haitian cholera outbreak. The Ameri- University. 2011.
can Journal of Tropical Medicine and Hygiene 86(1):39–45. Paul, M., and Dredze, M. 2011b. You are what you tweet:
Clayton, D.; Hills, M.; and Pickles, A. 1993. Statistical Analyzing Twitter for public health. In Fifth International
models in epidemiology, volume 41. Oxford university press AAAI Conference on Weblogs and Social Media.
Oxford. Sadilek, A.; Kautz, H.; and Bigham, J. P. 2012. Finding your
Collier, N.; Son, N.; and Nguyen, N. 2011. OMG U got friends and following them to where you are. In Fifth ACM
flu? Analysis of shared health messages for bio-surveillance. International Conference on Web Search and Data Mining.
Journal of Biomedical Semantics. (Best Paper Award).
Crandall, D.; Backstrom, L.; Cosley, D.; Suri, S.; Hutten- Sadilek, A.; Kautz, H.; and Silenzio, V. 2012. Model-
locher, D.; and Kleinberg, J. 2010. Inferring social ties ing spread of disease from social interactions. In Sixth
from geographic coincidences. Proceedings of the National AAAI International Conference on Weblogs and Social Me-
Academy of Sciences 107(52):22436. dia (ICWSM).
Culotta, A. 2010. Towards detecting influenza epidemics Snow, J. 1855. On the mode of communication of cholera.
by analyzing Twitter messages. In Proceedings of the First John Churchill.
Workshop on Social Media Analytics, 115–122. ACM. Sutton, C., and McCallum, A. 2006. An introduction to con-
ditional random fields for relational learning. Introduction
Easley, D., and Kleinberg, J. 2010. Networks, Crowds,
to statistical relational learning. MIT Press.
and Markets: Reasoning About a Highly Connected World.
Cambridge University Press. Tumasjan, A.; Sprenger, T.; Sandner, P.; and Welpe, I. 2010.
Predicting elections with Twitter: What 140 characters re-
Eubank, S.; Guclu, H.; Anil Kumar, V.; Marathe, M.; Srini-
veal about political sentiment. In Proceedings of the Fourth
vasan, A.; Toroczkai, Z.; and Wang, N. 2004. Modelling
International AAAI Conference on Weblogs and Social Me-
disease outbreaks in realistic urban social networks. Nature
dia, 178–185.
429(6988):180–184.You can also read