TEMPORAL AND LOCATION VARIATIONS, AND LINK CATEGORIES FOR THE DISSEMINATION OF COVID-19-RELATED INFORMATION ON TWITTER DURING THE SARS-COV-2 ...
←
→
Page content transcription
If your browser does not render page correctly, please read the page content below
JOURNAL OF MEDICAL INTERNET RESEARCH                                                                                                 Pobiruchin et al

     Original Paper

     Temporal and Location Variations, and Link Categories for the
     Dissemination of COVID-19–Related Information on Twitter During
     the SARS-CoV-2 Outbreak in Europe: Infoveillance Study

     Monika Pobiruchin1,2*, Dr Sc Hum; Richard Zowalla2,3,4*, MSc; Martin Wiesner2,3*, Dipl Inform Med
     1
      GECKO Institute for Medicine, Informatics & Economics, Heilbronn University, Heilbronn, Germany
     2
      Consumer Health Informatics SIG, German Association for Medical Informatics, Biometry & Epidemiology (GMDS e. V.), Cologne, Germany
     3
      Department of Medical Informatics, Heilbronn University, Heilbronn, Germany
     4
      Center for Machine Learning, Heilbronn University, Heilbronn, Germany
     *
      all authors contributed equally

     Corresponding Author:
     Monika Pobiruchin, Dr Sc Hum
     GECKO Institute for Medicine, Informatics & Economics
     Heilbronn University
     Max-Planck-Str 39
     Heilbronn, 74081
     Germany
     Phone: 49 7131504633
     Email: monika.pobiruchin@hs-heilbronn.de

     Abstract
     Background: The spread of the 2019 novel coronavirus disease, COVID-19, across Asia and Europe sparked a significant
     increase in public interest and media coverage, including on social media platforms such as Twitter. In this context, the origin of
     information plays a central role in the dissemination of evidence-based information about the SARS-CoV-2 virus and COVID-19.
     On February 2, 2020, the World Health Organization (WHO) constituted a “massive infodemic” and argued that this situation
     “makes it hard for people to find trustworthy sources and reliable guidance when they need it.”
     Objective: This infoveillance study, conducted during the early phase of the COVID-19 pandemic, focuses on the social media
     platform Twitter. It allows monitoring of the dynamic pandemic situation on a global scale for different aspects and topics,
     languages, as well as regions and even whole countries. Of particular interest are temporal and geographical variations of
     COVID-19–related tweets, the situation in Europe, and the categories and origin of shared external resources.
     Methods: Twitter’s Streaming application programming interface was used to filter tweets based on 16 prevalent hashtags
     related to the COVID-19 outbreak. Each tweet’s text and corresponding metadata as well as the user’s profile information were
     extracted and stored into a database. Metadata included links to external resources. A link categorization scheme—introduced in
     a study by Chew and Eysenbach in 2009—was applied onto the top 250 shared resources to analyze the relative proportion for
     each category. Moreover, temporal variations of global tweet volumes were analyzed and a specific analysis was conducted for
     the European region.
     Results: Between February 9 and April 11, 2020, a total of 21,755,802 distinct tweets were collected, posted by 4,809,842
     distinct Twitter accounts. The volume of #covid19-related tweets increased after the WHO announced the name of the new disease
     on February 11, 2020, and stabilized at the end of March at a high level. For the regional analysis, a higher tweet volume was
     observed in the vicinity of major European capitals or in densely populated areas. The most frequently shared resources originated
     from various social media platforms (ranks 1-7). The most prevalent category in the top 50 was “Mainstream or Local News.”
     For the category “Government or Public Health,” only two information sources were found in the top 50: US Centers for Disease
     Control and Prevention at rank 25 and the WHO at rank 27. The first occurrence of a prevalent scientific source was Nature (rank
     116).
     Conclusions: The naming of the disease by the WHO was a major signal to address the public audience with public health
     response via social media platforms such as Twitter. Future studies should focus on the origin and trustworthiness of shared

     http://www.jmir.org/2020/8/e19629/                                                                 J Med Internet Res 2020 | vol. 22 | iss. 8 | e19629 | p. 1
                                                                                                                      (page number not for citation purposes)
XSL• FO
RenderX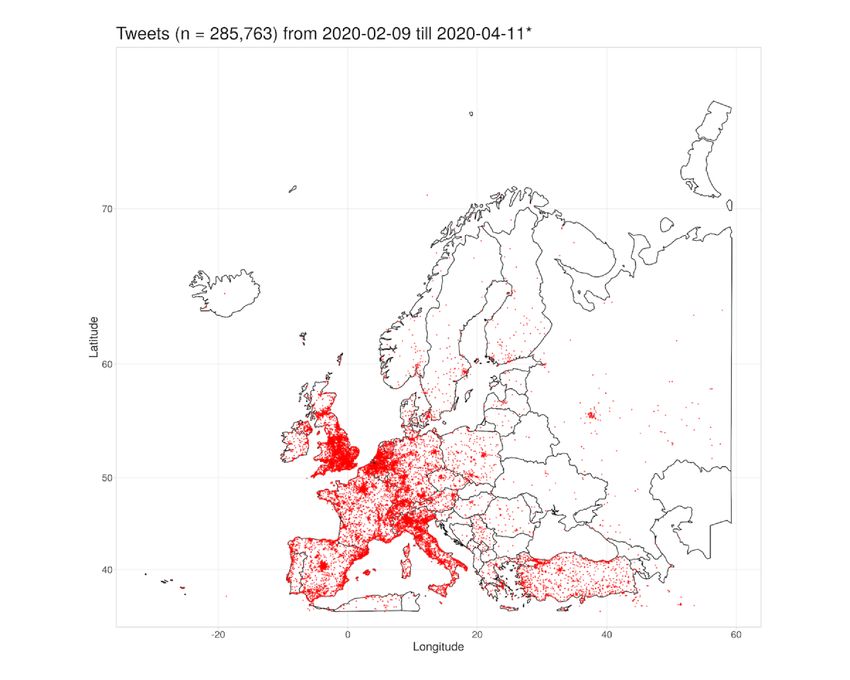
JOURNAL OF MEDICAL INTERNET RESEARCH                                                                                           Pobiruchin et al

     resources, as monitoring the spread of fake news during a pandemic situation is of particular importance. In addition, it would
     be beneficial to analyze and uncover bot networks spreading COVID-19–related misinformation.

     (J Med Internet Res 2020;22(8):e19629) doi: 10.2196/19629

     KEYWORDS
     COVID-19; SARS-CoV-2; social media; public health; Twitter; infoveillance; infodemiology; infodemic; health informatics;
     disease surveillance

                                                                          diseases-related trends, the origin of shared resources, and the
     Introduction                                                         sentiment expressed in swine flu tweets as posted via the
     Overview                                                             platform.

     The emergence of SARS-CoV-2 and the associated COVID-19              Fu et al [32] analyzed how people reacted to the Zika epidemic
     [1] was first observed and described in China [2-6]. The             in the Americas from 2015 to 2016. The authors analyzed
     subsequent spread across Asia [7] and Europe [8], including          132,033 tweets with the keyword “zika” written in the languages
     Northern Italy [9-12], in early 2020 sparked a significant           English, Spanish, and Portuguese via the Twitter application
     increase in public interest and media coverage [13] including        programming interface (API). The authors reported that the top
     on the social media platforms Weibo [14] and Twitter [15,16].        ranked shared resources originated from social media platforms
     During the following weeks, several SARS-CoV-2 infections            such as “Facebook, Instagram, Twitter, YouTube, LinkedIn,
     were reported in other European countries [17,18] including the      Tumblr, the blogging site WordPress, [...] which accounted for
     United Kingdom [19], Germany [20,21], France [22], and Spain         26% of all domains.” In the Zika study, the Centers for Disease
     [23].                                                                Control and Prevention (CDC) and the WHO amounted to
                                                                          “0.06%” and “0.05%,” respectively. This corresponded to a
     According to Merchant and Lurie [24], several aspects play an        90th and 140th rank, respectively.
     important role in coping with the COVID-19 pandemic situation,
     especially in the digital age. First, “directing people to trusted   However, people do not only share evidence-based or
     sources” stands out, and neither a vaccine or drug against           trustworthy content in social media environments [33].
     SARS-CoV-2 exists as of the time of writing. Second, the             Southwell et al [34] pointed out that misinformation and perils
     authors describe “social media as a diagnostic tool and referral     exist that can lead to a spread of incorrect information,
     system.” By monitoring related activities on different social        ambiguous meanings, and misperceptions, which can persist
     media platforms, public authorities or research institutions can     for a long period of time, and it can be resource intensive to
     gather valuable insights into regional trends, country-specific      counter misinformation “once it has enjoyed wide exposure.”
     trends, or even the global situation. Third, misinformation and      In the context of the current COVID-19 pandemic, an example
     rumors can quickly spread in a globally connected world [24,25].     of such incorrect information is the “5G conspiracy theory”
     Misbeliefs, fake news, and conspiracy theories pose a severe         [35], which led to phone masts being attacked in the United
     threat and might put people’s lives in danger [26]. In this          Kingdom [36].
     context, Merchant and Lurie [24] propose a strategy of
     “counteracting misinformation” actively. In this way, they argue     Abd-Alrazaq et al [16] analyzed the content and sentiment of
     that “enabling a culture of preparedness” could be achieved.         about 2.8 million COVID-19–related tweets retrieved via the
                                                                          Twitter standard search API written in the English language.
     In this context, the origin of information plays a central role in   They identified “four main themes: origin of the virus; its
     the dissemination of evidence-based information about the            sources; its impact on people, countries, and the economy; and
     SARS-CoV-2 virus and the associated COVID-19. On February            ways of mitigating the risk of infection” by applying topic
     2, 2020, the World Health Organization (WHO) constituted a           modelling techniques using latent Dirichlet allocation. However,
     “massive infodemic” and argued that this situation “makes it         the analysis of shared resources and temporal and geographical
     hard for people to find trustworthy sources and reliable guidance    variations of their 2.8 million tweets collection was not in the
     when they need it” [27,28].                                          focus of their study.
     Several trustworthy sources seem to be of particular interest        Aims of the Study
     [15,29]: research, public health, and government institutions,
     as well as news agencies or broadcasting companies and digital       For this infoveillance study, during the early phase of the
     or print newspapers.                                                 COVID-19 pandemic, the authors decided to focus on the social
                                                                          media platform Twitter, as the platform allows monitoring of
     Related Work                                                         the dynamic pandemic situation on a global scale in real time
     In 2009, Eysenbach [30] described the infodemiology and              for different aspects of a topic, languages, as well as regions
     infoveillance concepts as a set of “public health informatics        and even whole countries.
     methods” to “analyze search, communication and publication           In this context, the research questions (RQs) of this study were
     behavior on the Internet.” During the 2009 H1N1 flu pandemic,        as follows:
     Chew and Eysenbach [31] applied this concept for a content
     analysis of topic-related posts on Twitter in which they analyzed

     http://www.jmir.org/2020/8/e19629/                                                           J Med Internet Res 2020 | vol. 22 | iss. 8 | e19629 | p. 2
                                                                                                                (page number not for citation purposes)
XSL• FO
RenderX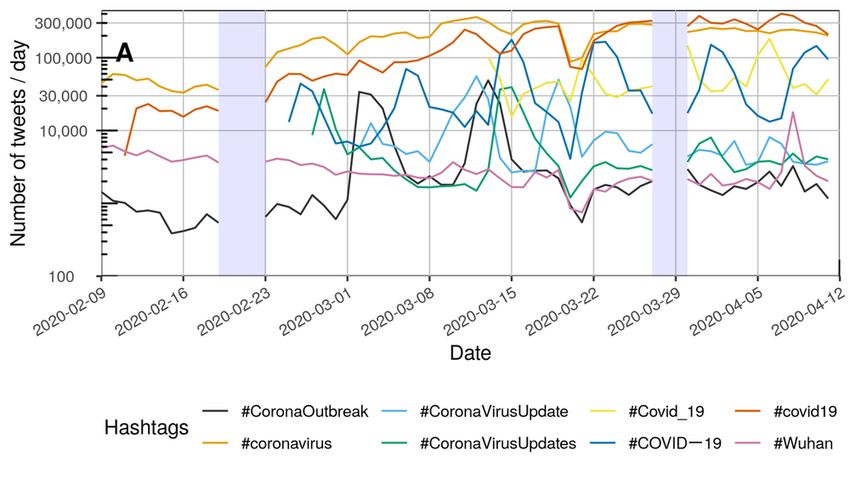
JOURNAL OF MEDICAL INTERNET RESEARCH                                                                                           Pobiruchin et al

     1.   What      tweet    volume      was    observed      among       and media coverage in January 2020, eight hashtags were
          COVID-19–related hashtags at the beginning of the               initially included for collecting tweets beginning on February
          pandemic before and after the WHO announced the name            9, 2020. In late February and at the beginning of March 2020,
          of the disease?                                                 several other hashtags were increasingly used and, therefore,
     2.   How did information on COVID-19 and its associated              included in the study setting (see Multimedia Appendix 1). The
          impact spread during the epidemic situation in Europe from      special European focus was initiated by monitoring the
          early February to early April 2020?                             worsening of the severe SARS-CoV-2 outbreak in the Northern
     3.   What proportion of information originates from public           Italian regions Lombardy and Emilia Romagna [10,11,37]. For
          institutions, media channels, and scientific journals, and      this reason, the authors decided to add the two Italy-specific
          which channels stand out?                                       hashtags #coronavirusitaly and #coronavirusitalia that were
                                                                          prevalent around the third week of February 2020, as reported
     To the best of the authors’ knowledge, no similar COVID-19
                                                                          by Twitter trends at that time.
     study has been conducted on a comparable scale.
                                                                          In total, 16 hashtags were selected for collecting
     Methods                                                              COVID-19–related tweets for the purpose of temporal,
                                                                          geolocation, and link category analyses.
     Study Design
                                                                          Data Acquisition
     This infoveillance study on the use of hashtags in the early onset
     of SARS-CoV-2 in the European countries consists of three            Twitter Data
     stages. First, to answer RQ1, tweets with SARS-CoV-2– and            For this study, tweets were collected between February 9
     COVID-19–related hashtags were collected. An analysis of             (midnight Central European Summer Time [CEST]) and April
     which hashtags were used depending on 7-day intervals was            11 (11:59 PM CEST), 2020, using the “Filter realtime Tweets”
     conducted after the WHO announcement that named the disease          endpoint of the Twitter Streaming API [38] via the Java library
     on February 11, 2020. Second, based on the given geolocation         Twitter4J [39] with the “standard” access level. To build the
     information, the number of tweets from the European countries        related filter query, the aforementioned hashtags (see Study
     and their variations in time were analyzed (RQ2). Third,             Setting) were connected using the OR operator. Matching tweets
     European tweets with online resources (ie, URL information)          were then processed by a self-implemented software framework
     were extracted. The target of the URL was examined to                written in Java (Oracle Corporation). Duplicate tweets as well
     determine its origin (eg, news agency, government institution,       as retweets were removed in this process. A tweet’s text, its
     social media).                                                       metadata (eg, URLs appended to a tweet), as well as the user’s
     Study Setting                                                        profile information were extracted. The results were then stored
                                                                          in a PostgreSQL in v10.12 [40]. The processing workflow is
     In the early onset of the SARS-CoV-2 epidemic, several
                                                                          depicted in Figure 1.
     hashtags emerged worldwide. Based on the global Twitter trends

     http://www.jmir.org/2020/8/e19629/                                                           J Med Internet Res 2020 | vol. 22 | iss. 8 | e19629 | p. 3
                                                                                                                (page number not for citation purposes)
XSL• FO
RenderX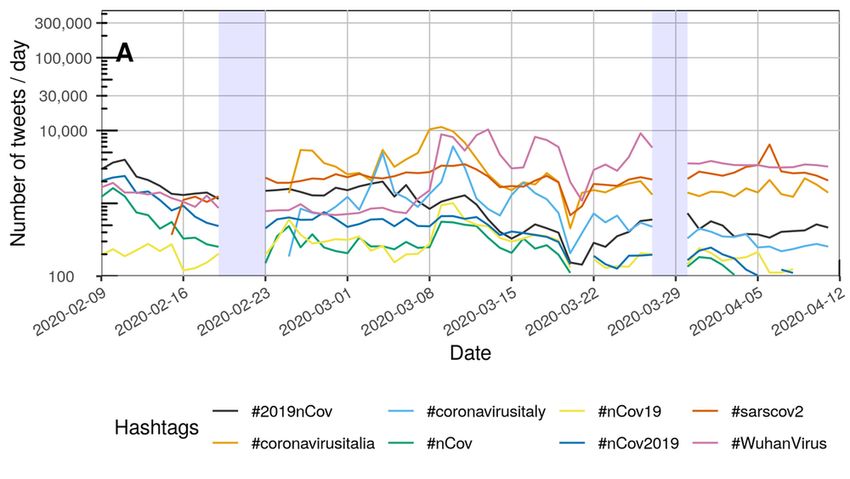
JOURNAL OF MEDICAL INTERNET RESEARCH                                                                                                      Pobiruchin et al

     Figure 1. Workflow of the processing steps and involved software components: lines with arrows indicate processing workflow for each tweet t returned
     by the Twitter streaming API under the given hashtags included in this study. Each t was processed in parallel by the analysis framework to reach
     high-throughput processing for the large volume of COVID-19–related tweets. API: application programming interface.

                                                                                 left as originally captured via our analysis framework (see Figure
     Twitter Analysis                                                            1). Next, domain aggregation was applied on each unique URL
     In the context of this study, a tweet contains at least one of the          [43] (ie, “https://mhealth.jmir.org/” becomes “jmir.org”). The
     16 hashtags ([a] to [p] in Multimedia Appendix 1) as described              domain aggregation was conducted by a self-implemented
     in the section Study Setting. All analyses were conducted based             software written in Java using the public suffix list provided by
     on these hashtags. Additionally, detected hashtags mentioned                the Mozilla Foundation [44]. This transformation was conducted
     in a specific tweet were not considered.                                    on a Ubuntu 18.04 LTS 64-bit computer running Java 11.0.7
     Twitter provides geographic information of a Twitter user’s                 on April 22, 2020.
     location (ie, latitude φ and longitude λ) [41]. According to the            The most prevalent (n=250) domain-aggregated URLs
     Twitter API, such geographic information can either be an exact             associated with a web site, as shared by Twitter users, were
     point location or a bounding box (ie, a larger area or an entire            categorized according to the categories introduced by Chew
     region). Given such a bounding box, our analysis framework                  and Eysenbach [31] in 2010. The category “No Reference” was
     computed the geometric center of it and used this information               not considered, as only tweets containing at least one URL were
     as a point location.                                                        included in the link category analysis. Two additional categories
     However, Twitter users can deactivate sharing of their location             with respect to RQ3 were introduced: (1) “Scientific resource”
     information. If the geographic information was given, we                    (eg, journal, magazine, preprint servers, or university provided
     leveraged this information to plot tweet locations on a map. The            COVID-19 dashboard) and (2) “URL Shortener.”
     authors defined the European area with geographical limits                  The categorization was conducted manually by all three authors
     ranging from 34.839°
JOURNAL OF MEDICAL INTERNET RESEARCH Pobiruchin et al
Ethical Approval hashtags such as #covid19 or #COVID—19 showed constant
This article does not contain any study of human participants use and corresponding high volume.
performed by any of the authors. For this reason, no formal Many Twitter users expressed their engagement by sharing
ethical approval is required. either image or multimedia content, or URLs to external
references of which they believed provided important
Results information to other users. A quarter of the observed tweets
were posted with images, and another third provided links to
Principal Findings external references. Of these references, 1 out of 5 cross-linked
Since the emergence of the first reports of human SARS-CoV-2 to posts in social media platforms (eg, YouTube, Instagram, or
virus infections in China in late December 2019 and early Reddit). Mainstream or local news resources were shared by 1
January 2020 [5], the public interest and social media use grew out of 8 posts. References to information provided by
steadily. The volume of #covid19-related tweets increased with governmental or public health institutions and
the WHO announcement after February 11 [1] and stabilized COVID-19–related scientific resources were posted rarely (1
at the end of March at a high level. Several hashtags were used out of 100).
in the early phase of the SARS-CoV-2 outbreak, such as
#nCov2019, #nCov19, #nCov, and #2019nCov. Those earlier
Sample Characteristics
forms of referencing COVID-19 did not show substantial Between February 9 (midnight CEST) and April 11 (11:59 PM
volume after the WHO announcement. Thus, the naming of the CEST), 2020, a total of 21,755,802 distinct tweets posted under
disease was a major signal to address the public audience with the 16 hashtags were collected and stored in the study database.
a public health response via social media platforms (ie, Twitter). Those tweets were posted by 4,809,842 distinct Twitter accounts
of which 83,560 were verified by the platform itself [48]. On
The situation in Europe changed with the #coronavirus outbreak average, each tweet contained 3.18 hashtags (min=1, max=47).
in (Northern) Italy [37]. Public interest rose with climbing The most prevalent languages were identified according to
numbers of infections, as Italy became a hot spot of the Twitter’s language classification [49] and are listed in Table 1.
epidemiological situation on the European continent.
Country-specific hashtags were used to report on the Italian Of the 21,755,802 tweets, 25.78% (n=5,608,189) of tweets used
situation, and with the spread of the disease in Europe, users in (animated) images. Likewise, 4.95% (n=1,076,180) of all posts
other countries engaged with their individual hashtags such as shared multimedia material (ie, videos). In total, 7,753,841
#coronavirusES (Spain), #coronaFrance (France), and (34.16%) posts shared external resources. On average, a tweet
#coronavirusDeutschland (Germany). Nevertheless, neutral referencing an external URL contained 1.04 URLs (min=1,
max=10).
Table 1. Language distribution of the study sample.
Rank Language Observations (n=21,755,802), n (%)
1 English 11,829,991 (54.38)
2 Spanish 3,037,910 (13.96)
3 Undefined 1,325,729 (6.09)
4 French 1,246,211 (5.73)
5 Italian 898,979 (4.13)
6 Turkish 493,155 (2.27)
7 German 446,502 (2.05)
8 Portuguese 310,332 (1.43)
9 Indonesian 242,068 (1.11)
10 Hindi 228,966 (1.05)
11 Thai 227,665 (1.05)
12 Japanese 220,032 (1.01)
13 Arabic 195,541 (0.90)
14 Dutch 178,768 (0.82)
15 Catalan 155,535 (0.71)
≥16 Other 718,418 (3.30)
http://www.jmir.org/2020/8/e19629/ J Med Internet Res 2020 | vol. 22 | iss. 8 | e19629 | p. 5
(page number not for citation purposes)
XSL• FO
RenderXJOURNAL OF MEDICAL INTERNET RESEARCH Pobiruchin et al
Twitter Analysis Figures 2 and 3 each depict the number of tweets per day that
contained at least one of the COVID-19–related hashtags.
Temporal Variations of Tweets
Overall, the number of daily tweets rose during the study period.
The total number of occurrences for each hashtag is presented
The use of #covid19 increased throughout February and March.
in Table 2. The data shows a heterogeneous distribution of
The trend was similar to the use of #coronavirus. However, the
hashtag volume. The hashtags #WuhanVirus and #Wuhan were
use of the hashtag #COVID—19 was fluctuating periodically.
less frequently used than more generic hashtags such as
Similar peaks in usage could be detected for #Covid_19.
#covid19. The four top hashtags in the study database represent
Multimedia Appendix 2 provides a complete list of all depictions
93.98% (24,203,025/25,754,619) of all hashtags mentioned: (1)
of temporal variations for each hashtag separately.
#coronavirus, (2) #covid19, (3) #COVID—19, and (4)
#Covid_19.
Table 2. Number of tweets per hashtag in ranked order within 7-day intervals.
Feb 9, Feb 16a, Feb 23, Mar 1, Mar 8, Mar 15, Mar 22b, Mar 29b, Apr 5, Total,
Rank Hashtag n (%) n (%) n (%) n (%) n (%) n (%) n (%) n (%) n (%) n (%)
1 #coronavirus 337,478 159,013 1,000,498 1,287,233 2,057,022 1,609,870 1,537,502 1,553,761 1,587,109 11,129,486
(65.91) (57.32) (61.89) (56.53) (51.46) (42.35) (38.20) (34.30) (32.42) (42.92)
2 #covid19 84,892 79,568 354,548 553,564 1,114,486 1,263,151 1,599,310 1,972,964 2,130,548 9,153,031
(16.58) (28.68) (21.93) (24.31) (27.88) (33.23) (39.73) (43.55) (43.52) (35.30)
3 #COVID—19 —c — 113,479 177,572 209,752 354,910 515,987 415,712 472,185 2,259,597
(7.02) (7.80) (5.25) (9.34) (12.82) (9.18) (9.65) (8.71)
4 #Covid_19 — — — — 152,901 297,663 230,274 443,837 536,257 1,660,932
(3.83) (7.83) (5.72) (9.80) (10.95) (6.40)
5 #CoronaVirusUpdate — — — 40,835 144,616 102,272 42,775 31,607 32,773 394,878
(1.79) (3.62) (2.69) (1.06) (0.70) (0.67) (1.52)
6 #CoronaVirusUpdates — — 56,143 25,440 47,877 76,200 19,024 29,460 27,665 281,809
(3.47) (1.12) (1.20) (2.00) (0.47) (0.65) (0.57) (1.09)
7 #CoronaOutbreak 6237 2305 6070 96,691 105,210 16,081 10,052 11,611 14,131 268,388
(1.22) (0.83) (0.38) (4.25) (2.63) (0.42) (0.25) (0.26) (0.29) (1.03)
8 #Wuhan 35,142 17,230 24,242 17,421 19,081 12,770 11,467 13,648 31,707 182,708
(6.86) (6.21) (1.50) (0.77) (0.48) (0.34) (0.28) (0.30) (0.65) (0.70)
9 #WuhanVirus 10,301 4301 5522 5825 47,418 30,699 28,420 22,942 22,690 178,118
(2.01) (1.55) (0.34) (0.26) (1.19) (0.81) (0.71) (0.51) (0.46) (0.69)
10 #coronavirusitalia — — 18,838 24,697 46,517 11,694 9828 9167 11,499 132,240
(1.17) (1.08) (1.16) (0.31) (0.24) (0.20) (0.23) (0.51)
11 #sarscov2 369 4881 14,964 16,913 19,615 11,400 11,915 16,710 22,215 118,982
(0.07) (1.76) (0.93) (0.74) (0.49) (0.30) (0.30) (0.37) (0.45) (0.46)
12 #2019nCov 18,041 5496 10,226 11,172 6330 2389 2471 3167 2939 62,231
(3.52) (1.98) (0.63) (0.49) (0.16) (0.06) (0.06) (0.07) (0.06) (0.24)
13 #coronavirusitaly — — 3379 12,238 15,137 7082 3391 2562 1750 45,539
(0.21) (0.54) (0.38) (0.19) (0.08) (0.06) (0.04) (0.18)
14 #nCov2019 11,426 2718 4255 3799 3951 2053 1043 1206 727 31,178
(2.23) (0.98) (0.26) (0.17) (0.10) (0.05) (0.03) (0.03) (0.01) (0.12)
15 #nCov 6536 1265 2086 1831 2935 1385 565 856 535 17,994
(1.28) (0.46) (0.13) (0.08) (0.07) (0.04) (0.01) (0.02) (0.01) (0.07)
16 #nCov19 1618 645 2382 1707 4151 1893 979 1166 768 15,309
(0.32) (0.23) (0.15) (0.07) (0.10) (0.05) (0.02) (0.03) (0.02) (0.06)
Total N/Ad 512,040 277,422 1,616,632 2,276,938 3,996,999 3,801,512 4,025,003 4,530,376 4,895,498 25,932,420
(1.97) (1.07) (6.23) (8.78) (15.41) (14.66) (15.52) (17.47) (18.88) (100.00)
a
During this 7-day interval technical issues occurred for approximately 3 days.
b
During this 7-day interval technical issues occurred for approximately 1 day.
c
No data available.
d
N/A: not applicable.
http://www.jmir.org/2020/8/e19629/ J Med Internet Res 2020 | vol. 22 | iss. 8 | e19629 | p. 6
(page number not for citation purposes)
XSL• FO
RenderXJOURNAL OF MEDICAL INTERNET RESEARCH Pobiruchin et al
Figure 2. Number of tweets per day for the hashtags ranked 1-8 (see Table 2) between February 9, 2020, and April 11, 2020, on a logarithmic scale.
The capital letter "A" represents the naming of the disease by the World Health Organization on February 11, 2020. Blue rectangles: No tweets were
collected between February 20 and 22 as well as between March 28 and 29 due to technical issues.
Figure 3. Number of tweets per day for the hashtags ranked 9-16 (see Table 2) between February 9, 2020, and April 11, 2020, on a logarithmic scale.
The capital letter "A" represents the naming of the disease by the World Health Organization on February 11, 2020. Blue rectangles: No tweets were
collected between February 20 and 22 as well as between March 28 and 29 due to technical issues.
latitude information were available for 4.40%
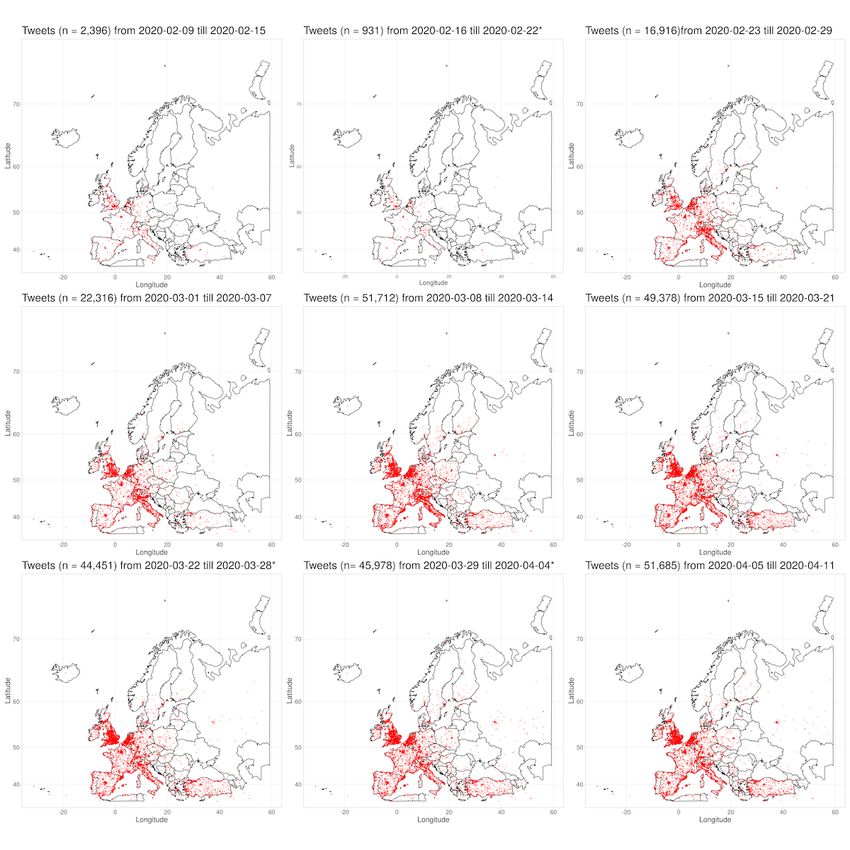
Geographical Variations of Tweets (957,947/21,755,802) of the tweets in the study database; filtered
In the beginning of February 2020, the SARS-CoV-2 epidemic for the longitude and latitude representing the geographical
spread over Europe. The northern regions of Italy especially borders of Europe, 29.83% (285,763/957,947) of tweets
had a massive outbreak of COVID-19 [9]. To investigate the qualified. Each tweet was plotted in a geographical map of
tweets’ volume spread, all tweets that contained geographic
coordinates were included in this subanalysis. Longitude and
http://www.jmir.org/2020/8/e19629/ J Med Internet Res 2020 | vol. 22 | iss. 8 | e19629 | p. 7
(page number not for citation purposes)
XSL• FO
RenderXJOURNAL OF MEDICAL INTERNET RESEARCH Pobiruchin et al
Europe for each 7-day interval in the observation period (see geolocation information for the European continent. More tweets
Figure 4). could be observed in the vicinity of countries’ capitals (eg, Paris,
Madrid, Vienna, or Berlin) or in densely populated areas such
For an animated video that covers the observation period
as the Benelux Union or South England. A higher number of
between February 9, 2020, and April 11, 2020, see Multimedia
tweets with geolocations was observed in Central and Western
Appendix 3. For a high-resolution collection of the subplots in
European countries than compared to Eastern Europe.
Figure 4, see Multimedia Appendix 4. In addition, Figure 5
Interestingly, tweet volumes in Turkey seemed to be higher
presents a cumulative plot of all 285,763 tweets that provided
than in surrounding countries.
Figure 4. Geolocation information of COVID-19–related tweets depicted for each 7-day interval. From top left (February 9, 2020, to February 15,
2020) to bottom right (April 5, 2020, to April 11, 2020). A single red dot denotes one tweet. Tweets with the same geographical information are plotted
on top of each other. *No tweets were collected between February 20, 2020, and February 22, 2020, and between March 28, 2020, and March 29, 2020,
due to technical issues.
http://www.jmir.org/2020/8/e19629/ J Med Internet Res 2020 | vol. 22 | iss. 8 | e19629 | p. 8
(page number not for citation purposes)
XSL• FO
RenderXJOURNAL OF MEDICAL INTERNET RESEARCH Pobiruchin et al
Figure 5. Cumulative depiction of all tweets in European countries between February 9 and April 11, 2020. Each red dot denotes one tweet. Tweets
with the same geographical information are plotted on top of each other. *No tweets were collected between February 20, 2020, and February 22, 2020,
and between March 28, 2020, and March 29, 2020, due to technical issues.
Multimedia Appendix 5. The most frequently shared resources
Link Category Analysis originated from various social media platforms and are
The most prevalent (n=250) domain-aggregated URLs were represented in the ranks 1-7. Cross-linking resources on social
categorized by three researchers independently according to the media (even on the same platform [ie, Twitter]) could be
categories introduced by Chew and Eysenbach [31]. These observed. The most prevalent category in the top 50 was
URLs accounted for 46.38% (3,596,538/7,753,841) of all shared “Mainstream or Local News.” The resources of the newspapers
resources in our study database. The three researchers achieved The Guardian and the New York Times were the leading
a PA of 0.628 and a Fleiss κ of 0.639. According to Landis and domains in this category, followed by the broadcasting services
Koch [50], these κ values correspond to a “substantial CNN and BBC. Only two domains qualified for the category
agreement.” In 4.4% (11/250) of the cases, no majority vote “Government or Public Health” in the top 50: CDC at rank 25
was achieved and those were subsequently cleared by discussion and the WHO at rank 27. No scientific resource was contained
among all of the authors. The link category “Not Accessible” in the top 50. The first occurrence was the British journal Nature
was not selected, as all domains were accessible by every at rank 116.
researcher.
The relative proportion of tweets that shared references to
Table 3 presents the top 50 shared domains and their link external resources varied during the study period. A longitudinal
categories, and the occurrences of each domain in the study subanalysis revealed a constant trend without major peaks for
database. The complete list of the top 250 can be found in each day of the study (see Figure 6).
http://www.jmir.org/2020/8/e19629/ J Med Internet Res 2020 | vol. 22 | iss. 8 | e19629 | p. 9
(page number not for citation purposes)
XSL• FO
RenderXJOURNAL OF MEDICAL INTERNET RESEARCH Pobiruchin et al
Table 3. Categorized top 50 shared website domains. Total number of occurrences of external references (n=7,753,841).
Link category and rank Domain Occurrences, n (%)
Mainstream or local news
8 theguardian.com 52,733 (0.68)
11 nytimes.com 42,735 (0.55)
13 cnn.com 35,494 (0.46)
14 bbc.co.uk 28,286 (0.36)
15 washingtonpost.com 27,316 (0.35)
19 bbc.com 25,853 (0.33)
28 nyti.ms 17,720 (0.23)
30 reuters.com 17,589 (0.23)
33 cnbc.com 17,321 (0.22)
35 bloomberg.com 16,330 (0.21)
37 elpais.com 15,888 (0.20)
38 ouest-france.fr 14,976 (0.19)
40 francetvinfo.fr 14,609 (0.19)
41 scmp.com 14,072 (0.18)
43 reut.rs 13,637 (0.18)
46 forbes.com 13,242 (0.17)
48 nypost.com 12,464 (0.16)
49 businessinsider.com 12,433 (0.16)
News blog, feed, or niche news
17 medium.com 26,201 (0.34)
42 zazoom.it 13,926 (0.18)
45 zazoom.info 13,303 (0.17)
47 topicza.com 12,960 (0.17)
Government or public health
25 cdc.gov 19,729 (0.25)
27 who.int 18,298 (0.24)
Personal blog
23 wordpress.com 22,376 (0.29)
Social network
1 twitter.com 378,508 (4.88)
2 youtu.be 365,716 (4.72)
3 instagram.com 290,336 (3.74)
5 youtube.com 144,502 (1.86)
6 facebook.com 95,166 (1.23)
7 linkedin.com 79,787 (1.03)
16 pscp.tv 26,823 (0.35)
Online store
20 amzn.to 25,378 (0.33)
Scientific resourcea
—b — —
http://www.jmir.org/2020/8/e19629/ J Med Internet Res 2020 | vol. 22 | iss. 8 | e19629 | p. 10
(page number not for citation purposes)
XSL• FO
RenderXJOURNAL OF MEDICAL INTERNET RESEARCH Pobiruchin et al
Link category and rank Domain Occurrences, n (%)
URL shortenera
10 tinyurl.com 44,768 (0.58)
24 trib.al 21,409 (0.28)
Other
4 paper.li 204,077 (2.63)
9 google.com 47,184 (0.61)
12 chng.it 41,316 (0.53)
18 fiverr.com 25,905 (0.33)
21 ift.tt 23,304 (0.30)
22 avaaz.org 22,938 (0.30)
26 arcgis.com 18,604 (0.24)
29 worldometers.info 17,670 (0.23)
31 yahoo.com 17,588 (0.23)
32 apple.news 17,584 (0.23)
34 openstream.co 16,442 (0.21)
36 goo.gl 16,310 (0.21)
39 joinzoe.com 14,827 (0.19)
44 shoutcast.com 13,635 (0.18)
50 dy.si 12,343 (0.16)
a
Link category as extension of the list given in Chew and Eysenbach [31].
b
No domain qualified for a rank below or equal to 50. The full listing with all scientific resources under this category is found in Multimedia Appendix
5.
Figure 6. The relative proportion of tweets with links to external resources. The capital letter "A" represents the naming of the disease by the World
Health Organization on February 11, 2020. Blue rectangles: No tweets were collected between February 20 and 22 as well as between March 28 and
29 due to technical issues.
http://www.jmir.org/2020/8/e19629/ J Med Internet Res 2020 | vol. 22 | iss. 8 | e19629 | p. 11
(page number not for citation purposes)
XSL• FO
RenderXJOURNAL OF MEDICAL INTERNET RESEARCH Pobiruchin et al
the reported findings may not be mapped and applicable to other
Discussion social networks such as Facebook, Reddit, or YouTube.
Principal Results Amplification of particular tweets can increase visibility of
The COVID-19–related tweet volume observed in this study certain resources shared by users. In this context, retrospective
increased constantly during the weeks of February 2020. queries and related analyses were limited by the capabilities as
However, this study did not investigate whether tweet volumes given by the “Post, retrieve, and engage with Tweets” endpoint
correlated with infection or death rates in different European [51] of the Twitter API with the “standard” access level. For
countries. It can be assumed that increasing SARS-CoV-2 this reason, the authors could not update the data collection of
infection figures correlate with increased public interest and tweets at the end of the study period regarding retweets and
engagement on social media platforms. In addition to rising likes. Consequently, no deep analysis of certain resources’
infection rates, several other factors such as the death of a popularity could be conducted. It remains a future task to
celebrity due to COVID-19 could have increased public interest analyze these relationships, even though it seems impractical
in the progress of the pandemic. In this context, the given the “standard” access level.
hashtag-specific analysis revealed that #COVID—19 and In addition, the Twitter API ensures, that privacy of nonpublic
#Covid_19 in particular were fluctuating periodically without tweets is respected. This is why the “Filter realtime Tweets”
a clear connection to specific events. endpoint [38] does not return privately posted tweets. Therefore,
The analysis over time revealed that the first Twitter hot spots those users and tweets could not be included in this study. Yet,
in Europe developed not only in the capital cities of London it is estimated that only a small proportion of Twitter users
and Paris but also in the region of Milan, Italy. The northern configure their account as fully private.
regions of Italy showed a sharp increase in tweet volume in the Most Twitter users configure their individual privacy settings
beginning and middle of February. to hide their personal geolocation. For this reason, the analyses
As the epidemic spread further over Europe, an increase of tweet of geographical variations was limited to a comparatively low
volume over most of Western and Central Europe could be amount of data. In the context of our study, geolocation data
observed. However, the increase of tweets was not that prevalent was only available for 4.40% (957,947/21,755,802) of the
in Eastern European countries (eg, Czech Republic, Poland, collected tweets. However, this subsample still accounts for
Romania) and in Southeastern Europe (eg, Serbia, Croatia). The around 1 million tweets in total. In this context, the study found
public in Turkey increased their Twitter activity around the Eastern European users of Twitter to be less engaged during
second week of March (see Figure 4) when the first COVID-19 the study period. This might originate from low Twitter adoption
case was officially confirmed by the Turkish health authorities. rates in Eastern Europe [52].
The most frequently shared resources linked to various social This study investigated the SARS-CoV-2 outbreak situation in
media platforms and were represented by the ranks 1-7. The Europe with a specific interest. This originated from the
CDC website reached the 25th rank and the WHO website the epidemic spread of the virus in Europe, starting in Italy [9-11].
27th rank in the top 250 shared domain analysis. By contrast, This spread was accompanied by increased media coverage and
the first occurrence of a prevalent scientific source is Nature at public interest in Europe [21,53,54] and worldwide [55].
rank 116. Nevertheless, it was surprising that a high-class journal Researchers of different disciplines started analyzing regional
such as Nature was only directly referenced in 0.08% differences among European countries such as Italy, Spain,
(6043/7,753,841) of the links to external resources shared on France, Germany, or Austria [17]. In the context of this study,
Twitter. Likewise, this finding applied for other scientific this motivated RQ2 and the specific analyses as reported. It is
sources: Science (rank 147; 4615/7,753,841, 0.06%), The New worth emphasizing, however, that the European languages
England Journal of Medicine (rank 154; 4405/7,753,841, cannot be mapped easily to very fine-grained country borders
0.06%), medRxiv (rank 170; 4123/7,753,841, 0.05%), and Johns on classical maps. Therefore, the European region had to be
Hopkins University (rank 199; 3586/7,753,841, 0.05%). Even approximated by using the geo-information and the bounding
with these numbers at hand, it remains an open question whether box, as described in the Methods section, defined by
direct references to scientific sources should be included more corresponding geo-coordinates. This resulted in a subsample
actively for the purpose of public health communication on of 285,763 tweets for the European region subanalysis.
Twitter or not, given that a broad media coverage, which Furthermore, the special European focus was initiated by
translates scientific language for a broader audience, seems monitoring the worsening of the severe SARS-CoV-2 outbreak
necessary to disseminate important COVID-19–related research in the Northern Italy regions of Lombardy and Emilia Romagna
results to the public. [11,37]. For this reason, the authors decided to add two
Limitations Italy-specific hashtags that were prevalent around the third week
of February 2020, as reported by Twitter trends at that time.
Many social media platforms were used to share personal
However, it should be noted that those two hashtags account
opinions, information, and news or stories around a particular
for only 0.18% (#coronovirusitaly; 45,439/25,932,420) and
topic. In the context of the COVID-19 pandemic, different
0.51% (#coronavirusitalia; 132,240/25,932,420) of all hashtag
platforms were in the public interest. In the setting of this study,
usages in the study’s data collection. As the spread of the virus
only contributions on the platform Twitter were investigated
progressed over several countries in Europe, many other
and public disease-related data was analyzed. For this reason,
country-specific hashtags appeared in Twitter trend statistics.
http://www.jmir.org/2020/8/e19629/ J Med Internet Res 2020 | vol. 22 | iss. 8 | e19629 | p. 12
(page number not for citation purposes)
XSL• FO
RenderXJOURNAL OF MEDICAL INTERNET RESEARCH Pobiruchin et al
The authors decided to avoid including all possible variations in our analysis on shared resources. The comparison suggests
and country-specific subhashtags. This possibility limits that public health-related material provided via the CDC or the
comparisons among different countries in Europe. Nevertheless, WHO was shared more frequently than during the Zika outbreak
the generic hashtags for COVID-19 remained stable over the between 2015 and 2016. This increase might originate from
full study period. Thus, tweets can be found in the data multiple reasons: improved, timely provisioning of
collection for every European country. disease-related material by either the CDC, the WHO, or both;
higher awareness of the public for quality aspects of material
The collection of data was conducted in real time. Sadly, due
and evidence-based sources; or the use of easy language or
to technical issues on February 20-22 and March 28 and 29,
easily comprehendible infographics by the public health teams
2020, data could not be collected during these time spans. The
of the CDC, the WHO, or both.
issue in February originated from a loss of connectivity to the
PostgreSQL study database, which was not discovered for Abd-Alrazaq et al [16] analyzed the content and sentiment of
around 48 hours during a weekend. A second, technical issue about 2.8 million COVID-19–related tweets, retrieved via the
in late March resulted from an unexpected memory allocation Twitter standard search API, written in the English language.
problem on the processing server. Once the issue was resolved By contrast, our study design made use of Twitter’s real-time
by a software patch, the system was capable of collecting and Streaming API, which allows for a constant intake to the study
storing tweets correctly again. database. In [16], the authors made use of the search terms
“corona,” “2019-nCov,” and “COVID-19.” In our study, we
Comparison With Prior Work monitored 16 hashtags for a time span of 9 weeks. This resulted
During the 2009 H1N1 flu pandemic, Chew and Eysenbach in a data collection with a total of approximately 21.8 million
[31] applied the infoveillance concept for a content analysis for topic-related tweets. With our analysis framework, we were
which they “archived over 2 million Twitter posts containing able to monitor specific regions (Europe) and countries, in
keywords ‘swine flu’, ‘swineflu’ and/or ‘H1N1.’” The authors particular the SARS-CoV-2 outbreak in Italy.
analyzed diseases-related trends, the origin of shared resources,
and the sentiment expressed in swine flu tweets. In our study, Future Directions
more than 20 million COVID-19–related tweets were analyzed This study demonstrates how COVID-19–related tweets can be
for temporal or geographical characteristics and trends as well analyzed for a certain region (Europe). With the continuous
as for the link category of external resources. In the 2009 study progression of the pandemic situation, which is to be expected
[31], the authors found that “government and health agencies in the next months worldwide, further regions should be
were only linked 1.5% of the time.” For a top 250 list, this low analyzed in-depth. Therefore, the authors encourage other
proportion is confirmed by our findings (78,786/7,753,841, researchers to contribute their analyses with a special focus on
1.02%). Chew and Eysenbach [31] found that “news websites regions such as Africa, South and North America, or Asia.
were the most popular sources (23.2%).” Likewise, our analysis Moreover, different analysis techniques can be leveraged to
revealed that the link category “Mainstream and local news” learn more about what users share in the current pandemic
was represented by 11.97% (928,467/7,753,841), which was situation. For this purpose, one could use sentiment analysis or
substantially lower than in 2009. In this context, our findings conduct social network graph analysis to uncover patterns that
suggest that Twitter users cross-reference to Twitter itself or to might be hidden in the data. Sentiment analysis is of particular
other social media platforms (1,406,419/7,753,841, 18.14%), interest, as it could reveal differences between regions or even
whereas this group was reported to represent only 2% of the between several countries, such as demonstrated by Abd-Alrazaq
corresponding category in the study by Chew and Eysenbach et al [16] for tweets written in the English language [16].
[31]. Moreover, the authors of the H1N1 flu study reported that
Long-term Twitter monitoring based on geographical data could
“61.8% of all tweets had links [..].” In our study, this proportion
be a supporting tool for local health authorities. With an average
was found to be 34.16% (7,431,226/21,755,802), which was
tweet volume per city, region, or even country, significant peaks
substantially lower.
well above the 7-day average could be reported to official
Fu et al [32] analyzed how people reacted to the Zika epidemic institutions quickly in an electronic, interoperable format. In
in the Americas from 2015 to 2016. The authors analyzed this sense, an automated analysis tool could be an extension of
132,033 tweets with the key word “zika” written in the our software components to capture pandemic-related tweets
languages English, Spanish, and Portuguese via the Twitter in real time.
API. The authors reported, that the top ranked shared resources
Future studies should also focus on the origin and
originated from social media platforms such as “Facebook,
trustworthiness of shared resources. Monitoring the spread of
Instagram, Twitter, YouTube, LinkedIn, Tumblr, the blogging
fake news during a pandemic situation seems of particular
site WordPress, [..] which accounted for 26% of all domains.”
importance [24,26]. Timely measures to fight and reduce the
This could be confirmed by our results, as social media
spread of COVID-19 misinformation could thus be supported.
platforms were ranked on the positions 1-7 accounting for
In addition, it would be beneficial to analyze and uncover bot
18.14% (1,406,419/7,753,841) of all shared resources. In the
networks spreading COVID-19–related misinformation. In this
Zika study, the CDC and the WHO accounted for 0.06% and
study, we could uncover periodicity of at least one hashtag
0.05%, respectively. This corresponded to a 90th and 140th
(#COVID—19). This might be linked to a hidden bot network,
rank, respectively, compared to a 25th (19,729/7,753,841,
which justifies further investigation.
0.25%) and a 27th (18,298/7,753,841, 0.24%) rank, respectively,
http://www.jmir.org/2020/8/e19629/ J Med Internet Res 2020 | vol. 22 | iss. 8 | e19629 | p. 13
(page number not for citation purposes)
XSL• FO
RenderXJOURNAL OF MEDICAL INTERNET RESEARCH Pobiruchin et al
In future work, the authors intend to publish the data collection engagement of citizens on social media platforms rose
according to the Developer Agreement and Policy of Twitter accordingly. On April 16, 2020, Dr Hans Kluge, the WHO
[56]. Other researchers might analyze this data collection with director for Europe, characterized the situation as “we remain
a different focus or with their own scientific perspective. By in the eye of the [COVID-19] storm” [57]. The findings of this
providing this data set, the requirement of providing one’s own study allow for a detailed analysis for the European region and
technical infrastructure would pose no barrier for non–computer how citizens of different European countries shared their
science disciplines. We hope to provide this data set publicly, opinions, experiences, and concerns on Twitter. The detailed
regularly updated in 1 week intervals. maps of Europe are available for each 7-day interval starting
on February 9, 2020.
Conclusions
The naming of the disease by the WHO on February 11, 2020 Social media platforms were ranked at the position of 1-7,
[1], was a major signal to address the public audience with a counting for 18.14% (1,406,419/7,753,841) of all shared
public health response via social media platforms. The volume resources. The CDC website reached the 25th rank
of #covid19-related tweets increased after the WHO (19,729/7,753,841, 0.25%) and the WHO website the 27th rank
announcement and stabilized at the end of March at a high level. (18,298/7,753,841, 0.24%) of the top 250 shared domain
analysis. Future studies should focus on the origin and
During the spread of the SARS-CoV-2 virus in Europe between trustworthiness of shared resources, as monitoring the spread
February 2020 and early April 2020, the public interest and of fake news during a pandemic situation is of particular
media coverage increased rapidly. Consequently, the importance.
Acknowledgments
The authors would like to thank Prof em Dr Wilhelm Werner of Heilbronn University for his mathematical advice in the preparation
of this article.
Conflicts of Interest
None declared.
Multimedia Appendix 1
Listing of all hashtags included in the study.
[DOCX File , 16 KB-Multimedia Appendix 1]
Multimedia Appendix 2
Temporal variations of hashtag frequencies between February 9, 2020, and April 11, 2020.
[DOCX File , 2002 KB-Multimedia Appendix 2]
Multimedia Appendix 3
Animated video of the geographical variation of tweets in the European countries.
[MP4 File (MP4 Video), 730 KB-Multimedia Appendix 3]
Multimedia Appendix 4
Seven-day interval plots of the geographical variation of tweets in all European countries.
[DOCX File , 2149 KB-Multimedia Appendix 4]
Multimedia Appendix 5
Categorized top 250 shared (web site) domains.
[DOCX File , 22 KB-Multimedia Appendix 5]
References
1. Naming the coronavirus disease (COVID-19) and the virus that causes it. World Health Organization. URL: https://www.
who.int/emergencies/diseases/novel-coronavirus-2019/technical-guidance/
naming-the-coronavirus-disease-(covid-2019)-and-the-virus-that-causes-it [accessed 2020-03-09]
2. Zhou P, Yang X, Wang X, Hu B, Zhang L, Zhang W, et al. A pneumonia outbreak associated with a new coronavirus of
probable bat origin. Nature 2020 Feb 3;579(7798):270-273. [doi: 10.1038/s41586-020-2012-7]
3. Wu F, Zhao S, Yu B, Chen Y, Wang W, Song Z, et al. A new coronavirus associated with human respiratory disease in
China. Nature 2020 Feb 3;579(7798):265-269. [doi: 10.1038/s41586-020-2008-3]
http://www.jmir.org/2020/8/e19629/ J Med Internet Res 2020 | vol. 22 | iss. 8 | e19629 | p. 14
(page number not for citation purposes)
XSL• FO
RenderXJOURNAL OF MEDICAL INTERNET RESEARCH Pobiruchin et al
4. Huang C, Wang Y, Li X, Ren L, Zhao J, Hu Y, et al. Clinical features of patients infected with 2019 novel coronavirus in
Wuhan, China. Lancet 2020 Feb 15;395(10223):497-506 [FREE Full text] [doi: 10.1016/S0140-6736(20)30183-5] [Medline:
31986264]
5. Chen N, Zhou M, Dong X, Qu J, Gong F, Han Y, et al. Epidemiological and clinical characteristics of 99 cases of 2019
novel coronavirus pneumonia in Wuhan, China: a descriptive study. Lancet 2020 Feb 15;395(10223):507-513 [FREE Full
text] [doi: 10.1016/S0140-6736(20)30211-7] [Medline: 32007143]
6. Guan W, Ni Z, Hu Y, Liang W, Ou C, He J, China Medical Treatment Expert Group for Covid-19. Clinical characteristics
of coronavirus disease 2019 in China. N Engl J Med 2020 Apr 30;382(18):1708-1720 [FREE Full text] [doi:
10.1056/NEJMoa2002032] [Medline: 32109013]
7. Young BE, Ong SWX, Kalimuddin S, Low JG, Tan SY, Loh J, Singapore 2019 Novel Coronavirus Outbreak Research
Team. Epidemiologic features and clinical course of patients infected with SARS-CoV-2 in Singapore. JAMA 2020 Mar
03:1488-1494 [FREE Full text] [doi: 10.1001/jama.2020.3204] [Medline: 32125362]
8. Day M. Covid-19: surge in cases in Italy and South Korea makes pandemic look more likely. BMJ 2020 Feb 25;368:m751.
[doi: 10.1136/bmj.m751] [Medline: 32098875]
9. Spina S, Marrazzo F, Migliari M, Stucchi R, Sforza A, Fumagalli R. The response of Milan's Emergency Medical System
to the COVID-19 outbreak in Italy. Lancet 2020 Mar;395(10227):e49-e50. [doi: 10.1016/s0140-6736(20)30493-1]
10. Grasselli G, Pesenti A, Cecconi M. Critical care utilization for the COVID-19 outbreak in Lombardy, Italy: early experience
and forecast during an emergency response. JAMA 2020 Mar 13:A. [doi: 10.1001/jama.2020.4031] [Medline: 32167538]
11. Saglietto A, D’Ascenzo F, Zoccai GB, De Ferrari GM. COVID-19 in Europe: the Italian lesson. Lancet 2020
Apr;395(10230):1110-1111. [doi: 10.1016/s0140-6736(20)30690-5]
12. Remuzzi A, Remuzzi G. COVID-19 and Italy: what next? Lancet 2020 Apr;395(10231):1225-1228. [doi:
10.1016/s0140-6736(20)30627-9]
13. Garfin D, Silver RC, Holman EA. The novel coronavirus (COVID-2019) outbreak: amplification of public health
consequences by media exposure. Health Psychol 2020 May;39(5):355-357. [doi: 10.1037/hea0000875] [Medline: 32202824]
14. Li J, Xu Q, Cuomo R, Purushothaman V, Mackey T. Data mining and content analysis of the Chinese social media platform
Weibo during the early COVID-19 outbreak: retrospective observational infoveillance study. JMIR Public Health Surveill
2020 Apr 21;6(2):e18700 [FREE Full text] [doi: 10.2196/18700] [Medline: 32293582]
15. Llewellyn S. Covid-19: how to be careful with trust and expertise on social media. BMJ 2020 Mar 25;368:m1160. [doi:
10.1136/bmj.m1160] [Medline: 32213480]
16. Abd-Alrazaq A, Alhuwail D, Househ M, Hamdi M, Shah Z. Top concerns of tweeters during the COVID-19 pandemic:
infoveillance study. J Med Internet Res 2020 Apr 21;22(4):e19016 [FREE Full text] [doi: 10.2196/19016] [Medline:
32287039]
17. Hodcroft EB. Preliminary case report on the SARS-CoV-2 cluster in the UK, France, and Spain. Swiss Med Wkly 2020
Feb 24;150(9-10):A. [doi: 10.4414/smw.2020.20212] [Medline: 32227799]
18. Lescure F, Bouadma L, Nguyen D, Parisey M, Wicky P, Behillil S, et al. Clinical and virological data of the first cases of
COVID-19 in Europe: a case series. Lancet Infect Dis 2020 Jun;20(6):697-706. [doi: 10.1016/s1473-3099(20)30200-0]
19. Moss P, Barlow G, Easom N, Lillie P, Samson A. Lessons for managing high-consequence infections from first COVID-19
cases in the UK. Lancet 2020 Mar;395(10227):e46. [doi: 10.1016/s0140-6736(20)30463-3]
20. Rothe C, Schunk M, Sothmann P, Bretzel G, Froeschl G, Wallrauch C, et al. Transmission of 2019-nCoV infection from
an asymptomatic contact in Germany. N Engl J Med 2020 Mar 05;382(10):970-971. [doi: 10.1056/nejmc2001468]
21. Escritt T, Carrel P. New coronavirus cases in Germany, one man in critical condition. Reuters. 2020 Feb 25. URL: https:/
/www.reuters.com/article/us-china-health-germany-idUSKBN20J2K2 [accessed 2020-04-24]
22. Danis K, Epaulard O, Bénet T, Gaymard A, Campoy S, Botelho-Nevers E, Investigation Team. Cluster of coronavirus
disease 2019 (COVID-19) in the French Alps, February 2020. Clin Infect Dis 2020 Jul 28;71(15):825-832 [FREE Full text]
[doi: 10.1093/cid/ciaa424] [Medline: 32277759]
23. Jones J. Spanish authorities confirm Briton is country's second coronavirus case. Reuters. 2020 Feb 09. URL: https://www.
reuters.com/article/us-china-health-spain-idUSKBN20309T [accessed 2020-04-25]
24. Merchant RM, Lurie N. Social media and emergency preparedness in response to novel coronavirus. JAMA 2020 Mar
23:A. [doi: 10.1001/jama.2020.4469] [Medline: 32202611]
25. Broniatowski DA, Jamison AM, Qi S, AlKulaib L, Chen T, Benton A, et al. Weaponized health communication: Twitter
bots and Russian trolls amplify the vaccine debate. Am J Public Health 2018 Oct;108(10):1378-1384. [doi:
10.2105/AJPH.2018.304567] [Medline: 30138075]
26. Chou WS, Oh A, Klein WMP. Addressing health-related misinformation on social media. JAMA 2018 Dec
18;320(23):2417-2418. [doi: 10.1001/jama.2018.16865] [Medline: 30428002]
27. Novel coronavirus(2019-nCoV) situation report - 13. World Health Organization. 2020 Feb 02. URL: https://apps.who.int/
iris/bitstream/handle/10665/330778/nCoVsitrep02Feb2020-eng.pdf
28. Zarocostas J. How to fight an infodemic. Lancet 2020 Feb;395(10225):676. [doi: 10.1016/s0140-6736(20)30461-x]
29. Limaye RJ, Sauer M, Ali J, Bernstein J, Wahl B, Barnhill A, et al. Building trust while influencing online COVID-19
content in the social media world. Lancet Digital Health 2020 Jun;2(6):e277-e278. [doi: 10.1016/s2589-7500(20)30084-4]
http://www.jmir.org/2020/8/e19629/ J Med Internet Res 2020 | vol. 22 | iss. 8 | e19629 | p. 15
(page number not for citation purposes)
XSL• FO
RenderXJOURNAL OF MEDICAL INTERNET RESEARCH Pobiruchin et al
30. Eysenbach G. Infodemiology and infoveillance: framework for an emerging set of public health informatics methods to
analyze search, communication and publication behavior on the Internet. J Med Internet Res 2009 Mar 27;11(1):e11 [FREE
Full text] [doi: 10.2196/jmir.1157] [Medline: 19329408]
31. Chew C, Eysenbach G. Pandemics in the age of Twitter: content analysis of Tweets during the 2009 H1N1 outbreak. PLoS
One 2010 Nov 29;5(11):e14118 [FREE Full text] [doi: 10.1371/journal.pone.0014118] [Medline: 21124761]
32. Fu K, Liang H, Saroha N, Tse ZTH, Ip P, Fung IC. How people react to Zika virus outbreaks on Twitter? A computational
content analysis. Am J Infect Control 2016 Dec 01;44(12):1700-1702. [doi: 10.1016/j.ajic.2016.04.253] [Medline: 27566874]
33. Guest JL, Del Rio C, Sanchez T. The three steps needed to end the COVID-19 pandemic: bold public health leadership,
rapid innovations, and courageous political will. JMIR Public Health Surveill 2020 Apr 06;6(2):e19043 [FREE Full text]
[doi: 10.2196/19043] [Medline: 32240972]
34. Southwell BG, Thorson EA, Sheble L. The persistence and peril of misinformation. Am Sci 2017;105(6):372. [doi:
10.1511/2017.105.6.372]
35. Ahmed W, Vidal-Alaball J, Downing J, López Seguí F. COVID-19 and the 5G conspiracy theory: social network analysis
of Twitter data. J Med Internet Res 2020 May 06;22(5):e19458 [FREE Full text] [doi: 10.2196/19458] [Medline: 32352383]
36. Mast fire probe amid 5G coronavirus claims. BBC. 2020 Apr 04. URL: https://www.bbc.com/news/uk-england-52164358#
[accessed 2020-04-24]
37. Paterlini M. On the front lines of coronavirus: the Italian response to covid-19. BMJ 2020 Mar 16;368:m1065. [doi:
10.1136/bmj.m1065] [Medline: 32179517]
38. Filter realtime tweets. Twitter. URL: https://developer.twitter.com/en/docs/tweets/filter-realtime/api-reference/
post-statuses-filter [accessed 2020-03-09]
39. Twitter4J. URL: http://twitter4j.org/en/ [accessed 2020-01-04]
40. PostgreSQL. URL: https://www.postgresql.org/ [accessed 2020-01-04]
41. Geo objects. Twitter. URL: https://developer.twitter.com/en/docs/tweets/data-dictionary/overview/geo-objects [accessed
2020-04-24]
42. crawler4j. GitHub. URL: https://github.com/yasserg/crawler4j [accessed 2020-01-04]
43. Lehmberg O, Meusel R, Bizer C. Graph structure in the web: aggregated by pay-level domain. In: WebSci '14: Proceedings
of the 2014 ACM Conference on Web Science. 2014 Jun Presented at: WebSci '14: ACM Web Science Conference; June
2014; Bloomington, IN p. 119-128. [doi: 10.1145/2615569.2615674]
44. Public Suffix List. URL: https://publicsuffix.org/ [accessed 2020-04-23]
45. Lombard M, Snyder-Duch J, Bracken CC. Content analysis in mass communication: assessment and reporting of intercoder
reliability. Human Comm Res 2002 Oct;28(4):587-604. [doi: 10.1111/j.1468-2958.2002.tb00826.x]
46. Fleiss JL. Measuring nominal scale agreement among many raters. Psychological Bull 1971;76(5):378-382. [doi:
10.1037/h0031619]
47. Wickham H. ggplot2: Elegant Graphics for Data Analysis. New York: Springer; 2009.
48. About verified accounts. Twitter. URL: https://help.twitter.com/en/managing-your-account/about-twitter-verified-accounts
[accessed 2020-04-23]
49. Evaluating language identification performance. Twitter. 2015 Nov 16. URL: https://blog.twitter.com/engineering/en_us/
a/2015/evaluating-language-identification-performance.html [accessed 2020-04-23]
50. Landis JR, Koch GG. The measurement of observer agreement for categorical data. Biometrics 1977 Mar;33(1):159. [doi:
10.2307/2529310]
51. GET statuses/lookup. Twitter. URL: https://developer.twitter.com/en/docs/tweets/post-and-engage/api-reference/
get-statuses-lookup [accessed 2020-04-24]
52. Leetaru K, Wang S, Padmanabhan A, Shook E. Mapping the global Twitter heartbeat: the geography of Twitter. FM 2013
May 06;18(5):A. [doi: 10.5210/fm.v18i5.4366]
53. Reynolds M, Weiss S. How coronavirus started and what happens next, explained. Wired. 2020 May 27. URL: https://www.
wired.co.uk/article/china-coronavirus [accessed 2020-05-27]
54. COVID-19: Commission sets out European coordinated response to counter the economic impact of the Coronavirus.
European Commission. 2020 Mar 13. URL: https://ec.europa.eu/commission/presscorner/detail/en/ip_20_459 [accessed
2020-04-24]
55. Sheikh K, Rabin RC. The coronavirus: what scientists have learned so far. The New York Times. 2020 Aug 05. URL:
https://www.nytimes.com/article/what-is-coronavirus.html [accessed 2020-08-05]
56. Developer agreement and policy. Twitter. URL: https://developer.twitter.com/en/developer-terms/agreement-and-policy
[accessed 2020-04-24]
57. United NRICFWE. COVID-19: “We remain in the eye of the storm”- WHO Europe. United Nations: Regional Information
Centre for Western Europe. 2020 Apr 16. URL: https://unric.org/en/covid-19-we-remain-in-the-eye-of-the-storm-who-europe/
[accessed 2020-04-24]
http://www.jmir.org/2020/8/e19629/ J Med Internet Res 2020 | vol. 22 | iss. 8 | e19629 | p. 16
(page number not for citation purposes)
XSL• FO
RenderXYou can also read