FRAMEWORK FOR ANALYZING TWITTER TO DETECT COMMUNITY SUSPICIOUS CRIME ACTIVITY - aircc
←
→
Page content transcription
If your browser does not render page correctly, please read the page content below
FRAMEWORK FOR ANALYZING TWITTER
       TO DETECT COMMUNITY SUSPICIOUS
               CRIME ACTIVITY
                                           Safaa.S Al Dhanhani

                     Khalifa University, Abu Dhabi, United Arab Emirates

     ABSTRACT
     This research work discusses how an integrated open source intelligence framework can help
     the law enforcements and government entities who are investigating crimes based on statistical
     and graph analysis on Twitter data. The solution supports a real-time and off-line analysis of
     the tweets collections. The framework employs tools that support big data processing
     capabilities, to collect, process and analyze a huge amount of data. The outline solution
     supports content and textual based analysis, helping the investigators to dig into a person and
     the community linked to that person based on a tweet. Our solution supports an investigative
     processes composed of the following phases (i) find suspicious tweets and individuals based on
     hash tags analysis (ii) classify the user profile based on Twitter features (iii) identify influencers
     in the FOAF networks of the senders (iiii) analyze these influencers’ background and history to
     find hints of past or current criminal activity.

     KEYWORDS
     Twitter, analysis, crime, detection

1. OVERVIEW
Twitter is a microblogging service for sharing messages restricted to 140 characters [1]. Twitter
provides some features for users to communicate with each other: 1. Posts: Twitter provides to
the users posting features in which they can post messages on their personal page. 2. Hashtags:
Twitter users can use hashtag which is written on the format of: #hashtag, which is relating the
tweet to a certain topic. Hashtags are searchable in Twitter; the users can search by a hashtag and
retrieve the tweets related to that hashtag. Mentions: Mentions is written on format of
“@username”, users can use mention to refer a message to another user. Replays: Replay is
another interaction way that is used to replay messages. Favorites: Users can favorite a tweet,
Twitter provides the count of the favorite related to a tweet as an information. Retweet: Twitter
has feature of retweets, which means that user can repost a tweet of someone else, the original
writer will always appear. Retweeted tweets provide the number of retweets of that tweet as
information.

David C. Wyld et al. (Eds) : CNSA, DMDB, AIAP - 2018
pp. 41– 60, 2018. © CS & IT-CSCP 2018                                          DOI : 10.5121/csit.2018.80104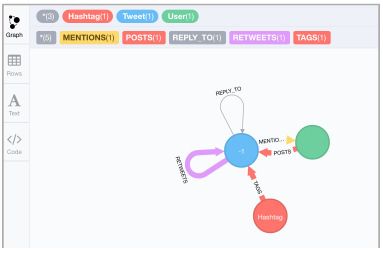
42                      Computer Science & Information Technology (CS & IT)

2. LITERATURE REVIEW
Many researchers have done a lot of work in analyzing Twitter for event detections and event
predictions, most researchers have used Twitter features to conduct the analysis, such as: retweets
and mentions. Most prediction techniques of events have been derived using textual analysis or
sentimental analysis. However, it has been shown that predicting of events can be done without
textual analysis or sentimental analysis with successful results, they are several ways that have
been used for this purpose: users’ communication analysis [3, 4, 5], account analysis[6, 7, 8],
prediction of events based on sentiments analysis [9, 10, 11]. Also, it has been showing that
Twitter can help on predicting crime location using linear regression [12]. Furthermore, crime
analysis used node analysis for crime detection and understanding key players of terrorist on the
social network[13, 14, 15]. This section is exploring the related work on crime analysis using
social media and particularly in Twitter.

2.1 Related Work on Framework for Crime Detection

Christopher C. Yang and Tobun D. Ng have proposed a framework solution for crime related
weblog including links and contents analysis and visualizations[5]. The main pillars of this
framework: 1. extraction of community specific topics 2. Specifying the relationship between the
bloggers in the social network 3. Content and sentimental analysis 4. Visualization of different
level of abstractions. They also introduced some searching techniques, independent and
dependent neighborhood graph, such as top N documents from seed set, and HITS algorithms for
ranking algorithms. The authors were against NLP because of the difficulty of processing the text
on the blogs since it is not always written in a proper language structure. They have introduced
some visualization methodologies such as filtering the nodes and arcs which are less relevant to
the searched target, having a fisheye view to get view picture of the relationship on the network
and having the ability to dig down to other relationships without changing the structure.C.
Christopher and D. N. Tobin covered significant criteria of crime identifications, but ignoring
language processing will reduce the accuracy and increase the false positive results. The
researchers have built a framework that only operates on blogs and did not show the way of
verifying results. Also, it did not highlight the elimination techniques of false positive accounts.
In addition, the authors did not suggest the technologies for implementing this framework.

2.1.1 Twitter User Account Analysis

Zhang and Paxson have developed a method to identify the automated Twitter account based on
the behavior of the tweets on a periodic manner [6]. The study has declared that the organic
Tweets represented on randomly distribution patterns; however, automated Tweet forming a
structured pattern. The reason why it is formed that way, because usually they are running on a
scheduler that tweets every minute or every day [6]. During the study, they have captured a small
number of false positive results 2 out of 1000, and this was for a few accounts that update on a
regular time basis; for example, students who update timeline every day after their classes.
Another example, Dr. Phil updates his timeline every day before the show. Unlike the false
positive, false negative has a higher probability and that was because of some reasons such as
hybrid behavioral account which mask themselves with organic posts. Another reason is that
some automated posts are based on RSS feed, not schedulers, so it is created with the feed
updates. This evaluation can evade if the automated account has mutated its behavior according
to know organic account. According to the analyzed data, 14% of the public account were posting
Computer Science & Information Technology (CS & IT)                     43
discernible automation [6]. While 24% were generated by automated bots, and 15% of the tweets
were generated from the automated source [6]. The authors have also included verified accounts
analysis, it has been found that most verified accounts belonged to celebrities and popular
companies. They are many verified account that failed on the test such as popular brands, TV
shows fans, political figures, news, non-profit organizations and government organizations.
According to the finding most users are not verified accounts, 40% were verified users with the
sample used. Surprisingly, the verified users seem to be automated account with compared to
non-verified accounts, 6.9%, 16% consequently [6]. The researchers found that tweet source has
clearly identify the account type, it is found that people used mostly phones for tweets while
automated accounts used API to post tweets. The research has highlighted interesting findings of
automated account based on the trained data, but the study did not include content or sentiment
analysis to increase result accuracy. In addition, the reseach did not emphasize the age of the
accounts and number of followers, as profile indication of automated or non automated accounts.

Klatsch framework which analyzes the users’ behavior in Twitter feeds using graph
analysis[7].The designed model represented as events and memes where actors have the role of
creating the events, who represent the users whereby the memes represent the information in a
needed level of detail. Each of these are related to a unit of weight and edges in the network
structure. An example explaining this; event can be a tweet which is created by an actor who can
be a user who posted, or retweeted a tweet. The intended solution aimed to identify organic and
non-organic tweets, based on topologies of the Twitter communication network. In [7], the
researchers have highlighted interesting topologies pattern of non-organic tweets. However, they
did not provide how they utilize the sentiment analysis with the graph analysis. In addition, they
did not cover user classification and evaluation of the tweet accuracy, which increases the false
positive and false negative as well.

2.1.2 Detection of Events Based on Twitter Communication

In [3], the authors have proposed a system composed of two processes: online and offline
processes. The online processes contain ranking and clustering, which intended to detect events,
and online searching for analytics. The clustering model designed to group the similar tweets
according to their geo location, and their relevant timeframe with respect to their importance. On
the other hand, offline processes retrieve the data from the API crawler then extract the CDE
related tweet according to classifiers, then index the data and store it in the database. The
researchers have used several analytic techniques to extract event related to tweet such as: 1.
linear regression to predict friends’ location when the information related to their location does
not exist whereas tagged or mentioned by another user with geo location, 2. ranking techniques
by using Twitter feature which analyzes the content according to crime or disaster related words
such as kill or accident hashtag,3.user profile analysis using Twitter user feature by Twitter
profile information and deciding whether the user are considered as credible or not. The analysis
includes number of Twitter attributes such as: number of tweets, the age of the account and
account verification information. 4. Usage feature is used to define the most important tweet
explicitly and implicitly by having the number of retweets and favorites as an indicator. The
research has identified key values to identify the CDE; however, it did not demonstrate how
URLs can distinguish whether it is related to an event or not. In addition, it did not show how to
correlate the hashtag to an event, they only related these parameters to geo locations, which is not
always enabled in users’ account. Moreover, detecting the friend’s location from linear regression
as they have mentioned may got error because location may differ each time, for example,
whenever I met with my friends we always try to choose a new location!
44                      Computer Science & Information Technology (CS & IT)
Unlike TEDAS approach, in [4] the researchers have found an interesting pattern with respect to
communication in Twitter during the world cup 2011 event, using non-textual data. They have
considered the newly event, and the influencers of the event via users’ interactions, as posts for
newly events, and retweets or mentions for the influencers. In addition, they have address a
methodology to extract event from a raw number of tweets and retweets that occurred during
these events using linear classifier. The authors have found that people are less social during the
event; whereas they are busy with mentions, retweet and replies after the event, while they are
posting about the event during the event. The authors in [4]have contributed in successful results
the pattern of events related to world cup; however, the mechanisim fails to identify the creditable
sources of the event to get more accurate results. In addition, this methodology fails to identify
the event impact in the society, good or bad.

2.1.3 Predicting Crime Location Using Linear Regression

In [12], the author has used Twitter specific linguistic analysis and statistical analysis based on
topics which are related to crimes, the study has examined sample of crimes in Chicago city,
which contains the crime type with geo location records. The researcher used this as a historical
data, then examining the geo location tagged tweets which are related to a crime. He has
compared the traditional linear regression output with Twitter feature analytic for prediction. It
has been shown that Twitter data has improved the results of the prediction; however, the author
did not provide prediction of the crime that may happen on the location with time, so that the
police get ready to prevent the crime from happening. Moreover, the current solution does not
provide network analysis of the accounts, to identify the criminal. In addition, it is not studying
account analysis, and trending topics, to have more accurate account and tweet credibility.

2.1.4 Detecting Crimes Based on Nodes Analysis

R. YK Lau, M. Kamal H and M. I. Pramanik, [13] have proposed a framework for detecting
crimes based on criminal network patterns, the framework has used structure analysis based on
centrality measures and network mapping. Each of these measures concluding a role or a
dependency of criminal in the network. The researchers used a dataset from official site of the
Los Angeles County Sheffi’s Department, the data collected was holding records from 2004 to
2005. The researchers have studied several crime types and they used some attributes of the
crimes for evaluation, each record was related to an individual criminal. In [13], they have only
studied the relationship between the criminals on the social network, but it did not looked at other
factors like weapons, locations, and organizations.

In [14], the researchers have used similar algorithms used in [13]; however, they have also
included Page Rank and eigenvector algorithms in the analysis of social network. The researchers
used leaked data from data theft service of Nigerian advanced fee fraud scammer, then they have
searched for Facebook accounts related to criminal people, getting their profiles. Using that
technique, the researchers have linked criminal profile with their friends building the social
network for analysis. The study has found that key members of criminals have high rank of
centrality and well-connected members. H. Sarvari, E. Abozinadah, A. Mbaziira and D. Mccoy
have found groups based on Facebook communities but they have not validate the
communication of the email addresses, to accuratly identify the relationship between the parties
and the strength of the relationships.
Computer Science & Information Technology (CS & IT)                      45
Ala in 2012, proposed graph algorithms to find the financial manager on a decentralized terrorist
network. It's found out that financial manager is the most important node in the network, it’s the
most operative and have an active relationship with other nodes in the network [15]. The
researchers have used the subset of categories used in NATO (North Atlantic Treaty
Organization) model, AIntP-3 data model. Ala has successfully defined the financial manager in
the case study analyzed, finding that financial manager playing key player in the terrorist
network. Ala has successfully identified the financial manager as a key player on the terrorist
network; however, the study did not show how to detect the terrorist network in the diffused
social network. The study did not show how to map nodes or actors to entity from data collection
from social media, it is only explaining how graph analysis can be applied as in NATO with data
collected from news. It did not demonstrate extraction of NATO categories from the social media.

2.1.5 Prediction Based on Twitter Data Analysis

There are many researches used Twitter data to predict events such as elections, plays, or crimes’
locations. They have used different aspect of Twitter data, such as Twitter communication which
was explained on section 2.4, or content analysis of the text, which will be explained on the
following subsection. Others they have studied historical data collected from non-social media
source and map it with Twitter to predict crime location intensity.

2.1.6 Prediction Based on Sentiment Analysis

On the crime pattern detection using online social media [10], it addresses two main domains: geo
based analysis of the tweets with respect to selected cities, and intensity analysis of the cities by
applying sentiment analysis to the collected tweets. They are several tools used for sentiment
analysis: subjective analysis which focuses on the opinion and ignores the facts, for this
methodology “Bayes” and cut based classification were used. Another methodology that does
polarity analysis of the subjective sentence. This classification composed of two classes binary
and multiclass classification. The binary classification is composed of positive and negative
whereas the multiclass classification is composed of five categories: strong positive, positive,
neutral, negative, strong negative. Dictionary based ANEW was used as well, it’s providing a set
of normalizing emotional rating for English words. Recursive Neural Tensor Network RNTN
sentiment methodology used and it provides misclassifications: very positive, positive, very
negative, and negative. The result of sentiment analysis with respect to the geolocation provides
the trend of crimes that happened at that location. Raja’s research has address good sentiment
analysis technique but the paper doesn’t provide solution to identify suspicious people that on the
area or prediction techniques to identify crimes that may happened on the location.

In 2011 A. Bermingham and A. F. Smeaton studied prediction of election results using volume
based and sentiment analysis in Twitter [11]. The study was designed for the Irish general
election which took place on the 25th February 2011. The data were collected for the main parties
of the election. Finna Fail (FF), Green Party, Labour, Fine Gael (FG) and Sinn Fein (SF). The
collection was based on hashtags of the names and abbreviation. The evaluation for the parties
used different sample of time set. According to the study, the sentiment analysis has shown some
positive results compared with the traditional volume based analysis, but also introduces failure.
The researchers had failure in using sentiment analysis for prediction of the election, and find that
volume based was more successful, concluding that was due to the popularity of the parties will
make them get more polls.
46                       Computer Science & Information Technology (CS & IT)
They did not address the problem behind the problem of sentiment analysis was not accurate and
they could not distinguish between from sentiment analysis between people preferences and
people reaction to news. The authors did not analyze the credibility of the tweets and the sources
which increased their errors.

Ramteke, Shah, Godhia, Aadil have proposed a model to analyze election results using Twitter
sentiment analysis [9]. The researchers have used public Twitter API to collect tweets, then they
manually label the data using hashtag clustering. The authors used VADER (valence Aware
Dictionary and Sentiment Reasoner) used for social media text, and it returns polarity of the
sentence based on emotions. The researchers have collected data for training of two days, passing
keywords: Democrats, Republicans, and the names of the candidates. They have compared
several text-based classifiers for sentiment analysis: SVM linear kernel, SVM rbf kernel, SVM-
liblinear, Naïve Bayes – multinomial NB, after the training they have concluded that SVM with
linear kernel was the most accurate and they have selected it for entity classifier. According to the
analysis used, Ratio = |p|/T where p is the total number of positive tweets for a candidate and T is
the total of the tweets that is related to the candidate.

The research has addressed a good interpretation of sentiment analysis selection but it did not
address the prediction of the winner. Also, the framework fails to provide automation analysis of
the tweets, which require extraction of tweet body from the JSON to CSV for analysis, which is
not feasible since data collection of Twitter is huge. Also, it does not provide features to compare
the new and old data for analysis.

3. PRELIMINARIES
This section explains the concepts of network centrality and point out three types of centrality
measurements, moreover, it is explaining the way to calculate each of these measurements.

3.1 Network Centrality

It has been found that network centrality analysis help on identifying many factors that may affect
the network such as fast distribution of information, stopping evil nodes, and protecting the
network from cracking[16]. According to [17]centrality is defined as: a way to formalize intuitive
notions about the distinction between: the importance, and the internals and externals. They are
three measures that highlight the importance of the node in the network: (i) betweenness,(ii)
closeness, (ii) degree centrality

3.1.1 Degree Centrality

Degree centrality is the sum of the connection from a node to a node in the network, an example
of this is authority, hub and PageRank algorithms [15]. The node with more number of links got a
higher importance on the network.

                                          Equation 1[16]
Computer Science & Information Technology (CS & IT) 47
The following equation is calculating the degree of node ni where ni network of nodes, which
is the sum of the X edges between ni and nj
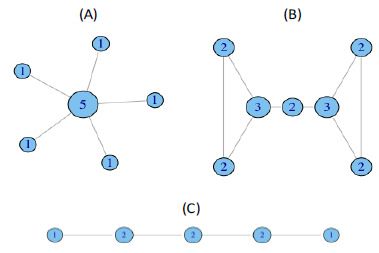
Figure 1 Degree Centrality
Figure1 showing different topologies with different values of degree, and it is observed that start
topology has the highest degree of centrality which is Figure A. The more edges connected to the
node the higher degree of centrality. High degree indicates importance of the node in the network,
but if all node only connected to one node, which made this node high degree, but the graph is not
well connected. An explanation of the above, if a node with five connections as shown in Figure
A, has degree of five while the other nodes have degree of one because they all have one
connection only, it made the graph low connectivity, because if a node was damaged the graph
will be disjointed graph. For this reason, calculating the graph connectivity giving greater value to
evaluate the graph, Freeman’s formula and centrality degree variance used for this purpose.
Equation 2[15]
Equation 3[16]
Equation 2 has calculation of the variance between each node centrality, whereas equation 3 is
Freeman’s formula, which has range from 0, to 1. Degree variance calculated as following: the
difference between degree of centrality and the mean square divided by number of nodes.
Freeman’s formula is calculated as following: the summation of difference between the maximum
degree of centrality and the degree centrality of each node on the network divided by sample size.48 Computer Science & Information Technology (CS & IT)
3.1.2 Closeness centrality
Closeness centrality is value of the distance of one node to other nodes in the network, it is
calculated as the inverse of the summation of the distances between a node to other nodes in the
network.
Equation 4[16]
Closeness measures how much nodes are reachable, and the possibility that nodes to be connected
to each other. The higher closeness between nodes means the nodes are well connected, however,
the lower closeness between the nodes means they may some disconnects between the nodes in
the network, or the distances between the nodes are big.
3.1.3 Betweenness centrality
Betweenness centrality presenting the number of frequency that a node is between other nodes in
the geodesic paths. Equation 5is calculating the betweenness, where gjk is the number of
geodesics between jk, and gjk (ni) is the number that actor i is on network [16]. Equation 6 is the
normalized version.
Equation 5[16]
Equation 6 [16]
Betweenness measures the nodes that all shortest paths cross from them, which indicates an
important node, if this node attacked it may damage the network.
4. FRAMEWORK
This section describes the framework approach of the solution provided, including the
methodology and the tools used, how they are utilized to achieve their purpose.
4.1 Introduction
This research proposes a framework to analyze and extract intelligence from social media
contents such as Twitter posts. The framework will be using powerful tools designed for the big
data analytics such ELK (elasticsearch, logstash, kibana) cluster, and Neo4j graph associations
and relationship diagram. The framework will include key features for data visualization,
discovery, exploration, and analysis. This solution built to facilitate data search and filtering,
moreover, it’s suggesting methodologies to detect the crime activity and predict criminals basedComputer Science & Information Technology (CS & IT) 49
on Twitter data. The methodology used in this study begun with having predefined people
accounts or hashtags that are related to crime, and originated from locations in the UAE. The
collected data related to historical data of criminals who were arrested due to Twitter activity.
They are several techniques applied to identify the people who may related to these communities:
sentiment analysis, account classification techniques and graph analysis were applied to detect
and help to predict the suspicious communities. The results of this analysis were validated with
another data source and tool with successful outcomes.
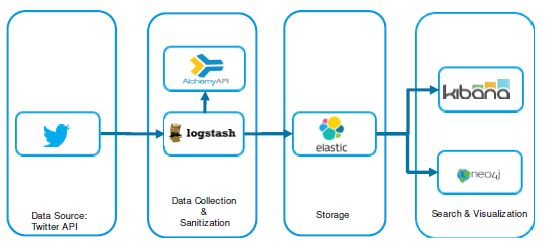
4.2 Framework Structure
The framework consists of four main components; data collection, storage, and search and
visualization. The framework includes two types of analysis, statistical and network analysis. The
reason why we have considered network analysis is, statistical analysis can capture significant
information about the users, the tweet information, most and least important aspects with respect
to Twitter attributes; however, statistics cannot define the relationship between users and possible
relations which are important for investigator or analyst to find, such as: the relationship between
the people and define the community of suspicious communities.
Figure 2 Framework
4.2.1 Tweets Collection
Twitter Developer API used to collect tweets with certain settings Twitter API allows developers
to pass keywords of interest to limit the collection of interest. This API collects only 10 percent of
random tweets, the process of collection started on Dec 14, 2016 to Feb 24, 2017, with collection
of 68,438 hits. The keywords used are hashtags of UAE activist and hashtag of Daesh
and some related keywords in Arabic, and geo locations in the UAE, adopted from [3] getting
related keywords, and locations, by using content feature of Twitter. The collection was random
during the day, nights and mornings.
The first few weeks of collection it was rarely to find tweets with geo location, when the
collection was based on keywords of hashtags and usernames only. Then, geo location passed
into the keyword fields and started collect more tweets with geo location information. Even
though the locations specified on the keywords was based on the UAE, there were some tweets50 Computer Science & Information Technology (CS & IT) collected from other locations on the map. It seems that Twitter used keywords with OR conditions, to get more results related to at least one of the keyword. 4.2.2 Logstash Logstash is an open source solution works as an engine that can collect data on a real time pipeline capabilities [18]. It can normalize, unify and sanitize the data into other formats. These capabilities enable Logstash to do log and events collection, the beauty of Logstash lie on the supported input and output plugins which facilitate the data ingestion and data analysis. The collection is established by configurable inputs, which can be different type of data such as network streaming events, or some files. The configuration allows the data to be filtered, to eliminate unnecessary data. Finally, output configuration to pass the data into other files to store. 4.2.3 Sentiment analysis The sentiment analysis is used to detect the polarity of the text emotion, positive, negative and neural. The positive means that the person is happy, whereas negative indicates that the person is unhappy or angry, when the text detected neither positive or negative criteria was succeeded, it is considered as neural. Having this methodology is not to find out the happy criminals on Twitter, combination of hashtag analysis with sentiment analysis can obtain the supporter, or welling to be, or is belongs to suspicious community. Sentiment analysis has shown successful results on predicting elections in other researches [9][10][11]. In this research sentiment analysis with hashtag analysis can filter the community of interest in crime activity, this facilitate for the investigator the way of extracting the community as first step. The technique used for sentiment analysis is Alchemy API from IBM. 4.2.4 Elasticsearch Elasticsearch is an open source engine, to organize data and make it accessible for search, and support queries to search with aggregation with near real time processing [18]. Elasticsearch supports system distribution which can utilize shards and replicas, via routing and rebalancing of data and processing. It is integrated with Logstash as ELK cluster for analytics of data collection and log parsing. 4.2.5 Kibana Kibana is an open source analytics and visualization platform intended for ELK cluster, to visualize Elasticsearch queries for the end user. It supports real time visualization of queries with aggregation and with near real time latency. Moreover, Kibana supports different types of charts, and tables used to build dashboard easily [18]. 4.2.6 Neo4j Neo4j is NoSQL graph database that is implemented using java and Scala, it implements property of graph model and storage as well. Moreover, Neo4j provides database characteristics including ACID transactions, clustering, runtime failover
Computer Science & Information Technology (CS & IT) 51
4.2.7 Neo4j Schema
The designed model represented the user as an actor who has the role of performing multiple
actions such as tweets, retweets, tags, and mentions, the related actions are linked to one or more
tweet, Figure 3 is illustrating the relationships
.
• Posts: A user posts a tweet
• Mentions: A tweet mentions one or more user
• Replys to: A tweet replays to a tweet
• Retweets: A tweet retweets another tweet
• Tags: A tweet tags one or more hashtag
Figure 3 Neo4j Twitter Graph
5. ANALYSIS
This section explains the analysis used in the study, statistical analysis and network analysis. The
Statistical analysis provides indication of the account type identification and the activity level as a
first level of examination while network analysis adding more refined analysis about the
relationship between the main player of the Twitter network which will be explained later.
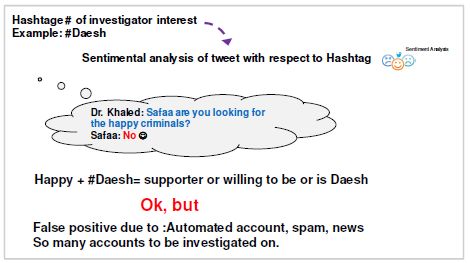
Figure 4 illustrates an overview of what investigator will be concerned about, as the first point of
interest will be searching for people who are interested in a topic like Daesh, and sorting them
down by their impression about this hashtag, using the sentimental analysis, having this can give
the investigator some sort of solution, but there are still some challenges that may face
investigators such as false positive and false negative account investigation, therefore, we have
introduce some statistical analysis which will help reducing this problem. The second point of
interest will be identifying the relationship between people and predicting the people who may
cause crime by analyzing Twitter network, which will be explain in the next section, network
analysis.52 Computer Science & Information Technology (CS & IT)
Figure 4 Analysis Approach
5.1 Statistical Analysis
The statistical analysis based on statistical methods applied to some of Twitter features or data,
which will interest investigator or analyst to consider. We have adopted some criteria that was
applied in the previous research areas[3],[6], [8]. Most researchers have used Twitter features for
to conduct statistical results that can be obtain predictions. In this section will well be exploring
multiple inputs that can support examining user’s accounts, having multiple methods can increase
the confident level on the prediction.
5.1.1 User classification analysis using activity level inspection
Investigator must have clear profile information about the person to be investigated on, user
classification is a key factor for analyzing personals of suspicious activity, and helping the agent
to better known false positive account for elimination from the suspicious domain. We have
adopted Zhang and Paxson methodology in classifying the automated accounts and non-
automated accounts. Automated accounts are known for tweets generated from another source
that a person does, such as: APIs, RSS feed. In the experiment, we have inspected the level of
activity of two accounts were from top twenty-five accounts tweeting with hashtag Daesh in
Arabic, and with positive sentiment results “11119aass”, and “justasender”, Figure 5 is showing
how is the behavior of account. “justasender” From the figures, it is clearly shown that patterns
should be eliminated from the analysis due to automation detection.
Figure 5 Justasender AccountComputer Science & Information Technology (CS & IT) 53
5.1.2 User classification analysis using account verification attribute
Another area that used to analyze user profile, is validated accounts and non-validated accounts,
similar results are showing with the research conducted by [6]. Lower number of verified
accounts compared with non-verified accounts, with percentage of 2.04%, 97.96 consequently.
During the user classification analysis, while sorting the verified accounts, it was clear that most
verified accounts belongs to news or organizations, aa [6] they found in their result, an example;
for top twenty-five accounts, "Sharjah24" which is an account for news and, "uaefa" account for
UAE football association official Twitter account.
5.1.3 User classification analysis using account age and history
Adopting from [3], user feature such as: age of the account give the investigator degree of
credibility, in how much trust should consider this account has valid information. In addition,
having the number of follwers, and friends, giving an idea how much this account is popular and
can be an influencer account as well.
Figure 6 User profile information
Figure 6 is showing how the investigator can get the account information such as: number of the
followers, the tweets, and friends of this account, moreover, the account creation date.
5.1.4 User classification analysis using tweet source inspection
Tweet sources evaluation have contributed on classifying the accounts, it has been shown that
tweets which are generated by a third-party application or an API and having a higher proportion
automated account in [6], [8], also with the sample used for this research it is found that people
are using more phones, tablets or integrated API with other social media application like
Facebook or Instagram to post tweets, organizations or other automated accounts use APIs to
generate their tweets.
5.1.5 User classification analysis using account mentions and posts behavior
As [8] found comparing the communication of the tweets, finding that people are posting tweets
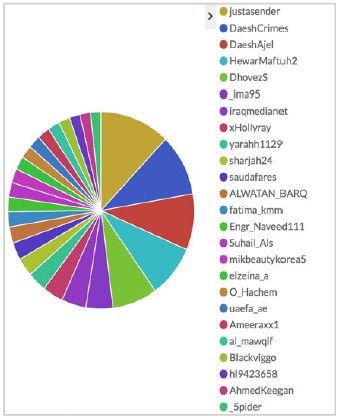
with mentions and replays more that organization. When comparing the top twenty-five active
posting account and top mentioned accoutns, it shows that top active posting account belong to
organization or news, however, top twenty-five mention screens belong to people who may have
more influence in Twitter network54 Computer Science & Information Technology (CS & IT)
Figure 7 Top 15 Active account by number of posts
5.1.6 User classification analysis using sentiment analysis
When applying sentiment analysis of the total volume of the tweets generated with verified and
non verified accounts, it displays that people have more positive and negative, that neural, on the
other hand, organizations and automated accounts have more neural with 15 percent in deference,
this also was observed in [7]. Usage feature of Twitter has significant impact on analyzing the
tweets importance evaluation, adopted from [2], having number of favorites and retweets shows
the invistigator how much enflunce has this tweet on the network.
5.1.7 Network Analysis
Each entity in the network represented by a node and each action initiating a relationship between
the nodes, section 4.2.7 explains how the schema built, and relationship implemented in the
framework. We have considered the results found in the literature for studying the network
analysis of Twitter network, most researchers have applied centrality measures to study the
behavior of the malicious nodes. Section 3 explains the concepts of network centrality and how it
is calculated. The network analysis can predict the suspicious nodes by calculating the centrality
of the bad nodes and the neighbor nodes, this can predict the direct and indirect communication
between the nodes. The results found that influencers of the network have the most centrality in
the network compared with other nodes.
5.1.8 Malicious Node Analysis
While statistical analysis can give indication of the nodes that needed to be examined, network
analysis can provide the relationships between each node. For this research, we have identified
malicious node as people who were arrested due to crime activity using Twitter network, UAE
activist who were arrested in 2012-2013, belonging to terrorist groups like Ekhwan, Eslah GroupComputer Science & Information Technology (CS & IT) 55
[19]. Most these accounts are inactive accounts, or suspended account, during the study, we have
found some active accounts.
5.1.9 Predicting the Suspicious Node in Twitter Network Based on Communication
Centrality
Nodes who are influencers in the network; are the ones that concern us, malicious nodes that were
explained previously found with high degree of centrality with communication relationships,
which made them influencer in the network. We have found that each of these accounts may
communicate to other similar nodes properties like, having high replys / mentions centrality, but
also, they may communicate with other accounts which are having less communication centrality,
but they also may communicate with unknown other high degree centrality, which indicate
indirect communication with nodes that did not seem to be suspicious in the beginning.
Figure 8 Network analysis to detect bad nodes
Figure 7 explains the above, the dotted line showing the indirect communication, red node is
malicious node, orange are suspicious nodes, green looks like the legitimate node. The next
subsections describe the methods to recover these nodes. We have considered replies, mentions,
posts, as type of communication which are more relevant to people communication with each
other in the Twitter network.
5.1.10 User Classification Analysis Using Account Mentions and Posts Degree Centrality.
Calculating the nodes centrality in the network is key starting point to identify the influencers of
the network, in this section, we have examined top ten largest centrality of the network based on
mention relationship and post relationship, the results are shown in the below tables. Comparing
the results with statistical analysis, both are showing the same results, section 5.1.5 pie charts are
presenting the same results, of count.56 Computer Science & Information Technology (CS & IT)
Neo4j Query: match(n:User)-[r:MENTIONS]-(m:Tweet) return n.username, count(r) as DegreeScore
order by DegreeScoredesc limit 10;
Neo4j Query: match(n:User)-[r:POSTS]-(m:Tweet) return n.username, count(r) as DegreeScore order
by DegreeScoredesc limit 10;
Figure 9 Degree centrality of posts relationship
5.1.11 Shortest Path Between Users with Respect to Mention Relationship (Betweeness)
Degree centrality calculates how much the node active in the network, in term of the number of
relationship the nodes have with other nodes, this cannot define the relationships, and the paths
between each node, while shortest path algorithms can calculate the possible paths between the
nodes, and the type of relationship needed to establish that relationship. The below query
calculates shortest path between Node A, and Node B with the mention relationship, the returned
values are the paths that connects these nodes together, which are the tweets between them.
Figure 10 illustrates the shortest path query results.
Neo4j Query: MATCH p=allShortestPaths((u:User{username: "A"})-[:MENTIONS*0..10]-(u2:User
{username: "B"})) RETURN p
The same approach can be applied with different types of relations like: reply, post, retweet, only
the type of relationship specified on the query changed.
Figure 10 Shortest Paths Between Two Users by Mention RelationshipComputer Science & Information Technology (CS & IT) 57
5.1.12 Shortest Path Between Users with Exhausted Search for All Paths Between Users
(Betweeness)
While the pervious method resulting valuable information, the investigator may not be sure the
kind of relationship that connects two or more nodes together, and need more like searching for
reachability between the users. Shortest path with exhausted search in all path find all relationship
between nodes in the Twitter network. This concept finds all relationship between suspicious
nodes in Twitter network.
Neo4j Query: MATCH (cs:User { username:"A" }),(ms:User { username:"B" }), p =
shortestPath((cs)-[*] (ms))WITH pWHERE length(p)>1 RETURN p;
5.1.13 Shortest Path between Users with Indirect Communication (Betweeness).
Shortest path between users who have indirect communication, this reveals indirect communi-
cation between nodes which can be suspicious.
Neo4j Query: MATCH (cs:User { username:"A" }),(ms:User { username:"B" }),(vs:User
{username:"C"}), p = shortestPath((cs)-[*]-(vs)) WITH p WHERE length(p)> 1 RETURN p
6. VALIDATION
Validation is very important step in any experiment, for this research we have used Matego, as
another tool of verification. Matego is a tool that is used for security reconnaissance that gather
information about a target, and it can relate the data together. During the study, we have found a
suspicious user account that was communicating with a known activist that was arrested in 2013,
we have inspected the suspicious user account to validate the result, using his email address, that
we have found it posted also in Twitter. We have found the user was communicating via email to
community that belongs to Daesh. While searching the emails that were found in the
communications, we have found that one of the emails posting in public blog some media related
to Daesh.
7. SYSTEM DESIGN & IMPLEMENTATION
This section demonstrates the design of building the framework solution, they are several
components to build this framework to execute each functionality of the framework. The main
functionality to of this system:
• The system should provide data collection
• The system should provide data parsing and indexing
• The system should provide data storage
• The system should provide visualization
• The system should provide analysis
7.1.1 Elasticsearchstack
Starting with the collection which is retrieved from Twitter API, the developer edition [20], then
indexing and parsing by Logstash, Logstash, is parsing the JSON files using Logstash template,58 Computer Science & Information Technology (CS & IT)
moreover, all tweets are sent to sentiment analyzer by AlchemyAPI. The output from
AlchemyAPI then sent to Logstash again to be inserted into the tweet information. Then it’s
indexed to Elasticsearch and stored. After that the data are ready to be analyzed by Kibana which
provides statistical views of the data. For this solution, the cluster installed in on one machine
having all the nodes installed with the following specifications:
• Elasticsearch-2.3.5
• Kibana-4.5.3-darwin-x64
• Logstash-2.3.0
• Python 2.7
• Py2neo 2.0.9
• Neo4j-community-3.1.0-rc1
• Alchemyapisdk
• Neo4j Cluster
Neo4j clustered with Elasticsearch to get the collected data to be pushed for Neo4j for node
analysis. The pushed data is JSON format, it’s also labeled and built into schema to build the
relationship between the tweets and the users. Python script is used to pull the data from
Elasticsearch, and display it on neo4j, it uses Elasticsearch library and py2nev.2.0.9. Logstash
Configuration
7.1.2 Visualization Using Kibana
Kibana allow building different dashboard and uses different type of graph such as pie charts, line
charts and bar charts. In addition, it also supports some aggregation functions and statistical
functions and prediction graphs. For this project, most the graph used are statistical graph with
the use of aggregations such as unique counts, or sum. Moreover, time series graph to provide
some prediction of the hashtags based on time. The following graphs are sample of dashboard
developed to analyze the overall collection such as the count of the hits, and language detected,
users’ analysis, content shared such as URLs and hashtags, moreover, map plotting the geo
location of the tweets with count.
7.1.3 Visualization Using Neo4j
Neo4j provides different level of abstraction for the searched query the following query provides
1000 nodes that have post relationship. Neo4j provides deeper level when double click into a
topology to find the related nodes: tweets and users and the relationship between them; which
help observation without a key search.
8. CONCLUSION
This research we demonstrate how social media can detect suspicious crime activity using Twitter
data for analytics. This solution is built to facilitate data search, filtering and suggest
methodologies to detect crime activity for investigators and intelligence entities. The paper
proposing a framework that utilizes big data capability tools, to process and analyze the data from
Twitter. This framework provides two ways of analytics, statistical and network analysis of
Twitter feature, sentimental analysis also provided to increase the quality of the data to beComputer Science & Information Technology (CS & IT) 59
inspected for investigation. We are exploring how these combined methods can perform real case
investigation with certain results, using another way for validation such as Maltego.
9. FUTURE WORK
For future work, we are looking for including weighted graph with the sentiment analysis result
combined, also the timestamp of the tweet, to enhance the searching result and pattern inspection,
which will also increase the accuracy and make the job more efficient. Moreover, including other
social media applications, to build better profile of criminals and influencers. Having more
techniques of prediction and include different ways of predictions to increase accuracy, such as
friend of friend, location of friends, location of the users. Having more analytic searching
methods, like searching by certain personality. In addition, including more case studies by
continuing searching and investigation, to have more trained data for machine learning.
ACKNOWLEDGEMENT
I would like to express my deepest sense of gratitude to.
• Dr.Damiani for his continuous supervision, guidance, encouragement and support
throughout the project.
• Dr. Khaled Salahfor his guidance and exceptional support.
• Dr.Nawaf Al Moosa for his guidance and exceptional support.
• Mr. Benjamin Hirsch for his supervision, assistance and valuable technical support
throughout the project
• Mr. Abdulrahman Al Remethi for his assistance and valuable technical support
throughout the project.
I would like to take this opportunity to thank my colleagues at the university and the staff in the
Information Security Department for their support.
REFERENCES
[1] “Twitter,” Sep 2014. [Online]. Available:
http://ezproxy.kustar.ac.ae/login?url=http://search.ebscohost.com/login.aspx?direct=true&db=ers&A
N=87323158&site=eds-live. [Accessed 25 Jan 2017].
[2] “Law enforcement uses social media in investigations infographic - LexisNexis,” 2017. [Online].
Available: http://www.lexisnexis.com/risk/insights/law-enforcement-social-media-infographic.aspx..
[Accessed 28 Jan 2017].
[3] R. Li, K. H. Lei, R. Khadiwala and K. C.-C. Chang, “TEDAS: A Twitter-based Event Detection and
Analysis System,” in 2012 IEEE 28th International Conference on Data Engineering, 2012.
[4] F. Chierichetti, J. Kleinberg and . R. Kumar, “Event Detection via Communication Pattern Analysis,”
in AAAI Publications, Eighth International AAAI Conference on Weblogs and Social Media , 2014.
[5] C. Christopher and D. N. Tobin , “Terrorism and Crime Related Weblog Social Network,” Link
Content analysis and information visualization, Vols. 1-4244-1330-3/07/ (2007), pp. 55-58, 2007.
[6] C. M. Zhang and V. Paxson, “Detecting and analyzing automated activity on twitter,” in In
Proceedings of the 12th international conference on Passive and active measurement (PAM'11),
Berlin, Heidelberg, 2011.60 Computer Science & Information Technology (CS & IT)
[7] J. Ratkiewicz, M. Meiss, B. Goncalves, D. Conover, F. Flammini and F. Menczer, “Detecting and
Tracking Political Abuse in Social Media,” in International AAAI Conference on Web and Social
Media Fifth International AAAI Conference on Weblogs and Social Media, North America, 2011.
[8] L. D. Silva and E. Riloff, “User Type Classificatin of Tweets with Implications for Even
Recognition,” in 2014 ACL Joint Workshop on Social Dynamics and Personal Attributes in Social
Media, Baltimore, MD, USA, 2014.
[9] J. Ramteke, S. Shah, G. Darshan and A. Shaikh, “Election result prediction using Twitter sentiment
analysis,” in Inventive Computation Technologies (ICICT), 2017.
[10] R. A. Bolla, Crime Pattern Detection Using Online Social Media, 2014.
[11] A. Bermingham and A. F. Smeaton, “ On using Twitter to monitor political sentiment and predict
election results,” in n: Sentiment Analysis where AI meets Psychology (SAAIP) Workshop at the
International Joint Conference for Natural Language Processing (IJCNLP), Chiang Mai, Thailand,
2011.
[12] M. Gerber, “Predicting Crime using Twitter and Kernel Density Estimation,” Decision Support
Systems (Elsevier) , vol. 61, no. http://dx.doi.org/10.1016/j.dss.2014.02.003, pp. 115-125 , 2014.
[13] R. YK Lau, M. Kamal H and M. I. Pramanik, Automatic Crime Detector: A Framework for Criminal
Pattern Detection in Big Data Era., 2016.
[14] H. Sarvari, E. Abozinadah, A. Mbaziira and D. Mccoy, “Constructing and analyzing criminal
networks.,” in Security and Privacy Workshops (SPW), 2014.
[15] L. Kaati, A. Rezine and A. Berzinji, “"Detecting key players in terrorist networks.", 2012 European.
I,” in Intelligence and Security Informatics Conference (EISIC), 2012.
[16] C. Mascolo, Social and Technological Network Analysis Lecture 3: Centrality Measures, University
of Cambridge.
[17] N. T. Inc., “Introduction to Graph Databases,” 25 Mar 2017. [Online]. Available:
https://neo4j.com/online_training/graphdatabases/?aliId=U2FmYWEgQWxkaGFuaGFuaS9zYWZhY
S 5hbGRoYW5oYW5pQGt1c3Rhci5hYy5hZQ%3D%3D. [Accessed 2017].
[18] elasticsearch, “Logstash Introduction,” 2017. [Online]. Available:
https://www.elastic.co/guide/en/logstash/current/introduction.html#introduction.
[19] A. Khoori, “Man jailed for spreading rumors that harmed UAE on social media,” 2017. [Online].
Available:http://www.thenational.ae/uae/man-jailed-for-spreading-rumours-that-harmed-uae-
onsocial-media. [Accessed 28 Jan 2017].
[20] Twitter, 2017. [Online]. Available: https://dev.twitter.com/. [Accessed 2017].
[21] Chaffey, “Global socla media reach 2016,” 2016. [Online].
Available:http://www.smartinsights.com/social-media-marketing/social-media-strategy/new-global-
social-mediaresearch/attachment/screen-shot-2016-02-15-at-11-54-57. [Accessed 25 January 2017].
[22] “Arab Social Media Report,” in Arab social media influencers summit, Dubai, 2015.
[23] A. Howard, A. Duffy, D. Freelon, M. Hussain, M. Mazaid and W. Mari, “Opening Closed Regimes:
What Was the Role of Social Media During Arab Spring?”.
[24] “A Facebook crime every 40 minutes: From killings to grooming as 12,300 cases are linked to the
site,” 2017. [Online]. Available: http://www.dailymail.co.uk/news/article-2154624/A-Facebook-
crime-40-minutes-12-300-cases-linked-site.html. [Accessed 26 26 2017].
[25] M. Nati, “9 Violent Crimes Posted to Social Media - ODDEE", Oddee,” 2017. [Online]. Available:
http://www.oddee.com/item_99740.aspx. [Accessed 27 Jan 2017].
[26] J. Gifford, “Loggy,” 2016. [Online]. Available: https://www.loggly.com/blog/scaling-elasticsearch-
formulti-tenant-multi-cluster/. [Accessed 2017].You can also read