Contact Graph Epidemic Modelling of COVID-19 for Transmission
←
→
Page content transcription
If your browser does not render page correctly, please read the page content below
Contact Graph Epidemic Modelling of COVID-19 for Transmission and
Intervention Strategies
Abby Leung, Xiaoye Ding, Shenyang Huang, Reihaneh Rabbany
School of Computer Science, McGill University
Mila, Quebec Artificial Intelligence Institute
{oi.k.leung, xiaoye.ding, shenyang.huang, reihaneh.rabbany}@mail.mcgill.ca
Abstract
arXiv:2010.03081v1 [cs.SI] 6 Oct 2020
The coronavirus disease 2019 (COVID-19) pandemic has
quickly become a global public health crisis unseen in re-
cent years. It is known that the structure of the human con-
tact network plays an important role in the spread of trans-
missible diseases. In this work, we study a structure aware
model of COVID-19 (CGEM). This model becomes simi-
lar to the classical compartment-based models in epidemiol-
ogy if we assume the contact network is a Erdős-Reńyi (ER)
graph, i.e. everyone comes into contact with everyone else
with the same probability. In contrast, CGEM is more expres-
sive and allows for plugging in the actual contact networks, or
more realistic proxies for it. Moreover, CGEM enables more
precise modelling of enforcing and releasing different non-
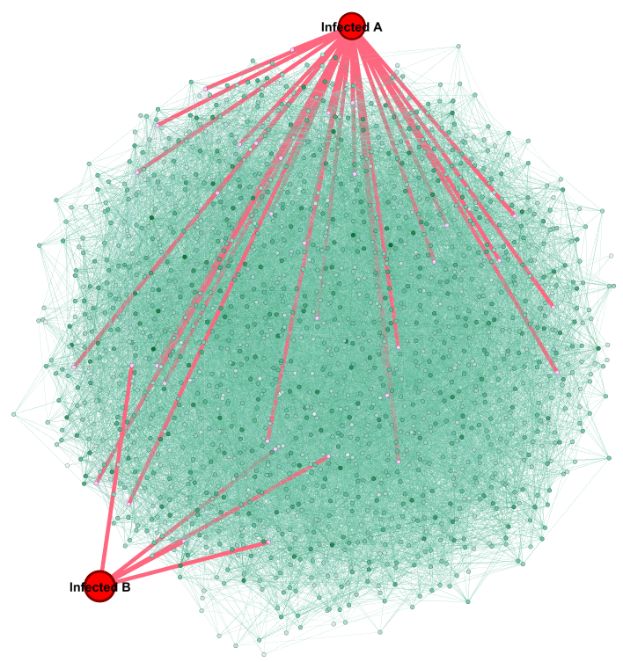
pharmaceutical intervention (NPI) strategies. Through a set Figure 1: CGEM can utilize realistic contact networks.
of extensive experiments, we demonstrate significant differ- Standard compartment models assume an underlying ER
ences between the epidemic curves when assuming different contact network, whereas real networks have a non-random
underlying structures. More specifically we demonstrate that structure as seen in Montreal Wifi example. In each network,
the compartment-based models are overestimating the spread two infected patients with 5 and 29 edges are selected ran-
of the infection by a factor of 3, and under some realistic as-
sumptions on the compliance factor, underestimating the ef-
domly and the networks in comparison have the same num-
fectiveness of some of NPIs, mischaracterizing others (e.g. ber of nodes and edges. In Wifi network, infected patients
predicting a later peak), and underestimating the scale of the are highly likely to spread their infection in their local com-
second peak after reopening. munities while in ER graph they have a wide-spread reach.
Introduction Non-pharmaceutical Interventions (NPIs) played a signif-
Epidemic modelling of COVID-19 has been used to in- icant role in limiting the spread of COVID-19. Understand-
form public health officials across the globe and the sub- ing effectiveness of NPIs is crucial for more informed pol-
sequent decisions have significantly affected every aspect icy making at public agencies (see the timeline of NPIs ap-
of our lives, from financial burdens of closing down busi- plied in Canada in Table 2). However, the commonly used
nesses and the overall economical crisis, to long term affect compartment based models are not expressive enough to di-
of delayed education, and adverse effects of confinement on rectly study different NPIs. For example, Ogden et al. (2020)
mental health. Given the huge and long-term impact of these described the predictive modelling efforts for COVID-19
models on almost everyone in the world, it is crucial to de- within the Public Health Agency of Canada. To study the
sign models that are as realistic as possible to correctly as- impact of different NPIs, they used an agent-based model
sess the cost benefits of different intervention strategies. Yet, in addition to a separate deterministic compartment model.
current models used in practice have many known issues. In One significant disadvantage of the compartment model is
particular, the commonly-used compartment based models its inability to realistically model the closure of public places
from classical epidemiology do not consider the structure such as schools and universities. This is due to the fact that
of the real world contact networks. It has been shown previ- compartment models assume that each individual has the
ously that contact network structure changes the course of an same probability to be in contact with every other individ-
infection spread significantly (Keeling 2005; Bansal, Gren- ual in the population which is rarely true in reality. Only by
fell, and Meyers 2007). In this paper, we demonstrate the incorporating real world contact networks into compartment
structural effect of different underlying contact networks in models, one can disconnect network hubs to realistically
COVID-19 modelling. simulate the effect of closure. Therefore, Ogden et al. (2020)
need to rely on a separate stochastic agent-based model to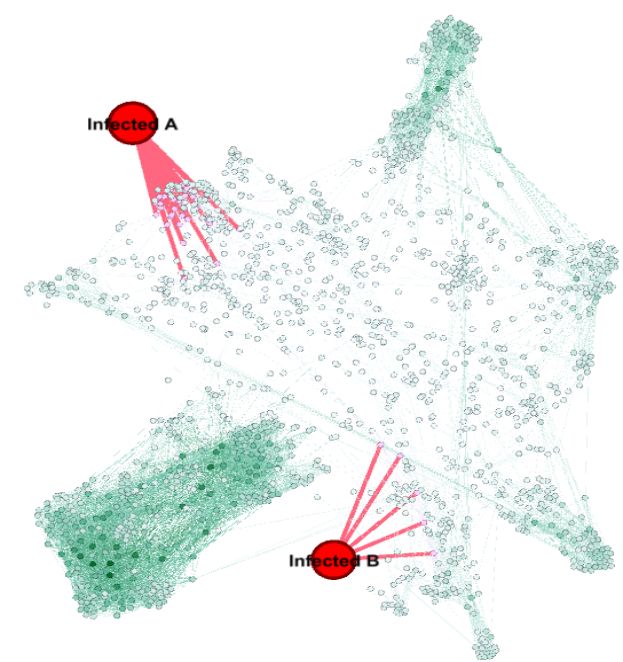
model the closure of public places. In contrast, our proposed     Date       Location      Event(s)
CGEM is able to directly model all NPIs used in practice          Mar. 11    [Worldwide]   WHO declares global pandemic
                                                                  Mar. 12    [QC]          returning travellers to self-isolate
realistically.
                                                                             [ON]          close public schools
   In this work, we propose to incorporate structural infor-      Mar. 13    [ON, AB]      cancel events > 250
mation of contact network between individuals and show                       [BC, MB]      cancel events > 250
the effects of NPIs applied on different categories of contact               [NS, NB]      discourage gatherings > 150
networks. In this way, we can 1) more realistically model         Mar. 14    [QC, ON]      ban visits to long term care facilities
various NPIs, 2) avoid the imposed homogeneous mixing             Mar. 15    [NS]          close schools, childcare, casinos
assumption from compartment models and utilize different                                   ban visits to long term care facilities
networks for different population demographics. First, we                                  ban gatherings over 150
perform simulations on various synthetic and real world net-      Mar. 16    [Canada]      close borders, excluding US.
works to compare the impact of the contact network struc-                    [Canada]      mandatory 14 days quarantine
                                                                             [QC]          close schools, universities, and daycares
ture on the spread of disease. Second, we demonstrate that
                                                                  Mar. 17    [ON, AB]      ban public events of over 50
the degree of effectiveness of NPIs can vary drastically de-                 [BC]          close schools, restaurants, and bars
pending on the underlying structure of the contact network.       Mar. 19    [NB]          close most businesses, gatherings ≤ 10
We focus on the effects of 4 widely adopted NPIs: 1) quaran-      Mar. 20    [Canada]      close boarder with US
tining infected and exposed individuals, 2) social distancing,    Mar. 23    [NS]          quarantine for domestic travellers
3) closing down of non-essential work places and schools,                    [Canada]      social distancing enforced
and 4) the use of face masks. Lastly, we simulate the effect                 [ON, QC]      close all non-essential workplace
of re-opening strategies and show that the outcome will de-       Apr. 6     [Canada]      advise to wear masks
pend again on the assumed underlying structure of the con-        May 22     [MTL]         allow outdoor gatherings ≤ 50
tact networks.                                                                             ease social distancing for some
                                                                  May 25     [MTL]         reopen shops with exterior entrance
   To design a realistic model of the spread of the pandemic,
                                                                             [QC]          reopen manufacturers without restrictions
we also used a wifi hotspot network from Montreal to sim-         June 15    [MTL]         reopen personal and aesthetic care
ulate real world contact networks. Given our data is from         June 22    [MTL]         reopen restaurants
Montreal, we focus on studying Montreal timeline but the          June 28    [MTL]         reopen educational childcare facilities
basic principles are valid generally and CGEM is designed         July 18    [QC]          reopen offices
to be used with any realistic contact network. We believe         Aug. 1     [QC]          allow indoor gathering ≤ 250
that CGEM can improve our understanding on the current            Aug. 5     [QC]          allow outdoor gathering ≤ 250
COVID-19 pandemic and be informative for public agencies
on future NPI decisions.                                         Table 1: Timeline of Canada COVID-19 selected NPI events
   Summary of contributions:                                     based on (Vogel 2020; Lawson et al. 2020)
• We show that structure of the contact networks signifi-
  cantly changes the epidemic curves and the current com-        design effective vaccination strategies based on real and di-
  partment based models are subject to overestimating the        verse contact networks. Various modifications are made to
  scale of the spread                                            the compartment differential equations to account for the
                                                                 network effect (Aparicio and Pascual 2007; Keeling 2005;
• We demonstrate the degree of effectiveness of different        Bansal, Grenfell, and Meyers 2007). Simulation-based ap-
  NPIs depends on the assumed underlying structure of the        proaches are often used when the underlying networks are
  contact networks                                               complex and mathematically intractable. Grefenstette et al.
• We simulate the effect of re-opening strategies and show       (2013) employed an agent-based model to simulate the dy-
  that the outcome will depend again on the assumed under-       namics of the SEIR model with a census-based synthetic
  lying structure of the contact networks                        population. The contact networks are implied by the behav-
                                                                 ior patterns of the agents. Chen et al. (2020) adopted the In-
Reproducibility: Code for the model and synthetic network
                                                                 dependent Cascade (IC) model (Saito, Nakano, and Kimura
generation are in supplementary material. The real-world
                                                                 2008) to simulate the disease propagation and used Face-
data can be accessed through the original source.
                                                                 book network as a proxy for the contact network. Social net-
                                                                 works, however, are not always a good approximation for the
                     Related Work                                physical contact networks. In our study, we attempt to bet-
Network Structures and Disease Modelling                         ter ground the simulations by inferring the contact networks
Different approaches have accounted for network struc-           from wifi hub connection records.
tures in epidemiological modelling. Degree block approxi-
mation (Barabási et al. 2016) considers the degree distribu-    Modelling Non-pharmaceutical Interventions
tion of the network by grouping nodes with the same degree       Table 2 shows the simulation of different NPIs in litera-
into the same block and assuming that they have the same         ture when compared to our model. Tuite, Fisman, and Greer
behavior. Percolation theory methods (Newman 2002) can           (2020) used an age-structured SEIR model to estimate the
approximate the final size of the epidemic for networks with     spread of COVID-19 in Ontario, Canada. When studying the
specified degree distributions. Recently, Sambaturu et al.       effect of NPIs, their key outputs included final epidemic at-
(2020) studied the EPICONTROL problem which aims to              tack rates (% of population infected at the end of the 2-year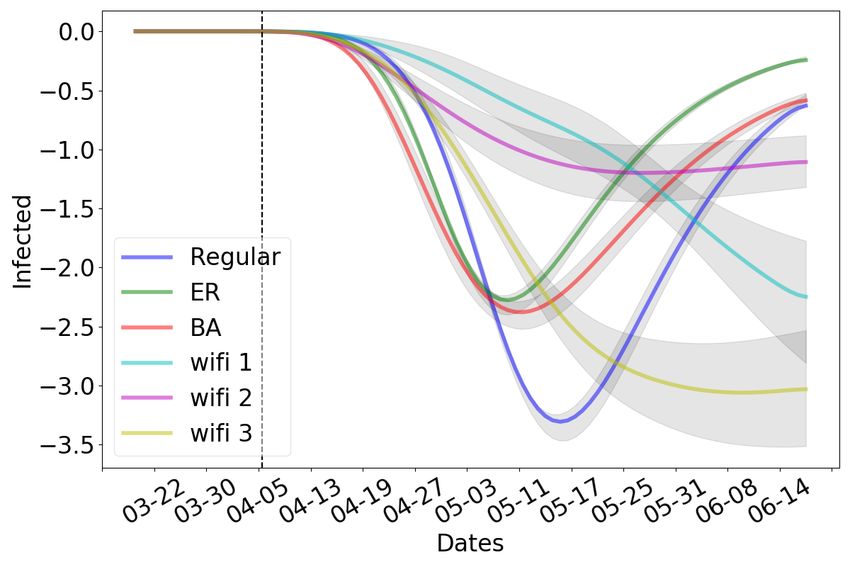
Social Distancing
dekar and Barbastathis 2020) are also proposed to estimate
Wearing Masks
the effectiveness of quarantine and forecast the spread of the
Quarantine
disease.
Closure
NPIs Methodology
Disease Models
Contact Graph SEIR
CGEM (ours) " " " "
Tuite, Fisman, and Greer (2020) " " In a classic SEIR model, referred to as base SEIR, the dy-
SEIR (Ogden et al. 2020) " " namics of the system at each time step can be described by
Agent-based (Ogden et al. 2020) " the following equations (Aron and Schwartz 1984):
Chen et al. (2020) " "
Reich, Shalev, and Kalvari (2020) " " dS
=−
βSI S
Ferguson et al. (2020) " " " dt N β
dE βSI E
= − σE
Table 2: CGEM can realistically model all NPIs used in dt N σ
practice while existing models miss one or more NPIs dI I
= σE − γI
dt γ
dR R
= γI
dt
period), prevalence of hospital admissions and ICU use, and where an individual can be in one of the 4 states: (S) sus-
death. They assumed the effect of physical-distancing mea- ceptible, (E) exposed, (I) infected and can infect nodes that
sures were to reduce the number of contacts per day across are susceptible, and (R) recovered at any given time step t.
the entire population. In addition, enhanced testing and con- β, σ, γ are the transition rates from S to E, E to I, and I to
tact tracing were assumed to move individuals with non- R respectively.
severe symptoms from the infectious to isolated compart-
Similarly, in CGEM, an individual can be either S sus-
ments. In this work, we also examine the effect of closure
ceptible, E exposed, I infected or R recovered. We do not
of public places which is difficult to simulate in a realistic
consider reinfection, but extensions are straightforward. Un-
manner for standard compartment models.
like the equation-based SEIR model which assumes homo-
Ogden et al. (2020) described the predictive modelling geneous mixing, CGEM takes into account the contact pat-
efforts for COVID-19 within the Public Health Agency of terns between the individuals by simulating the spread of a
Canada. They estimated that more than 70% of the Canadian disease over a contact network. Each individual becomes a
Population may be infected by COVID-19 if no interven- node in the network and the edges represent the connections
tion is taken. They proposed an agent-based model and a de- between people.
terministic compartment model. In the compartment model,
Algorithm 1 shows the pseudo code for CGEM1 . Given a
similar to Tuite, Fisman, and Greer (2020), effects of physi-
contact network, we assume that a node comes into contact
cal distancing are modelled by reducing daily per capita con-
with all its neighbours at each time step. More specifically,
tact rates. The agent model is used to separately simulate
at each time step, the susceptible neighbours of infected
the effects of closing schools, workplaces and other public
individuals will become infected with a transmission prob-
places. In this work, we compare the effects all NPIs used
ability φ, and enter the exposed state (illustrated below).
in practice through a unified model and show how different
We randomly select exposed nodes to become infected with
contact networks change the outcome of NPIs. In addition,
probability σ and let them recover with a probability γ.
Ferguson et al. (2020) employed an individual-based simu-
lation model to evaluate the impact of NPIs, such as quar- S
antine, social distancing and school closure. The number of E φ S
I
deaths and ICU bed demand are used as proxies to compare S
the effectiveness of NPIs. In comparison, our model can di- S
φ
rectly utilize contact networks and we also model the impact E I E
of wearing masks. Block et al. (2020) proposed three selec- φ
tive social distancing strategies based on the observations R
that epidemic dynamics depends on the network structure. S
The strategies aim to increase network clustering and elimi- CGEM offers the flexibility of accommodating different
nate shortcuts and are shown to be more effective than naive network structures and aligns better with the observation that
social distancing. Reich, Shalev, and Kalvari (2020) pro- people tend to interact with each other selectively and lo-
posed a selective social distancing strategy which lower the cally in the real world.
mean degree of the network by limiting super-spreaders. The
authors also compared the impact of various NPIs, includ- 1
For brevity, we use the same notation for both set and size of
ing testing, contact tracing, quarantine and social distancing. set, i.e. here S represents the number of susceptible in SEIR model,
Neural network based approaches (Soures et al. 2020; Dan- whereas in CGEM S represents the set of susceptible individuals.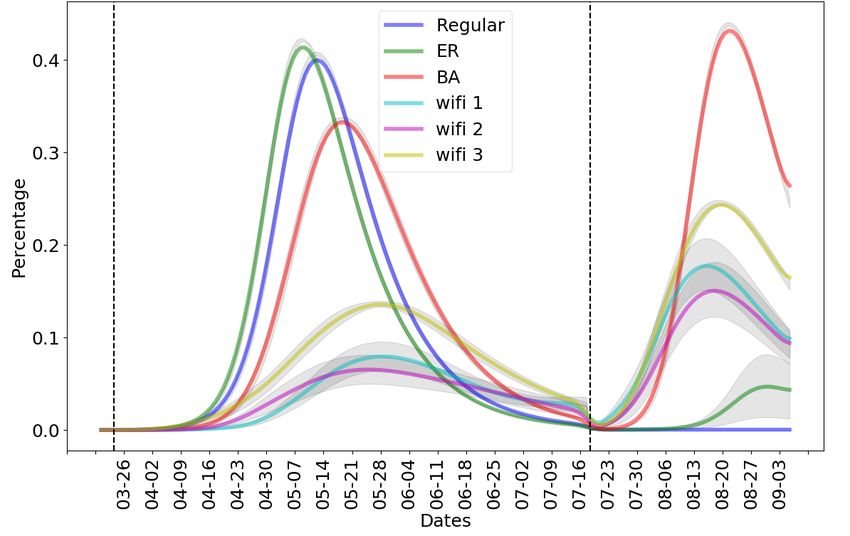
Input: Susceptible S, Exposed E, Infected I,                     3. Choose k = k ∗ which produce the best fit to the predic-
          Recovered R, transmission probability φ,                    tions of the classic SEIR model.
          incubation rate σ, recovery rate γ                          The regular random network with average degree k ∗
  repeat                                                           would be the contact network the classic SEIR model is ap-
     Contacts ← [];                                                proximating and φ∗ = β/k ∗ would be the implied transmis-
     for i in I do                                                 sion rate. We will use this transmission rate for other contact
          Contacts += neighbors(i);                                networks studied, so that the dynamics of the disease (trans-
     end                                                           missibility) is fixed and only the structure of contact graph
     ∆E ← [];                                                      changes.
     for c in Contacts do
          if c in S and random(0, 1) > φ then
                                                                   Tuning Synthetic Network generators As a proxy for
              ∆E += c;
                                                                   actual contact networks which are often not available, we
          end
                                                                   can pair CGEM with synthetic networks with more re-
     end                                                           alistic properties, comparable to real world networks e.g.
     ∆I ← randomly choose σ × |E| nodes from E;                    heavy-tail degree distribution, small average shortest path,
     ∆R ← randomly choose γ × |I| nodes from I;                    etc. To adjust the parameters of these generators, we can re-
     I ← I + ∆I − ∆R;                                              frame the problem as: given transmission rate φ∗ and pop-
     R ← R + ∆R;                                                   ulation size n, are there other networks which can produce
  until end of simulation;                                         the same infection curve? For this, we can carry out sim-
  Output: S, E, I, R                                               ilar procedures as above. For example, we can run CGEM
                Algorithm 1: CGEM                                  with transmission rate φ∗ over scale-free networks generated
                                                                   from different values of mBA , where mBA is the number
                                                                   of edges a new node can form in the Barabasi Albert algo-
Generalizing SEIR Model                                            rithm (Barabási et al. 2016). mBA which produces the best
CGEM provides a generalized version of SEIR model                  fit to the infection curve gives us a synthetic contact network
which allows plugging in different structures. How can we          that is realistic in terms of number of edges compared to the
draw connections between the parameters between the orig-          real contact network.
inal model and our graph-based model? On the infection
propagation process, the only parameter that differs from the      Modelling NPIs with Contact Graph SEIR
original model is the transmission rate, φ. Other parameters
are directly matched with the original model. On the struc-        Here we explain how different NPIs can be modelled di-
ture side, if substituting the ER graph with other synthetic       rectly in CGEM as changes in the underlying structure.
graphs, e.g. BA model (Barabási et al. 2016), the parame-
ters of the synthetic graph generation could be adjusted to        Quarantine How can we model the quarantining and self-
produce graphs with same sizes thus facilitating a fair com-       isolation of exposed and infected individuals? Exposed indi-
parison between different structures. We discuss details in        viduals have come into close contact with an infected person
the following sections.                                            and are considered to have high risk of contracting. In an
Inferring Transmission Rate By definition, β represents            ideal world, most, if not all, infected individuals would be
the likelihood that a disease is transmitted from an infected      easily identifiable and quarantined. However, in reality, over
to a susceptible in a unit time. Barabási et al. (2016) assumes   40% (He et al. 2020) of infected cases are asymptomatic and
that on average each node comes into contact with k neigh-         not all are identified immediately or at all and therefore can
bors, then the relationship between β and the transmission         go on to infect others unintentionally. To account for this
rate φ can be expressed as:                                        in our model, we apply quarantining by removing all edges
                                                                   from a subset of exposed and infected nodes.
                         β = hki · φ                        (1)
where hki is the average degree of the nodes.                      Social Distancing Social distancing reduces opportunities
   In the case of a regular random network, all nodes have         of close contacts between individuals by limiting contacts to
the same degree, i.e. hki = k and equation 1 can be reduced        those from the same household and staying at least 6 feet
into:                                                              apart from others when out in public. In CGEM, a percent-
                          β =k·φ                          (2)      age of edges from each node are removed to simulate the
   The homogeneous mixing assumption made by the stan-             effects of social distancing to different extent.
dard SEIR model can be well simulated by running CGEM
over a regular random network, we propose to bridge the two        Wearing Masks Masks are shown to be effective in reduc-
models with the following procedure:                               ing the transmission rate of COVID-19 with a relative risk
                                                                   (RR) of 0.608 (Ollila et al. 2020). We simulate this by as-
1. Fit the classic SEIR model to real data to estimate β.          signing a mask wearing state to each node and varying the
2. Run CGEM over regular random networks with different            transmissibility, φ, based on whether 2 nodes in contact are
   values of k and with φ derived from equation 2.                 wearing masks or not. We define the new transmission rate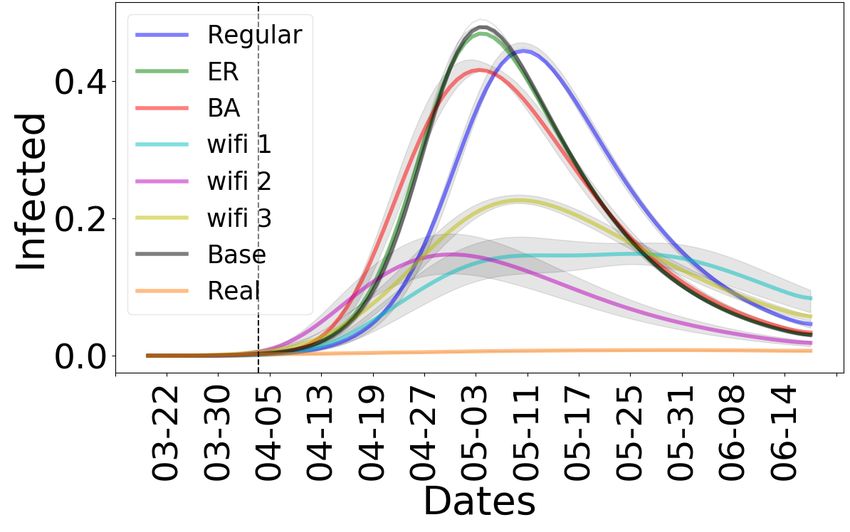
with this NPI, φmask as follows: between 110,000 to 220,000 edges, with the exception of
the USC network. Due to the aggregated nature of the USC
m2 · φ, if both nodes wearing masks dataset, edge sampling is enforced during the contact phase
φmask = m1 · φ, if 1 node wearing masks in order to obtain reasonable disease spread. The synthetic
m0 · φ, otherwise networks are in general more closely connected than the
Montreal wifi networks, despite having similar number of
Closure: Removing Hubs Places of mass gathering (e.g. nodes and edges. Only the largest connected component is
schools and workplaces) put large number of people in close considered in all networks.
proximity. If infected individuals are present in these loca-
tions, they can have a large number of contacts and very Network # nodes # edges Avg. shortest path
quickly infect many others. In a network, these nodes with a Regular 17,800 186,900 3.6
high number of connections, or degree, are known as hubs. Erdo Renyi 17,800 220,000 3.4
By removing the top degree hubs, we simulate the effects Barabasi Albert 17,800 160,000 3.2
USC 17,444 801,853 2.8
of cancelling mass gathering, and closing down schools and
Wifi 1 17,844 115,064 4.1
non-essential workplaces. In CGEM, we remove all edges Wifi 2 17,841 111,760 4.2
from r% of top degree nodes to simulate the closure of Wifi 3 17,889 176,893 4.9
schools and non-essential workplaces. However, some hubs,
such as (workers in) grocery stores and some government Table 3: Properties of the contact graphs studied
agencies, must remain open, so we assign each hub a suc-
cessful removal rate of psuccess to control this effect.
All Montreal and Quebec infection numbers are obtained
Compliance Given the NPIs are complied by majority but from Santé Montréal (Montréal 2020) and the Institut na-
not all the individuals, we randomly assign a fixed percent- tional de santé publique du Québec (INSPQ 2020) respec-
age of the nodes as non-compilers. We set this to 26% in all tivly.
the simulations based on a recent survey (Bricker 2020).
Model Param Type Value Description
Reopening Strategies S i 17,796 # initial susceptible nodes
E i 3 # initial exposed nodes
Due to the economical and psychological impacts of a com- I i 1 # initial infected nodes
plete lockdown on the society, it is critical to know how safe R i 0 # initial recovered nodes
it is to resume commercial and social activities once the pan- All σ c 1/5 transition rate E → I
demic has stabilized. Therefore, we also investigate the im- γ c 1/14 recovery rate
pact of relaxing each NPIs and the risk of a second wave n c 17800 number of nodes
infection. More specifically, we simulate a complete revers- φ f 0.0371 transmission probability
ing of the NPIs, by adding back the edges that were removed β f 0.78 transition rate S → E
when the NPI was applied at first, to return the underlying Regular k f 21 degree of each node
structure to its original form. ER PER f 0.0014 probability of an edge
BA mBA f 10 # edges on new node
Experiments Table 4: Parameters for CGEM, Type i, c, f stands for ini-
Dataset description tial, fitted, and constant parameters respectively. The values
We compare the spread of COVID-19 with synthetic and for constant parameters are set based on (who 2020).
real world networks. These networks include 3 synthetic net-
works, (1) the Regular random network, where all nodes
have the same degree, (2) the Erdős-Reńyi random net- Structures Changes the Epidemic Curves
work, where the degree distribution is Poisson distributed, The structure of the contact network plays an important role
(3) the Barabasi Albert network, where the degree distri- in the spread of a disease (Bansal, Grenfell, and Meyers
butions follows a power law. Additionally, we analyzed 4 2007). It dictates how likely susceptible nodes will come
real world network, the USC35 network from the Face- into contact with infected ones and therefore it is crucial to
book100 dataset (Traud, Mucha, and Porter 2012), consist- evaluate how the disease will spread on each network with
ing of Facebook friendship relationship links between stu- the same initial parameters. Here, the classic SEIR model is
dents and staffs at the University of Southern California in fitted against the infection rates from the first of the 100th
September 2005, and 3 snapshots of a real world wifi hotspot case in Montreal to April 4 to obtain β, which is before any
network from Montreal (Lenczner and Hoen 2015), a net- NPI is applied. With Eq. 2, the transmission rate, φ, is es-
work often used as a proxy for human contact network while timated to be 0.0371 and is used across all networks. In all
studying disease transmission (Hoen et al. 2015; Yang et al. experiments, we also seed the population with the same ini-
2020). In the Montreal wifi network, edges are formed be- tial number of 3 exposed nodes and 1 infected node. The
tween nodes (mobile phones) that are connected to the same parameters used to generate synthetic networks are obtained
public wifi hub at the same time. As shown in Table 3, each following the procedures described in the previous session.
of the 7 networks consist of 17,800 nodes, consistent with All results are averaged across 10 runs. The grey shaded re-
1/100th of the population of the city of Montreal, and have gion shows the 95% confidence interval of each curve.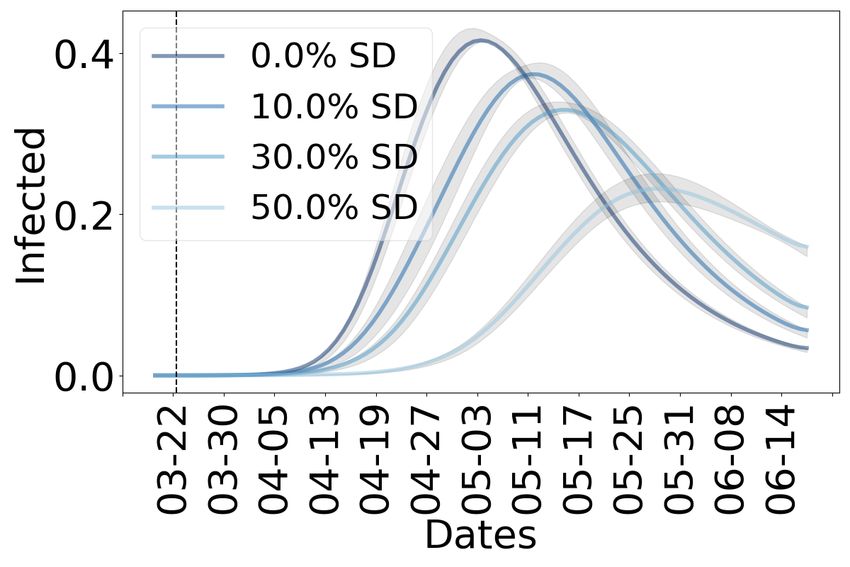
predicts, which is important information in planning for the
                                                                  healthcare system. Out of all tested NPIs, applying quar-
                                                                  antine has the most profound reduction on all infections
                                                                  curves.
                                                                  Observation 3 Quarantining delays the peak of infection
                                                                  on the ER graph whereas the peak on the real world graphs
                                                                  are lowered but not delayed significantly.

Figure 2: (left) projects spread of the pandemic on all
network structures without any NPI interventions. (right)
spread of the pandemic during the time period fitted to the
real data. The black dotted line indicates the date up to which
the infection rate of the synthetic networks is fitted against
the real world infection data, which coincides with the start
of closed down, first NPI, in real-world.
                                                                              (a) ER                       (b) Wifi 2

  As shown in Figure 2, the ER network fits the base              Figure 3: Results of applying quarantine to 50, 75, and 95%
SEIR model almost perfectly–compare green ’ER’ and black          of nodes on ER and wifi2 graph structures. Other wifi net-
’base’ curves.                                                    works show the same pattern and are omitted for brevity but
                                                                  are reported in the supplementary materials.
Observation 1 CGEM closely approximates the base SEIR
model when the contact network is assumed to be Erdős-
Reńyi graph.                                                     Social Distancing reduces the number of close contacts.
   All networks drastically overestimates the spread of           Different degrees of 10%, 30%, and 50% of edges from each
COVID-19 when compared with real world data. This can             node is removed to simulate this. Figure 9 shows the effects
be expected to some degree as in this experiment we are pro-      of social distancing on the infection curves of each network
jecting the curves assuming no NPI is in effect which is not      structures. It is effective in reducing the peak of the pan-
what happened in reality (see ’Real’ orange curve). How-          demic on all networks but again delays the peaks only on
ever, we observe that all 3 synthetic networks, including the     synthetic networks. Similar to Observation 3, we have:
ER model exceedingly overshoot, showing almost the entire         Observation 4 Social distancing delays the peak of infec-
population getting infected, whereas the real-world wifi net-     tion on the ER graph whereas the peak on the real world
works predict a 3x lower peak.                                    graphs are lowered but not delayed significantly.
Observation 2 Assuming an Erdős-Reńyi graph as the con-
tact network overestimates the impact of COVID-19 by more
than a factor of 3 when compared with more realistic struc-
tures.

Structure Changes the Effects of NPIs
In order to limit the effects of the pandemic, the federal and
provincial governments introduced a number of measures to
reduce the spread of COVID-19. We simulate the effects of 4                   (a) ER                       (b) Wifi 2
different non-pharmaceutical interventions, or NPIs, at dif-
ferent strengths to determine their effectiveness. These in-      Figure 4: Results of applying social distancing by removing
clude, (1) quarantining exposed and infected individuals, (2)     10, 30, and 50% of edges to all nodes on ER and Wifi2 graph
social distancing between nodes, (3) removing hubs, and (4)       structures. Same pattern is observed for wifi1 and wifi3 (ex-
the use of face masks.                                            tended results are reported in the supplementary materials).
Quarantine We apply quarantining into our model on
March 23. Where both Quebec and Canadian government               Removing Hubs We remove all edges from 1% of top de-
have asked those who returned from foreign travels or ex-         gree nodes to simulate the closure of schools and 5 and 10%
perienced flu-like symptoms to self isolate. We remove all        of top degree nodes to simulate the closure of non-essential
edges from 50, 75, and 95% of exposed and infected nodes          workplaces. These NPIs are applied on March 23 respec-
to simulate various strengths of quarantining. Figure 8 dis-      tively, coinciding with the dates of school and non-essential
plays the effect of quarantining on different graph structures.   business closure in Quebec. psuccess is set to 0.8 unless oth-
Quarantining infected and exposed nodes both reduces and          erwise stated. Figure 10 shows the effects of removing hubs.
delays the peak of all infection curve. However, the peak         This NPI is very effective on the BA network and all 3 Mon-
is not delayed as much in the wifi graphs as the ER graph         treal wifi networks since these networks have a power law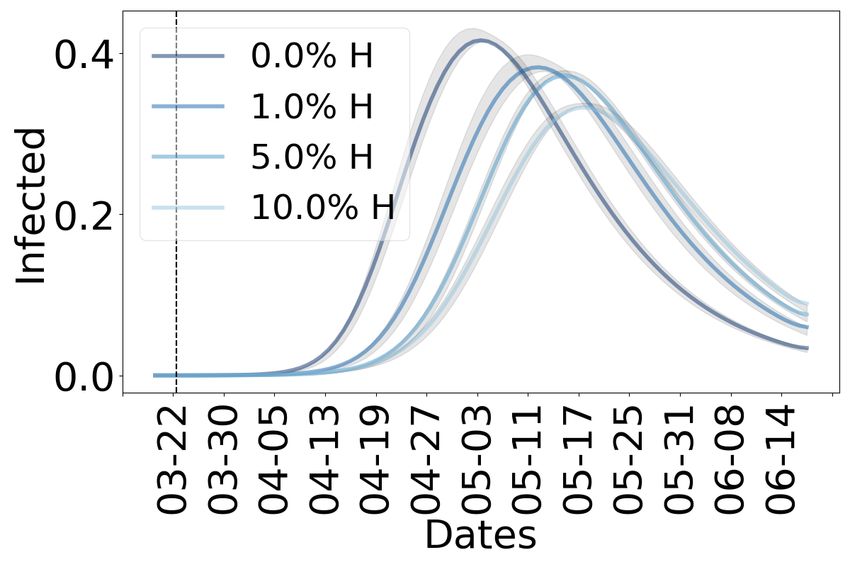
degree distribution and hubs are present. However, it is not
very effective on the regular and ER random networks.
Observation 5 The ER graph significantly underestimates
the effect of removing hubs.
(a) ER (b) Wifi 2 Figure 6: Difference between cumulative curves from wear-
ing masks and not wearing masks. The cumulative curves
Figure 5: Results of removing 1, 5, and 10% of hubs from represent the total impact, and the different shows how much
the ER and Wifi2 network. Again we see the same pattern drop in final attack rate is estimated with the NPI enforced.
on the other two Wifi graphs.
Removing hubs is most effective on networks with a
power law degree distribution since hubs act as super spread-
ers and removing them effectively contains the virus. How-
ever, no hubs are present in the ER and regular random
network, and thus removing hubs reduces to removing ran-
dom nodes. Luckily, real world contact networks have power
law degree distributions, making a hubs removal an effective
strategy in practice.
Wearing Masks we set m2 = 0.6, m1 = 0.8 and m0 = 1,
and use the following transmission rate, φmask in CGEM:
0.6 · φ, if both nodes wearing masks Figure 7: Reopening of 10% of hubs removed earlier. The
φmask = 0.8 · φ, if 1 node wearing masks first vertical line represents when the NPI was enforced and
1 · φ, otherwise the second vertical line shows when it is lifted.
Wearing masks is only able to flatten the infection curve
on the synthetic networks but does not reduce the final epi- statistics available in the real world data. Therefore the sim-
demic attack rate, the total size of population infected, as ulation continues after reopening with all the models hav-
shown in Figure 11. However, in the real world wifi net- ing the same number of susceptible individuals, otherwise
works, wearing masks is able to both flatten the curve and int the ER graph, everyone is infected at that point. We can
also significantly reduce the final epidemic attack rate. see in Figure 7 that ER and regular random network signifi-
Observation 6 The ER graph significantly underestimates cantly underestimates the extent of second wave infections.
the effect of wearing masks in terms of the total decrease in BA and the wifi networks all show second wave infections
the final attack rate. with a higher peak than the initial, prompting more caution
when considering reopening businesses and schools.
Structure Changes the Reopening Strategies Observation 7 ER graph significantly underestimates the
second peak after reopening public places, i.e. allowing
We experiment with reopening of all the NPIs, but for back hubs.
brevity we only report the results for allowing hubs, which
corresponds to the current reopening of schools and public
places. The results form other NPIs are available in the ex- Conclusions
tended results. In this paper, we propose to model COVID-19 on contact
For removing hubs, we apply reopening on July 18 (de- networks (CGEM) and show that such modelling, when
noted by the second vertical line in Figure 7), after many compared to traditional compartment based models, gives
non-essential businesses and workplaces are allowed to open significantly different epidemic curves. Moreover, CGEM
in Quebec. Because the synthetic networks estimates that subsumes the traditional models while providing more ex-
most of the population would be infected before the hubs pressive power to model the NPIs. We hope that CGEM
are reopened, we calibrate the number of infected and re- could be used to achieve more informed policy making when
covered individuals at the point of reopening to align with studying reopening strategies for COVID-19 .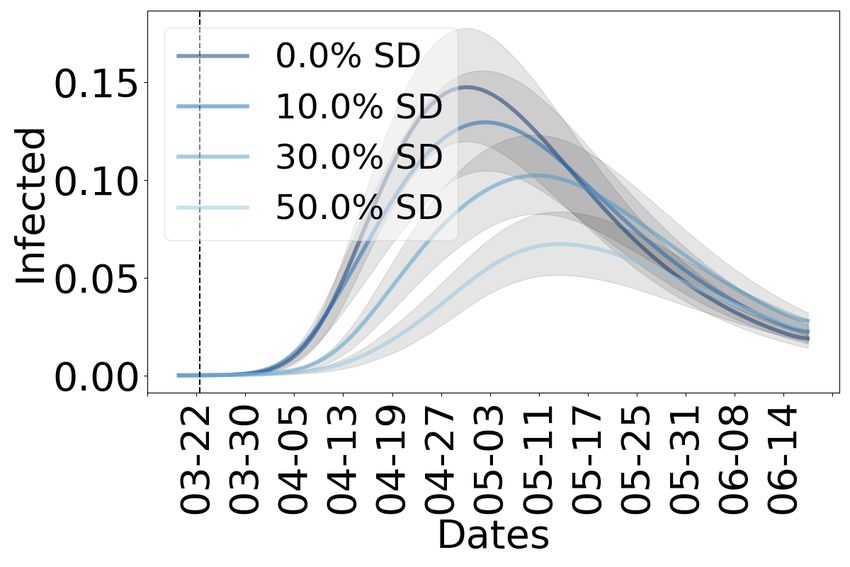
References                                Large Network. J Med Internet Res 17(7): e169. ISSN
2020.     Report of the WHO-China Joint Mission on               1438-8871. doi:10.2196/jmir.3720. URL http://www.jmir.
Coronavirus Disease 2019 (COVID-19).          URL https:         org/2015/7/e169/.
//www.who.int/docs/default-source/coronaviruse/who-              INSPQ. 2020. Données COVID-19 au Québec. Downloaded
china-joint-mission-on-covid-19-final-report.pdf.                from https://www.inspq.qc.ca/covid-19/donnees.
Aparicio, J. P.; and Pascual, M. 2007. Building epidemiolog-     Keeling, M. 2005. The implications of network structure for
ical models from R 0: an implicit treatment of transmission      epidemic dynamics. Theoretical population biology 67(1):
in networks. Proceedings of the Royal Society B: Biological      1–8.
Sciences 274(1609): 505–512.
                                                                 Lawson, T.; Nathans, L.; Hillstrom, M.; Fimiani, M.;
Aron, J. L.; and Schwartz, I. B. 1984. Seasonality and           and Gagne, E. L. 2020.         COVID-19: Recovery and
period-doubling bifurcations in an epidemic model. Jour-         Re-opening Tracker. https://www.mccarthy.ca/en/insights/
nal of theoretical biology 110(4): 665–679.                      articles/covid-19-recovery-and-re-opening-tracker.
Bansal, S.; Grenfell, B. T.; and Meyers, L. A. 2007. When        Lenczner, M.; and Hoen, A. G. 2015. CRAWDAD dataset
individual behaviour matters: homogeneous and network            ilesansfil/wifidog (v. 2015-11-06). Downloaded from https:
models in epidemiology. Journal of the Royal Society In-         //crawdad.org/ilesansfil/wifidog/20151106. doi:10.15783/
terface 4(16): 879–891.                                          C7H883.
Barabási, A.-L.; et al. 2016. Network science. Cambridge        Montréal, S. 2020.            situation of the coron-
university press.                                                avirus covid-19 in montreal.            Downloaded from
Block, P.; Hoffman, M.; Raabe, I. J.; Dowd, J. B.; Rahal,        https://santemontreal.qc.ca/en/public/coronavirus-covid-
C.; Kashyap, R.; and Mills, M. C. 2020. Social network-          19/situation-of-the-coronavirus-covid-19-in-montreal/.
based distancing strategies to flatten the COVID-19 curve in     Newman, M. E. 2002. Spread of epidemic disease on net-
a post-lockdown world. Nature Human Behaviour 1–9.               works. Physical review E 66(1): 016128.
Bricker, D. 2020. One Quarter 26 percent of Canadians            Ogden, N. H.; Fazil, A.; Arino, J.; Berthiaume, P.; Fisman,
Admit They’re Not Practicing Physical Distancing as              D. N.; Greer, A. L.; Ludwig, A.; Ng, V.; Tuite, A. R.; Tur-
Recommended. URL https://www.ipsos.com/en-ca/news-               geon, P.; et al. 2020. Predictive modelling of COVID-19 in
and-polls/One-Quarter-Of-Canadians-Admit-They-Are-               Canada. CCDR 46(6).
Not-Practicing-Physical-Distancing-As-Recommended.               Ollila, H. M.; Partinen, M.; Koskela, J.; Savolainen, R.;
Chen, Y.-C.; Lu, P.-E.; Chang, C.-S.; and Liu, T.-H. 2020.       Rotkirch, A.; and Laine, L. T. 2020. Face masks prevent
A Time-dependent SIR model for COVID-19 with unde-               transmission of respiratory diseases: a meta-analysis of ran-
tectable infected persons. arXiv preprint arXiv:2003.00122       domized controlled trials. medRxiv doi:10.1101/2020.07.
.                                                                31.20166116. URL https://www.medrxiv.org/content/early/
Dandekar, R.; and Barbastathis, G. 2020. Neural Network          2020/08/04/2020.07.31.20166116.
aided quarantine control model estimation of global Covid-       Reich, O.; Shalev, G.; and Kalvari, T. 2020. Modeling
19 spread. arXiv preprint arXiv:2004.02752 .                     COVID-19 on a network: super-spreaders, testing and con-
Ferguson, N.; Laydon, D.; Nedjati Gilani, G.; Imai, N.;          tainment. medRxiv .
Ainslie, K.; Baguelin, M.; Bhatia, S.; Boonyasiri, A.; Cu-       Saito, K.; Nakano, R.; and Kimura, M. 2008. Prediction of
cunuba Perez, Z.; Cuomo-Dannenburg, G.; et al. 2020. Re-         information diffusion probabilities for independent cascade
port 9: Impact of non-pharmaceutical interventions (NPIs)        model. In International conference on knowledge-based
to reduce COVID19 mortality and healthcare demand .              and intelligent information and engineering systems, 67–75.
Grefenstette, J. J.; Brown, S. T.; Rosenfeld, R.; DePasse, J.;   Springer.
Stone, N. T.; Cooley, P. C.; Wheaton, W. D.; Fyshe, A.; Gal-     Sambaturu, P.; Adhikari, B.; Prakash, B. A.; Venkatramanan,
loway, D. D.; Sriram, A.; et al. 2013. FRED (A Framework         S.; and Vullikanti, A. 2020. Designing Effective and Prac-
for Reconstructing Epidemic Dynamics): an open-source            tical Interventions to Contain Epidemics. In Proceedings
software system for modeling infectious diseases and con-        of the 19th International Conference on Autonomous Agents
trol strategies using census-based populations. BMC public       and MultiAgent Systems, 1187–1195.
health 13(1): 1–14.                                              Soures, N.; Chambers, D.; Carmichael, Z.; Daram, A.; Shah,
He, X.; Lau, E. H.; Wu, P.; Deng, X.; Wang, J.; Hao, X.; Lau,    D. P.; Clark, K.; Potter, L.; and Kudithipudi, D. 2020. SIR-
Y. C.; Wong, J. Y.; Guan, Y.; Tan, X.; et al. 2020. Temporal     Net: Understanding social distancing measures with hy-
dynamics in viral shedding and transmissibility of COVID-        brid neural network model for COVID-19 infectious spread.
19. Nature medicine 26(5): 672–675.                              arXiv preprint arXiv:2004.10376 .
Hoen, A. G.; Hladish, T. J.; Eggo, R. M.; Lenczner, M.;          Traud, A. L.; Mucha, P. J.; and Porter, M. A. 2012. So-
Brownstein, J. S.; and Meyers, L. A. 2015. Epidemic Wave         cial structure of Facebook networks. Physica A: Statisti-
Dynamics Attributable to Urban Community Structure: A            cal Mechanics and its Applications 391(16): 4165 – 4180.
Theoretical Characterization of Disease Transmission in a        ISSN 0378-4371. doi:https://doi.org/10.1016/j.physa.2011.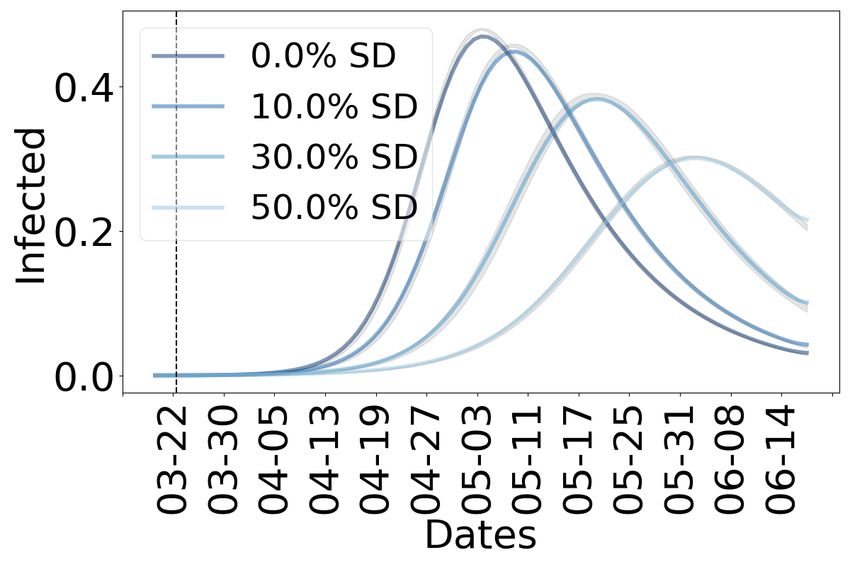
12.021. URL http://www.sciencedirect.com/science/article/          2. Symptomatic and asymptomatic individuals have the
pii/S0378437111009186.                                                same transmission rate and they quarantine with the same
Tuite, A. R.; Fisman, D. N.; and Greer, A. L. 2020. Math-             probability
ematical modelling of COVID-19 transmission and mitiga-            3. A certain percentage of the population do not compile
tion strategies in the population of Ontario, Canada. CMAJ            with NPIs regardless of their connection.
192(19): E497–E505.
                                                                   Structure Changes the Effects of NPIs
Vogel, L. 2020. COVID-19: A timeline of Canada’s
first-wave response.  https://cmajnews.com/2020/06/12/             Quarantine Figure 8 shows the results of quarantining
coronavirus-1095847/.                                              on all graph structures. Quarantining infected and exposed
                                                                   nodes both reduces and delays the peak of all infection
Yang, S.; Senapati, P.; Wang, D.; Bauch, C. T.; and Foun-          curve. However, the peak is not delayed as much in the wifi
toulakis, K. 2020. Targeted Pandemic Containment Through           graphs when compared to the regular and ER graphs.
Identifying Local Contact Network Bottlenecks.
                                                                   Social distancing Figure 9 shows the results of applying
                                                                   social distancing on all networks. Like quarantining, this is
                          Appendix                                 effective in reducing the peaks of the infection curve on all
Network generation                                                 networks, but the delay of peaks is only apparent on the syn-
                                                                   thetic networks.
Montreal wifi network 3 snapshots of the Montreal wifi
network are used in this paper with the following time pe-         Removing hubs Figure 10 shows the results of apply
riods: 2004-08-27 to 2006-11-30, 2007-07-01 to 2008-02-            school and business closure on all networks. The ER and
26, and 2009-12-02 to 2010-03-08. Each entry in the dataset        regular random networks significantly underestimates the
consists of a unique connection id, a user id, node id (wifi       effect of removing hubs.
hub), timestamp in, and timestamp out. Nodes in the net-           wearing masks Figure 11 shows the results of wearing
work are the users in each connection. An edge forms be-           masks and without on each network.
tween users who have connected to the same wifi hub at
the same time. Connections are sampled with the aforemen-          All NPIs Figure 12 shows the infection curves of all the
tioned timestamp in dates to obtain ∼ 17800 nodes. Since           networks with all NPIs applied. On March 23, 50% social
there are many disconnected nodes in the wifi networks, only       distancing and 50% quaranine is applied, and 10% of hubs
the giant connected component is used.                             are removed with a success rate of 0.8. Wearing mask is ap-
                                                                   plied on April 6. The wifi networks more closely resemble
Synthetic networks We compared CGEM with the wifi                  the shape of the real infection curve.
networks with 3 synthetic network models, the regular, ER,
and BA networks. In each of these models, we set the num-
ber of nodes to be 17,800 and fit respective parameters to
best match the infection curve of the base model and the
number of edges in the wifi networks. Table 5 shows the

                                   Range
     Model        Param                             best fit
                             begin       end
   Base SEIR        β         0.50       1.00         0.78
    Regular         k          18         23           21
      ER          PER       0.00130 0.00150         0.00140
      BA          mBA          5          15           10

             Table 5: Range of parameters fitted

range of numbers tested for each parameter and the fitted
values. All parameters are fitted to the officially reported in-
fected data and the mean squared error is minimized.

Computing Requirements
All the experiments have been performed on a stock laptop.

Assumptions
The following assumptions are made in CGEM:
1. Individuals who recover from COVID-19 cannot be in-
   fected again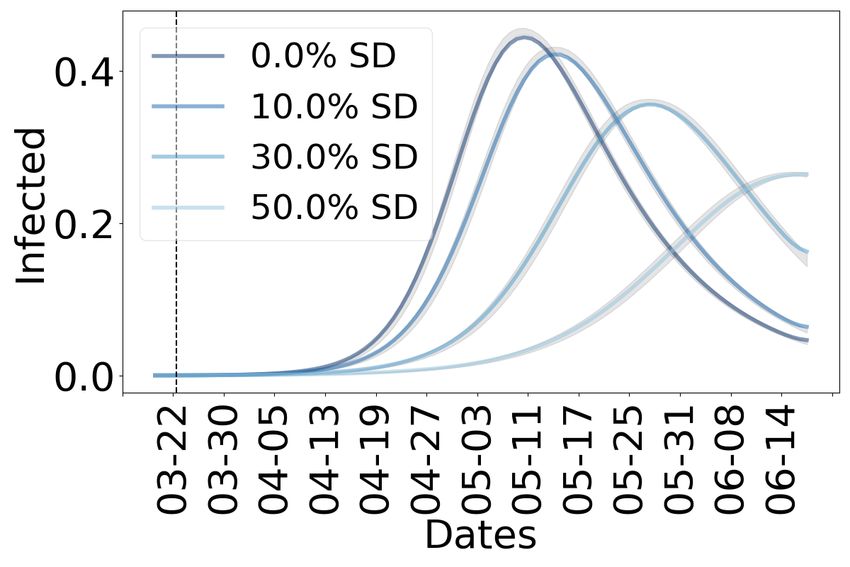
(a) Regular                                 (b) ER                                     (c) BA

              (d) Wifi 1                                (e) Wifi 2                                 (f) Wifi 3

        Figure 8: Results of quarantining 50, 75, and 95% of infected and exposed nodes on all graph structures.

             (a) Regular                                 (b) ER                                     (c) BA

              (d) Wifi 1                                (e) Wifi 2                                 (f) Wifi 3

Figure 9: Results of applying social distancing by removing 10, 30, and 50% of edges to all nodes on all graph structures.
(a) Regular (b) ER (c) BA
(d) Wifi 1 (e) Wifi 2 (f) Wifi 3
Figure 10: Results of removing 1, 5, and 10% of hubs from each network.
(a) Regular (b) ER (c) BA
(d) Wifi 1 (e) Wifi 2 (f) Wifi 3
Figure 11: Results of with and without masks.Figure 12: All NPIs applied according to the timeline in Ta- ble 2
You can also read