Forecasting e-scooter substitution of direct and access trips by mode and distance - arXiv.org
←
→
Page content transcription
If your browser does not render page correctly, please read the page content below
Forecasting e-scooter substitution of direct and access trips by mode
 and distance
 Mina Lee1, Joseph Y. J. Chow*1, Gyugeun Yoon1, Brian Yueshuai He2
 1
 C2SMART University Transportation Center, New York University Tandon School of
 Engineering, Brooklyn, NY, USA
 2
 Institute of Transportation Studies, University of California Los Angeles, Los Angeles, CA,
 USA
ABSTRACT
An e-scooter trip model is estimated from four U.S. cities: Portland, Austin, Chicago and New
York City. A log-log regression model is estimated for e-scooter trips based on user age,
population, land area, and the number of scooters. The model predicts 75K daily e-scooter trips in
Manhattan for 2000 scooters, which translates to $77 million USD in annual revenue. We propose
a novel nonlinear, multifactor model to break down the number of daily trips by the alternative
modes of transportation that they would likely substitute. The model parameters reveal a
relationship with direct trips of bike, walk, carpool, automobile and taxi as well as access/egress
trips with public transit in Manhattan. Our model estimates that e-scooters would replace at most
32% of carpool; 13% of bike; and 7.2% of taxi trips. The distance structure of revenue from
access/egress trips is found to differ from that of other substituted trips.

Keywords: e-scooter, micromobility, New York City, nonlinear multifactor model, trip
generation
1. INTRODUCTION

“Micromobility services” is a relatively new term (in the context of urban mobility) defined to
encapsulate the set of small vehicle shared mobility modes including electric scooters (e-scooters),
docked and dockless shared bikes, electric skateboards, and electric pedal-assisted (pedelec) bikes
(see Zarif et al., 2019). The e-scooter sharing system was introduced in 2017 as a new shared
mobility service in the United States (U.S.) and is now one of the fastest emerging micromobility
services. As of 2018, e-scooter sharing companies such as Lime and Bird operate in over 100 cities
around the world and have each been valued at over 1 billion USD in addition to receiving
hundreds of millions in funding from venture capitalists (Toll, 2018).
The growing popularity of this new mode of transportation can be accredited to its convenient
dockless system and small form factor for making short trips. Users only need to download a
smartphone application and locate a nearby scooter to start the ride. After reaching their destination,
users can park the scooter anywhere, instead of having to return to the original pickup location.
This dockless system has made the rental process smoother, enticing prospective users to test out
the technology and encouraging conversion to the service (Irfan, 2018). We propose a model to
forecast this new mode of transportation based on data from four U.S. cities and further propose a
nonlinear factor model to attribute this ridership to different existing access and direct modes by
distance to infer substitution effects.
The e-scooter sharing system has expanded so rapidly not only because of its low entry barrier,
but also because e-scooters are potentially filling a mobility gap in cities that have weaker public
transit infrastructure (Smith and Schwieterman, 2018). E-scooters can provide better access to
transit access points and offer an economical means to travel short distances as part of a Mobility-
as-a-Service (MaaS) system (Djavadian and Chow, 2017a). Furthermore, e-scooters offer
environmental advantages by reducing traffic congestion and fuel use, which can be a catalyst for
adoption in cities where automobiles are the most common mode of transportation.
Considering successful rollouts in major urban cities like Los Angeles, San Francisco, and
Washington D.C., New York City (NYC) is poised to be a major market for e-scooter sharing
services as millions of New Yorkers rely on public transit systems every day, with over 2.5 billion
trips made in 2018 (MTA, 2018) that can be complemented with e-scooter access. Posed as a
solution to the ‘last-mile’ problem (Djavadian and Chow, 2017b), e-scooter services can be
expected to not only expand accessibility to transportation services throughout the city but also
alleviate traffic congestion (Wondinsky, 2018). Similar micromobility services like Citi Bike (Xu
and Chow, 2019) have already created niche markets to serve in Manhattan: the average travel
time of Citi Bike rentals within 1.5 miles is 5 minutes faster and less expensive than taking a taxi
(NYC, 2016).
While the legality of e-scooters is varied throughout the U.S., growing demand has led many cities
to now consider legalization. For instance, in response to thousands of requests from the public,
cities like Portland, OR, and Baltimore, MD, designed and implemented e-scooter pilot programs
to test the potential impact on reducing pollution and congestion within their urban areas. In

 2
Portland, the promising results of the initial pilot program organized by the Portland Bureau of
Transportation (PBOT) prompted a second phase trial to improve public safety and develop
recommendations for permanent use (PBOT, 2018). Chicago proposed a second pilot program
following to the first trial in 2019 (BCDOT, 2019). Likewise, the NYC City Council has been
challenged by the demands of e-scooter users. As of April 2019, several bills were proposed to
legalize e-scooter services in NYC (Fitzsimmons, 2019). As of 2020, dozens of communities have
already started embracing e-scooter (seen as orange circles in this interactive map from the Bureau
of Transportation Statistics (BTS, 2020) in Figure 1).

 FIGURE 1. Interactive bikeshare and e-scooter map (source: BTS, 2020).

With such growth and interest from the private sector, policymakers clearly have a need to forecast
the potential demand for e-scooter trips. While predicting the demand for trips from
sociodemographic and trip data can be straightforward (e.g. Caspi et al., 2020), using that trip
demand to explain competition with existing trips is more elusive. The problem is that e-scooter
trips tend to be shorter in distance, and many may not even be used to substitute an entire trip from
origin to destination. Instead, e-scooters may be used to replace an access/egress trip to a public
transit stop.
This study addresses this research challenge and gap in the literature by forecasting the modal
substitution of e-scooter deployment in Manhattan. Three contributions are made. First, the e-
scooter trip demand in Manhattan is forecasted using a new trip generation model estimated from
data from e-scooter pilot programs in multiple cities. Second, we propose a novel, nonlinear,
distance-based factor model that distributes that demand into different fixed fractions of each mode
by distance. The model separates e-scooter trips into two types: competitive substitutions (direct
trips) and complementary substitutions (access trips). Lastly, the model is fit to the existing modal
trip landscape in Manhattan to uncover the modes most likely to be replaced by e-scooters and to
determine distributions of e-scooter trips by distance, by access or direct trip substitution, and to
forecast corresponding revenues.
 3
2. LITERATURE REVIEW

Although e-scooters have become increasingly popular in metropolitan cities, there exists limited
research due to the relative infancy of e-scooter data, in contrast to ubiquitous bike sharing data.
Most research with e-scooter ridership data analyzed patterns from observed e-scooter ridership
data and the characteristics of riders. Degele (2018) pointed out that e-scooter riders in Germany
can be clustered by four customer segments based on their demographic characteristics and trip
attributes. Smith and Schwieterman (2018) analyzed the patterns of e-scooter trips in Chicago and
demonstrated the potential impact of e-scooters. Noland (2019) studied e-scooter data from
Louisville, Kentucky. Some other studies have been presented in multiple cities by their
departments of transportation through pilot programs (PBOT, 2018; BCDOT, 2019). A more
environmental-based analysis is presented about the positive effects of e-scooters on congestion
and pollution in cities (Hardt and Bogenberger, 2019). Zou et al. (2020) examined the travel
patterns observed on e-scooters in Washington, DC. None of these studies have estimated forecast
models for e-scooter ridership.
To estimate demand in different areas of transportation, trip generation regression models
(McNally, 2007) are useful tools because of their simplicity. To quantify relationships between
demographics and bike sharing ridership, some studies aggregate demographic variables for each
spatial area (Ranaiefar and Rixey, 2015). Munira (2017) showed that micromobility demand tends
to be attributed to several demographic and socioeconomic factors. Capital Bikeshare (2012)
discovered that demographic characteristics such as employment rate, education levels, average
age, and gender can be categorized in their user memberships. Hankey and Lindsey (2016)
demonstrated that pedestrian and bicycle traffic are mostly attributed to district characteristics like
high accessibility to jobs. Through this demographic perspective, clustering analysis regarding
socio-demographic properties and travel modes was suggested to improve public bike systems
(Geng et al, 2016). Likewise, a study about e-scooter sharing systems also considered the usage
patterns of e-scooters and the behavioral characteristics of riders. Observed e-scooter ridership
data from pilot programs in Portland and Baltimore are highly correlated to groups between 20-40
years of age (PBOT, 2018; BCDOT, 2019). McKenzie (2019) and Hosseinzadeh et al. (2020)
related e-scooter trips in one city to different built environment attributes. Bai and Jiao (2020) used
two cities’ data for a similar purpose. Caspi et al. (2020) developed a spatial trip prediction model
for e-scooters but did not relate those trips to substitution from other existing modes. Reck et al.
(2021) focused on competition between different micro-mobility options, but not other modes.
City mobility options include carpool, taxi, bike, walking, driving and public transit. If a new travel
mode becomes available, mode substitutions may occur. Recent research has looked at the impact
of a new mode like ride hailing on other modes (Gerte, 2019; Jin, 2018). Some studies in travel
behavior analysis relate socio-economic factors which can influence the transition from existing
modes to include the new micromobility service. For example, Yang et al. (2016) found that
current bike sharing users were often converted from existing nonmotorized transportation modes

 4
when a bike sharing program is introduced. Another study also claims that the choice of travel
between bike, automobile, and public transit is determined by sociodemographic characteristics
and one’s context (Yang et al., 2015). Likewise, Smith and Schwieterman (2018) discovered that
e-scooters would be a strong alternative to private automobile trips for short distances (between
0.5 and 2 miles). This supports Portland’s pilot findings that 34% of Portlanders would have
chosen motorized travel modes if e-scooters were not available (PBOT, 2018).
Due to convenience and ease of accessibility, micromobility services are often combined with
other travel modes in the main trip. With the success of bike sharing, bike-and-ride can be used to
substitute other access modes from and to public transit stations (Doolittle and Porter, 1994;
Shaheen, 2010). Travel choice models estimated by Fan et al. (2019) for first/last mile trips with
bike sharing systems found that bike sharing can take 45.9% of mode share for first/last mile trips.
They considered differences in choice behavior between various age groups and found young
adults differed from middle-aged individuals. Halldórsdóttir (2017) found that mode choices of
access/egress in Copenhagen are related to the travelers’ characteristics and the purpose of the trip.
From what we can observe, no demand model regarding e-scooter ridership has been investigated,
since the ridership data was barely available for public access. In NYC, the e-scooter ban in
Manhattan has further obfuscated ridership data. Even with the availability of ridership data, no
model has yet been developed to directly relate the impact of e-scooter deployment on existing
modes.

3. METHODOLOGY

The objective of this research is to uncover the determinants for the demand of e-scooters. Because
e-scooter ridership data in New York are not readily available to the public, the research design
involves a two-step approach: (1) estimate and apply a demand model to forecast the potential
demand in different zones within Manhattan; (2) estimate a nonlinear multifactor model to break
down that demand into different modal trips such that statistically-significant factors would
emerge. For example, based on the distribution of Citi Bike and taxi trip data, is it likely that e-
scooters would achieve 2% market penetration against the former and 4% penetration against the
latter? How much would these factors be affected by travel distance? The framework for the
methodology is highlighted in Figure 2. Details of the models are presented in subsequent
subsections.

 5
e-scooter trips

 Walk trips by 1 mi

 Sociodemographic Distance Walk trips by 2 mi
 Sociodemographic
 attribute 1 parameters …
 parameters

 Sociodemographic Transit trips by 1 mi
 attribute 2
 Transit trips by 2 mi
 … e-scooter trips
 Direct/access …
 probability
 Sociodemographic Auto trips by 1 mi
 attribute k
 Auto trips by 2 mi

 Modal market …
 penetration
 Trip demand Taxi trips by 1 mi
 model
 Taxi trips by 2 mi

 …
 Citi Bike trips by 1 mi
 LEGEND
 Citi Bike trips by 2 mi
 endogenous
 …
 exogenous

 Trip factor
 model
 FIGURE 2. Framework for research design.

The demand regression model is estimated from demographic attributes such as population and
employment because they tend to have a positive relationship with nonmotorized activity (Munira,
2017). A nonlinear regression model is then estimated with modal trips as independent variables
and the forecasted e-scooter demand as the dependent variable. The model multiplies the modal
trips with a probability that varies by distance. The probability represents the likelihood that e-
scooter ridership will draw from the competition of existing modes; as specified in the model, it
should either draw from direct trips or from the access modes to public transit. Estimation of the
model would then reveal the modal trips that contribute to e-scooter demand, the amount that they
would draw from, and how that amount varies by distance of the trip.

3.1 Data
We start with data from the e-scooter pilot programs that are arranged in three different cities:
Portland, Austin, and Chicago. First of all, PBOT organized the initial four-month pilot program
from July to November in 2018. The program has published an analysis report along with the

 6
survey data collected from e-scooter riders who had participated during this time. The survey
results inform the socio-demographic data of the participants, including income, age, purpose of
the ride, and alternative mode substituted by the trip (PBOT, 2018). The Portland survey data
provides a background regarding the riders and the characteristics of the trips: 30% of trips were
for commuting, whereas 28% were for pleasure or recreation. Some riders used e-scooters to
substitute for other modes of transportation, such as driving or walking. Riders in the age group of
20-50 made up 86% of Portland e-scooter riders.
Austin, Texas, started its own pilot program that ran between August and November 2018. The
Austin Transportation Department published a community survey report, which stated that Austin
residents, like their Portland counterparts, frequently used micro-mobility services for commuting,
recreation, and errands (CATD, 2019). Users also consider the micro-mobility service as a
substitute of walking, ride-hailing, carpooling and bicycle. Lastly, Chicago organized the e-scooter
pilot program between June and October in 2019, and 821K e-scooter trips were reported. Chicago
users took e-scooters most frequently during the evening rush period on weekdays and during the
afternoon period on weekends (CDOT, 2020).
By collecting data from various cities and time periods, we aim to create a general model that
considers the attributes of different cities. A model estimated from this data is introduced in Section
3.2. We used the 2017 American Community Survey (ACS, 2018) to obtain demographic and
economic statistics based on zip code (Towncharts, 2018). A variety of factors were collected as
potential independent variables. Some of the data is summarized in Table 1.
To obtain more similar population density levels at a similar scale, we chose to use Traffic Analysis
Zones (TAZs) instead of zip codes. We restrict the study area to districts in Manhattan which fall
under TAZ 1 to 318. NYMTC 2010/2011 Regional Household Travel Survey (RHTS) (NYMTC,
2011) collected sample trip data from the public in the New York Metropolitan Area. While the
modes have since expanded further, a validation study from He et al. (2020) comparing with the
2017 NYC Citywide Mobility Survey (CMS) found that they did not change that significantly
population-wide. This data provides origin-destination demand based on TAZ level and six
different trip modes. There were 5.842 million observed total daily trips in Manhattan in 2011, and
the mode shares of carpool, transit, taxi, bike, walk, and auto were 2%, 29%, 4%, 2%, 60%, and
4%, respectively. As we can see, Manhattanites traveling in the same borough mostly walk, with
only a very low percentage driving a car. The estimated model was then used to simulate the modes
of all the trips made in the synthetic population.

TABLE 1. Demographic statistics of each zip code in Portland, Texas, Chicago, and New York
 Portland
 Population density Population Income Area
 (N=28)
 Mean 5,803 28,152 61,998 9.71
 Minimum 62 4,396 32,276 0.25
 Maximum 15,785 50,320 94,192 64.33

 7
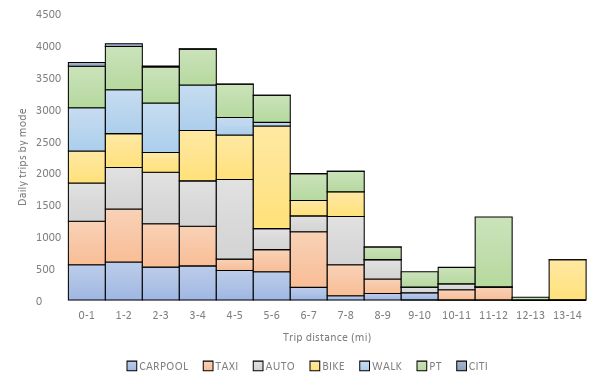
Austin
 Population density Population Income Area
 (N=36)
 Mean 3,685 31,212 75,316 18.51
 Minimum 98 1,815 19,188 1.51
 Maximum 15,462 89,830 150,000 104.97

 Chicago
 Population density Population Income Area
 (N=14)
 Mean 15,792 62,544 64,308 4.12
 Minimum 10,229 20,201 22,992 1.70
 Maximum 22,521 94,395 107,461 7.10

 New York
 Population density Population Income Area
 (N=28)
 Mean 81,009 37,317 100,189 0.50
 Minimum 5,484 1,324 27,932 0.01
 Maximum 159,898 94,382 250,001 1.45

Whereas the survey data offers travel data on the TAZ system, the ridership data estimated through
the regression model is based on zip code only. Thus, a mapping from the zip code level data to
TAZ level is made. For overlapping zones, we distribute the attributes by proportion of population
in each zoning system. Table 2 shows the summary of demographic statistics per TAZ in
Manhattan.

TABLE 2. Demographic statistics per each TAZ in Manhattan
 NY TAZ
 Population density Population Income Area
 (N=318)
 Mean 91,067 5,118 107,341 0.07
 Minimum 7 2 20,304 0.01
 Maximum 205,604 16,768 403,341 1.37

Trip distances for all modal trips except public transit were determined from the 2018 LION (NYC,
2018) road network. The public transit trip travel times were determined using a transit router
function (Balac, 2018) in MATSim with General Transit Feed Specification (GTFS) data from
2016 (TransitFeeds, 2019). The transit travel time includes egress, access, and transfer time.
Lastly, for the Citi Bike data, we obtained total trip counts from their website which publishes
daily ridership data, station locations, and travel times between stations (Citi Bike, 2018). The
locations of origin/destination stations are converted to TAZ level using QGIS. Some districts do
not have access to Citi Bike since there are no stations nearby. For this research, the average daily
ridership within Manhattan is collected based on the locations of origin/destination stations with
the same period of Portland and Austin’s pilot program (July to November 2018). The total number
of daily Citi Bike trips was 45K. The modal trip counts in Manhattan are summarized in Table 3
and by distance in Figure 3.

 8
TABLE 3. Modal trip counts in Manhattan used as independent variables for multifactor model
 Mode Data source Average Daily Count by TAZ Count Standard Deviation by TAZ
 Carpool 2011 RHTS 296 805
 Public transit 2011 RHTS 5,314 4,937
 Taxi 2011 RHTS 825 1,556
 Bike 2011 RHTS 350 693
 Walk 2011 RHTS 11,162 10,730
 Auto 2011 RHTS 661 1,446
 Citi Bike Citi Bike (2018) 122 157

 FIGURE 3. Average trips per zone per mode by distance.

3.2 Models
This section provides details on the specification and estimation of the two models.

3.2.1 Multivariate log-linear regression model for forecasting e-scooter trip demand
Based on Portland's pilot program data (PBOT, 2018), the e-scooter usage area was aggregated
from 28 zip codes in Portland. For the duration of the pilot period, the official total ridership of e-
scooters in Portland was 700K. In order to determine the ridership demand at the zip code level,
the daily ridership was distributed across the 28 zip codes by mapping out the percentage of riders
traveling through each zip code, which was retrieved from the routing data. For the ridership in
Chicago and Austin, we converted the ridership data, collected at the community level, into data
for individual zip-codes by mapping out the percentage of intersecting areas. The ridership
numbers in Chicago and Austin were recorded in 14 zip codes and 36 zip codes, respectively. This
total ridership for each city is broken down into daily trips depending on the duration of the pilot
program, which provides the average daily ridership.

 9
In order to estimate the travel demand model, the social, economic, and demographic data collected
from the survey was applied. Several demographic variables were considered, as shown in Table
4.
We tested non-linear models, such as exponential and polynomial models, as well as linear ones.
Among different models, we choose a multiple log-log regression model. This log-log linear
demand function is well-known to be suitable for econometric purposes, since it captures the
elasticities of each variable from the parameters of a driven demand model (Domencich et al.,
1968; Dritsakis, 2000). The parameters are estimated using ordinary least squares performed in R,
the statistical computing software.

TABLE 4. Candidate independent variables for trip-generation model
 Variables Description (units)
 Income The median household income of a neighborhood ($)
 Labor The average rate of labor force participation (%)
 Population The number of people living in a neighborhood
 Unemployment The average rate of unemployment (%)
 Population Density The population divided by the area of a neighborhood (/sqmi)
 Age Ratio The ratio of age from 20’s through 40’s in the total population
 Health Insurance The average percentage of health insurance holders (%)
 Land Area The land area (sqmi)
 Scooters The number of scooters provided in zone

 # !"#,% % = &'("# + ) ∙ ( ∗ ) + * ∙ ( ) + +
 (1)
 ∙ ( ) + %
where
 !"#,% is the total number of e-scooter trips generated in zone
 , is the constant and coefficients of the attributes, = { , , , }

The estimation results are shown in Table 5. All the coefficients were found to be statistically
significant and the R squared value of the model was 0.314, which is an adequate fit considering
the nonlinearity. A q-q plot and residual plot shown in Figure 4 further indicate the good fit of the
model.
Age group was one of the key factors of e-scooter demand, and this analysis duplicates the results
of the survey in Portland, showing that the targeted riders (ages 20 through 50) constituted a
significant portion of total ridership. Since the e-scooter service is only operated by smartphone
app, the requisite ownership of a smartphone can affect the usage of e-scooters. The percentage of
smartphone ownership in the targeted age group has increased to around 90% from 2016 to 2018,
whereas the age group of 50+ remains similar at 74% or less (Pew Research Center, 2018).

 10
TABLE 5. Summary of Statistics for log-linear multivariate regression model Variables Coefficient Std. Error t.value p-value !"#$% -7.929 4.6446 -1.707 0.0949∗ ' 0.573 0.2519 2.276 0.0278∗∗ ( -1.108 0.2690 -4.117 0.0002∗∗∗ ) 0.7812 0.2966 2.634 0.0116∗∗ *, **, and *** indicate statistical significance at the 0.1, 0.05, 0.01 levels, respectively. Summary of Fit Residual standard error: 1.416 p-value: 0.0008007 Multiple R-square: 0.3136 Observations: 44 Adjusted R-squared: 0.2668 F-statistic:6.7 (a) (b) FIGURE 4. (a) q-q plots of the e-scooter ridership by zip code in Portland and (b) Residual plots Additionally, we considered the accessibility and availability (the supply side) of the e-scooters. Each pilot program provided a different number of e-scooters, and the sizes of the areas in which the programs were conducted varied. Therefore, the number of scooters and the square mileage of the program’s coverage area could affect the accessibility of e-scooters. All variables are substantially significant to explain the model with p-values less than 0.05. In a log-log regression model, the coefficient of each variable represents an elasticity with respect to the dependent variable (see Benoit, 2011). We can use a coefficient to describe the impact of a percentage change in each variable. For instance, the elasticity of the population in the age group of those between 20 and 50 is 0.5, which demonstrates that increasing the population of the 20-50 age group by 10% increases the e-scooter ridership by 5%. Having estimated a good-fit model, we can now apply it to Manhattan to obtain the number of predicted e-scooter trips for each zip code assuming an e-scooter fleet of 2000. Manhattan’s 41 zip codes are further divided into TAZs, and we calculated the e-scooter ridership per zone, as shown in Figure 5. Our result was that the total daily forecasted e-scooter ridership was 75K, which is equivalent to about 1% of total combined modal trips within Manhattan. 11
(a) (b)
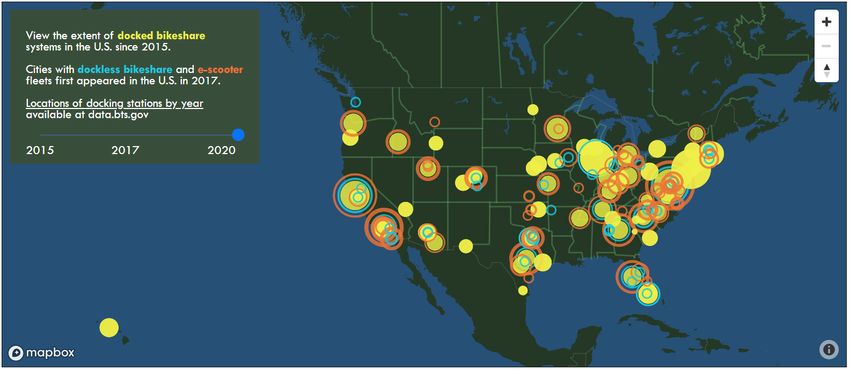
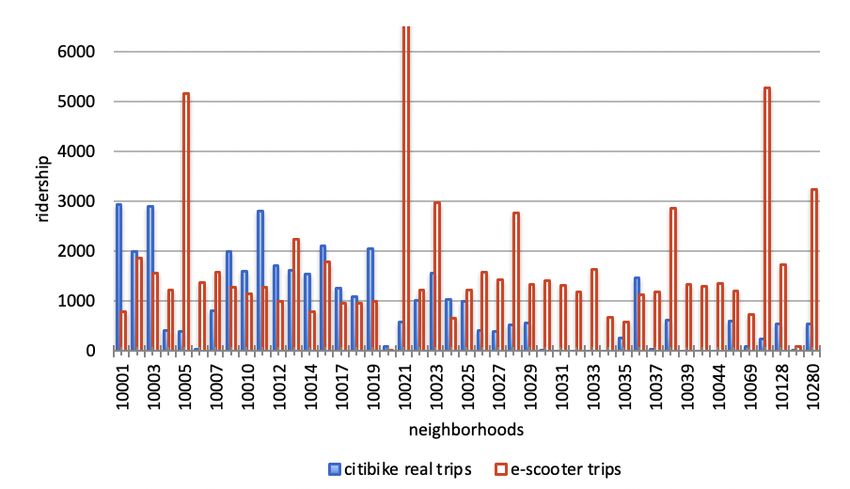
FIGURE 5. (a) E-scooter ridership per TAZ and (b) comparison of Citi Bike and e-scooter trips by zip code.
For comparison, the recent e-scooter pilot program with Lime in the nearby Hoboken, NJ (just
across the Hudson River from Manhattan), supplied 300 e-scooters (Hoboken Girl, 2019) and had
3.5K average daily trips (Hoboken City Hall, 2019). The number of dispatched scooters in the
other cities with pilot programs were 2K in Portland; 7K in Austin; and 2.5K in Chicago. If we
increase the total number of e-scooters, the e-scooter demand is projected to rise since the number
of e-scooters is positively related to the ridership.
A large portion of rides are projected to occur in the upper east side and lower Manhattan as shown
in Figure 5(a). Citi Bike, which is the most similar mode to e-scooters, had 45K total ridership
over the same period in 2018. The estimated e-scooter ridership is approximately 60% higher than
that of Citi Bike. The higher number can be explained by the fact that accessibility for Citi Bike is
more limited in some areas and dependent on availability of stations and bike lanes (Xu and Chow,
2019).
The difference is clearer when we observe Figure 5(b) showing ridership by e-scooters and Citi
Bike by zip code. Generally, e-scooter and Citi Bike ridership have similar geographical trends.
However, in areas where Citi Bike is not accessible (as shown by near zero ridership), e-scooters
are not restricted due to their dockless system.
Despite the similarities, we do not know where the 75K e-scooter trips would be drawn from,
whether it is replacing another direct mode like = { , , ,
, , } or replacing an access mode for public transit, or drawn from
latent demand. The next model explores this relationship.
3.2.2 Nonlinear Multifactor Model
We propose a novel nonlinear regression model as a type of multifactor model that breaks down
the e-scooter trip demand into the most statistically significant components. These components are
drawn as replacement trips competing against either direct trips for all modes ( -,% , ∈ , ∈ )
or access trips using public transit ( = { } ). The dependent variables are the
forecasted e-scooter trips per zone while the independent variables are the existing trips by mode.
12In designing the model, we hypothesize that distance should play an important role. Shorter
distance trips should be more likely to be replaced by e-scooters. For example, some pilot studies
already demonstrate the average distance of e-scooter ridership is typically less than 2 miles
(PBOT, 2018; BCDOT 2019). Existing e-scooter fee structure scales in proportion to duration,
thus the utility of e-scooter choice for longer trips is expected to be less than shorter trips (Smith
and Schwieterman, 2018). To capture this dependency, we propose a parameter . that varies by
distance category ∈ , where = {0 − 1 , 1 − 2 , 2 − 3 , … , 13 − 14 } , which is
used to quantify the percent of modal direct trips that are in competition with e-scooters. The modal
trips can be further segmented by distance category, -,%,. . We should see this parameter increase
when the distances of trips are shorter. We specify the following relationship in Eq. (2), where .
is a calibrated parameter set per distance category, and . is the average distance of trips made for
category .
.
. = (2)
.
Given the portion . of -,% that are subject to competition with e-scooters, another parameter set
is introduced to represent the proportion - of modal trips that would be replaced by e-scooters.
This proportion varies by modal trips but is fixed by distance. If the different modes contribute to
e-scooter trips differently, then - would vary across modes significantly. Lastly, a constant is
used to capture everything that cannot be controlled for: statistically insignificant trip fractions for
modes, induced demand, or tourists’ trips not captured by the 2011 RHTS trips.
For the trips that are not subject to competition with e-scooters (i.e. (1 − . ) -,% ), they generally
do not contribute to e-scooter trips, except for public transit. For the latter trips, e-scooter trips that
do not compete directly may still end up substituting the access trips. We propose that the fraction
0
/#,% of public transit trips subject to e-scooter competition with the access trips have a functional
form shown in Eq. (3) to be estimated, where %1 is the average access time (in hours) for trips to
public transit from zone ∈ and %2 are the corresponding average egress trip times into zone ∈
.
0
/#,% = 3 + 4 ∗ %1 + 5 ∗ %2 (3)
The final nonlinear regression model for substitutional ridership is shown in Eq. (4).
0
"67,% = + e - e . -,%,. + e(1 − . ) /#,% /#,%,. + % (4)
-∈: .∈9 .∈9
where % is the disturbance in the nonlinear regression model, "67,% are the e-scooter trips per
zone predicted from the model in Eq. (1). Since both - and . need to be estimated, this model
is nonlinear in its parameters. The least-squares regression methodology is applied to estimate the
parameters using Excel Solver with the GRG Nonlinear method. Parameters are sought to
13minimize the gap between the demand for e-scooters and the substituted trips for each zone. The objective function is shown in Eq. (5). The estimated coefficients are reported in Table 6. Interpretation of these results are presented in Section 4. 5 min = e# !"#,% − "67,% % (5) %∈; We use the bootstrap method to evaluate the statistical significance of the estimated coefficients (Chernick, 2014). We sample (with replacement) from the 318 observations to reconstruct 150 bootstrap samples of those 318 observations (shown in Table 6). The results suggest that many of the coefficients are statistically significant at 5% level, particularly bike, carpool, taxi, and the distance coefficient. For the other factors, it means that the data does not establish a sufficiently significant relationship to e-scooter ridership. TABLE 6. Results of parameters for nonlinear regression model Confidence interval (90%) Variables Coefficient Lower Upper Standard Deviation (t-stat) ( ) 73.365 69.999 100.001 14.013 (5.235)* *+,- 0.226 0.000 0.307 0.093 (2.430)* ./0, 0.021 0.000 0.201 0.060 (0.350) !+%+ 0.094 0.000 0.208 0.086 (1.093) !/12""0 0.636 0.000 0.700 0.264 (2.409)* %/3+ 0.184 0.000 0.227 0.078 (2.359)* /4%" 0.109 0.000 0.206 0.065 (1.677) 5 0.493 0.400 0.500 0.037 (13.324)* 6 0.069 0.000 0.233 0.081 (0.852) * statistically significant at 5% level 4. DISCUSSION The results from the model and analysis are quite insightful. First, the log-log regression model predicts 75K daily e-scooter trips. The nonlinear multifactor model breaks this number down into two categories: direct and access/egress trips. By structuring the model into direct or access trips while incorporating distance, the results provide an indication of where the trips likely drawn from, in terms of travel modes. From the models and the estimation derived in section 3, certain proportions of each mode will be replaced by e-scooters with some statistical certainty. For instance, based on the #
TABLE 7. Results of the parameter ( ! ) by average distance
 Distance( ) 0.5 1.5 2.5 3.5 4.5 5.5 6.5 7.5 8.5 9.5 10.5 11.5 12.5
 5 0.986 0.329 0.20 0.14 0.11 0.09 0.08 0.07 0.06 0.05 0.05 0.04 0.04

The constant C = 73.365 aggregates unexplainable impacts such as latent demand and tourist trips.
The constant itself explains 23K of the e-scooter trips. Among the seven different mode choices,
carpool, bike, and taxi trips tend to be significantly substituted. Assuming the comparable travel
speeds to bikes (10 mph), e-scooters can be an effective replacement for cars, just like e-bikes
(Kroesen, 2017). With the estimation, e-scooters can replace, in total, up to 32% of carpool, 13%
of bike, 7.2% of taxi, 1.9% of walking, and 1.8% of auto trips, but a majority of these replacements
come from short distance trips. The distribution of substituted modes by distance is shown in
Figure 6. The shorter the trip distance is, the more likely a trip will be replaced by e-scooters.

 FIGURE 6. The percentage of substitution of each mode trips by distance.

We also analyze the distributions of substituted trips for each TAZ by summing up all distances
traveled (Figure 7). We see clusters concentrated around Lower Manhattan and the Upper
Westside (west of Central Park) for the bike substitution. Most of the carpool replacements take
place in Northern Manhattan. For the substituted taxi trips, it is relatively scattered around
Manhattan, unlike the other modes.
The fare model for many e-scooter companies is consistent around = $1 + $0.15 ×
 ℎ ( ) (per Lime). With 75K total trips and supposing an average trip
distance of 1.6 miles reflecting about 12 minutes (BCDOT, 2018), we determined a potential
average daily revenue of $210K for the e-scooter market with 2000 scooters, or approximately
$77M annual revenue from Manhattan.

 15
(a) (b) (c) (d)
 FIGURE 7. Substitution of (a) carpool (b) bike (c) taxi (d) public transit access trips (%) per TAZ

Figure 8 shows the relationship between the distance traveled and the total revenue from each
travel mode. As the distance traveled increases, the total revenue decreases, as a result from direct
substitution by e-scooters. One interesting fact is that many residents in Manhattan prefer walking
short distances. Therefore, although the substitution rate of walking trips is not as high as the other
modes, the revenue from replacements of short distance walking trips takes a large portion of the
total.

 (a) (b)
 FIGURE 8. The revenue from substituted modes and access trips by distance.

The other factor revealed from the model estimation is access/egress trips to public transit within
 0
Manhattan. The average value of /#,% is 0.069. The small number makes sense since public transit
trips are much larger in Manhattan per zone. The zonal distribution of e-scooter trips substituting
access/egress to public transit can be found in Figure 7(d).
The revenue structure for access trips differs from the taxi substitution trips because the former’s
travel time generally remains around the same regardless of the length of the public transit trip.
Reported from the 2011 RHTS data, the average access time to public transit is 5.13 minutes (0.085
hr). We see in Figure 8 that there is an insignificant change in the revenues from substitution of
access/egress trips when compared to the other trips in relation to distance. A future consideration

 16
is to include public transit trips entering and leaving Manhattan; we expect to see a similar revenue
pattern even with longer distances.

5. CONCLUSIONS

We conducted the first demand forecasting model study for e-scooter mobility that seeks to explain
which modes the trips would substitute. The demand model is based on data available from a pilot
conducted in Portland, Austin and Chicago. The model is applied to Manhattan data to find a
potential market of 75K daily trips and $77M annual revenue assuming 12-minute trips.
In addition to the demand model, we proposed and estimated an exploratory multifactor model to
explain where the predicted trips may come from. At 5% significance level, the e-scooter trips are
shown to substitute trips from biking, carpool, and taxi. In addition, the carpool trips are three
times more likely to be substituted than the bike trips and taxi trips. E-scooters are likely to
compete with the other modes at shorter distances than at longer distances, with the substitution
rate( . ) dropping by an order of magnitude from 0.5 mile distances to 5.5 miles.
The estimated parameters allow us to analyze the spatial distribution for the modes and break down
those substituted trips by distance. As a result, we see a clear distinction between the distance
structure of substituted direct trips and that of access/egress trips for public transit. Having the
fleet size variable, we can also analyze the elasticity of revenue or taxi trip substitution with respect
to it.
 For future research, there are some constraints to overcome. There are potential changes in
individual activity patterns as well as in travel demand with a newly added service. Furthermore,
quantitative variables that could affect the likelihood of riding e-scooters such as weather, traffic
or road conditions can be take into account. Capturing non-commuter behavior would also help.
In our study, only Citi Bike data captures tourist trips. In the Portland pilot, a substantial proportion
of e-scooter riders were non-Portlanders. According to its survey data, 48% of visitors’ e-scooter
trips had been replaced from motorized travel modes such as taxi, FHV, and rental cars (PBOT,
2018).

ACKNOWLEDGMENTS
This research was conducted with support from the C2SMART University Transportation Center.

AUTHOR CONTRIBUTIONS
The authors confirm contribution to the paper as follows: study conception and design: ML, GY,
YH, JC; data collection: ML, YH; analysis: ML; interpretation of results: ML, GY, JC; draft
manuscript preparation: ML, JC, GY.

 17
REFERENCES
ACS. (2018). 2017 Data Profiles. American Community Survey, U.S. Census Bureau. [online] Available at:
https://www.census.gov/acs/www/data/data-tables-and-tools/data-profiles/2017/.
Austintexas.gov. 2019. Dockless mobility community survey report. [online] Available at:
 [Accessed 30 January 2021].
Bai, S., & Jiao, J. (2020). Dockless E-scooter usage patterns and urban built Environments: A comparison study of
Austin, TX, and Minneapolis, MN. Travel behaviour and society, 20, 264-272.
Balac, M., 2018. Transit Router. https://github.com/balacmi/NYU/tree/master/ptrouter.
BCDOT, 2019. [online] Available at:
https://transportation.baltimorecity.gov/sites/default/files/Pilot%20evaluation%20report%20FINAL.pdf.
Benoit, K., 2011. Linear regression models with logarithmic transformations. London School of Economics,
London, 22(1), pp.23-36.
Brown, A.M., 2001. A step-by-step guide to non-linear regression analysis of experimental data using a Microsoft
Excel spreadsheet. Computer Methods and Programs in Biomedicine 65(3), 191-200.
BTS (2020). Bikeshare and e-scooters in the U.S., https://data.bts.gov/stories/s/fwcs-jprj, last accessed 2/1/21.
capitalbikeshare.com. (2012). 2012 Capital Bikeshare Member Survey Report. [online] Available at:
https://d21xlh2maitm24.cloudfront.net/wdc/cabi-2012surveyreport.pdf?mtime=20161206135939.
Caspi, O., Smart, M. J., & Noland, R. B. (2020). Spatial associations of dockless shared e-scooter usage.
Transportation Research Part D: Transport and Environment, 86, 102396.
Chakour, V. and Eluru, N., 2014. Analyzing commuter train user behavior: a decision framework for access mode
and station choice. Transportation 41(1), 211-228.
Chernick, M. R., & LaBudde, R. A. (2014). An introduction to bootstrap methods with applications to R. John
Wiley & Sons.
Citi Bike (2018). https://www.citibikenyc.com/, last accessed July 28, 2019.
City of Chicago (2020). E-scooter pilot evaluation summary. [online] Available at:
 [Accessed 30 January
2021].
Degele, J., Gorr, A., Haas, K., Kormann, D., Krauss, S., Lipinski, P., Tenbih, M., Koppenhoefer, C., Fauser, J. and
Hertweck, D., 2018, June. Identifying E-scooter sharing customer segments using clustering. In 2018 IEEE
International Conference on Engineering, Technology and Innovation (ICE/ITMC) (pp. 1-8). IEEE.
Dewan, S. and Smith, R., 2003. Creating asset management reports from a local agency pavement management
system. Transportation Research Record 1853(1), 13-20.
Djavadian, S. and Chow, J.Y.J., 2017a. An agent-based day-to-day adjustment process for modeling ‘Mobility as a
Service’ with a two-sided flexible transport market. Transportation Research Part B 104, 36-57.
Djavadian, S. and Chow, J.Y.J., 2017b. Agent-based day-to-day adjustment process to evaluate dynamic flexible
transport service policies. Transportmetrica B 5(3), 281-306.
Domencich, T. A., Kraft, G., & Valette, J. P. (1968). Estimation of urban passenger travel behavior: An economic
demand model. Charles River Associates.
Doolittle Jr, J.T. and Porter, E.K., 1994. Integration of bicycles and transit (No. Project SB-1).
Dritsakis, N. and Athanasiadis, S., 2000. An econometric model of tourist demand: The case of Greece. Journal of
Hospitality & Leisure Marketing 7(2), 39-49.
Fan, A., Chen, X. and Wan, T., 2019. How Have Travelers Changed Mode Choices for First/Last Mile Trips after
the Introduction of Bicycle-Sharing Systems: An Empirical Study in Beijing, China. Journal of Advanced
Transportation, 5426080, 16p.
Fitzsimmons, E., 2019. Electric scooters are coming to New York, but you can’t rent one in Manhattan. The New York
Times, June 19.

 18
Geng, J., Long, R. and Chen, H., 2016. Impact of information intervention on travel mode choice of urban residents
with different goal frames: A controlled trial in Xuzhou, China. Transportation Research Part A: Policy and
Practice, 91, pp.134-147.
Gerte, R., Konduri, K.C., Ravishanker, N., Mondal, A. and Eluru, N., 2019. Understanding the relationships
between demand for shared ride modes: case study using open data from New York City. Transportation Research
Record, p.0361198119849584.
Griswold, J.B., Medury, A. and Schneider, R.J., 2011. Pilot models for estimating bicycle intersection
volumes. Transportation Research Record 2247(1), 1-7.
Halldórsdóttir, K., Nielsen, O.A. and Prato, C.G., 2017. Home-end and activity-end preferences for access to and
egress from train stations in the Copenhagen region. International Journal of Sustainable Transportation 11(10),
776-786.
Hankey, S. and Lindsey, G., 2016. Facility-demand models of peak period pedestrian and bicycle traffic:
comparison of fully specified and reduced-form models. Transportation Research Record, 2586(1), 48-58.
Hankey, S., Lu, T., Mondschein, A. and Buehler, R., 2017. Spatial models of active travel in small communities:
merging the goals of traffic monitoring and direct-demand modeling. Journal of Transport & Health 7, 149-159.
Hardt, C. and Bogenberger, K., 2017. Usability of escooters in urban environments—A pilot study. In 2017 IEEE
Intelligent Vehicles Symposium (IV) (pp. 1650-1657). IEEE.
Hardt, C. and Bogenberger, K., 2019. Usage of e-scooters in urban environments. Transportation research
procedia, 37, pp.155-162.
He, B., Zhou, J., Ma, Z., Chow, J. and Ozbay, K., 2020. Evaluation of city-scale built environment policies in New
York City with an emerging-mobility-accessible synthetic population. Transportation Research Part A: Policy and
Practice, 141, pp.444-467.
Hoboken City Hall. 2019. Hoboken releases results of e-scooter survey.
 [online] Available at:
NYC (2016). Mobility Report. Available at: http://www.nyc.gov/html/dot/downloads/pdf/mobility-report-2016-
screen-optimized.pdf.
NYC (2018). LION single line street base map. NYC Department of City Planning,
https://www1.nyc.gov/site/planning/data-maps/open-data/dwn-lion.page, last accessed July 28, 2019.
NYMTC, 2011. 2010/2011 Regional Household Travel Survey. New York, US. Transportation Information
Gateway. Accessed on (June, 1, 2017) at https://www.nymtc.org/Portals/0/Pdf/SED/Excel.zip?ver=2016-05-26-
130138-000
Noland, R. B. (2019). Trip patterns and revenue of shared e-scooters in Louisville, Kentucky. Transport
Findings, 29(4).
Pew Research Center. (2018). Smartphone ownership in the US by age 2015-2018. Statista. Available at:
https://www.statista.com/statistics/489255/percentage-of-us-smartphone-owners-by-age-group.
PBOT (2018). 2018 E-Scooter Findings Report. The City of Portland, Oregon. Available at:
https://www.portlandoregon.gov/transportation/78431.
Pushkarev, B. and Zupan, J.M., 1971. Pedestrian travel demand (No. HS-011 999).
Ranaiefar, F. and Rixey, R.A., 2016. Bike sharing ridership forecast using structural equation modeling. Proc. 95th
Annual Meeting of the TRB, 16-6573.
Reck, D. J., Haitao, H., Guidon, S., & Axhausen, K. W. (2020). Explaining shared micromobility usage, competition
and mode choice by modelling empirical data from Zurich, Switzerland. Transportation Research Part C: Emerging
Technologies, 124, 102947.
Schneider, R. and Baltes, M., 2005. Integration of bicycles and transit (No. 62). Transportation Research Board.
Shaheen, S.A., Guzman, S. and Zhang, H., 2010. Bikesharing in Europe, the Americas, and Asia: past, present, and
future. Transportation Research Record 2143(1), 159-167.
Smith, C.S. and Schwieterman, J.P., 2018. E-Scooter Scenarios: Evaluating the Potential Mobility Benefits of
Shared Dockless Scooters in Chicago.
Toll, M. (2018). Four scenarios in four years: the future of electric scooter sharing. [online] Electrek. Available at:
https://electrek.co/2018/12/11/future-electric-scooter-sharing.
Towncharts (2018). United States Demographics data. [online] Available at: http://www.towncharts.com/United-
States-Demographics-data.html.
TransitFeeds (2019). New York City MTA data. https://transitfeeds.com/p/mta, last accessed July 28, 2019.
Wodinsky, S. (2018). New York City is the perfect scooter market, but it’s also the most impossible. [online] The
Verge. Available at: https://www.theverge.com/2018/8/11/17553508/scooter-sharing-nyc-bird-lime-law.
Xu, S.J. and Chow, J.Y.J., 2019. A longitudinal study of bike infrastructure impact on bikesharing system
performance. International Journal of Sustainable Transportation, in press, doi: 10.1080/15568318.2019.1645921.
Yang, M., Liu, X., Wang, W., Li, Z. and Zhao, J., 2015. Empirical analysis of a mode shift to using public bicycles
to access the suburban metro: Survey of Nanjing, China. Journal of Urban Planning and Development, 142(2),
p.05015011.
Yang, M., Liu, X., Wang, W., Li, Z. and Zhao, J., 2016. Empirical Analysis of a Mode Shift to Using Public
Bicycles to Access the Suburban Metro: Survey of Nanjing, China. Journal of Urban Planning and Development,
142(2), p.05015011.
Yang, L., Shen, Q. and Li, Z., 2016. Comparing travel mode and trip chain choices between holidays and
weekdays. Transportation Research Part A 91, 273-285.
Zarif, R., Pankratz, D. M., and Kelman, B., 2019. Small is beautiful: making micromobility work for citizens, cities,
and service providers. Deloitte Insights, April 15: https://www2.deloitte.com/insights/us/en/focus/future-of-
mobility/micro-mobility-is-the-future-of-urban-transportation.html.
Zou, Z., Younes, H., Erdoğan, S., & Wu, J. (2020). Exploratory analysis of real-time e-scooter trip data in
Washington, DC. Transportation research record, 2674(8), 285-299.

 20
21
You can also read