Computational modelling and data-driven homogenisation of knitted membranes
←
→
Page content transcription
If your browser does not render page correctly, please read the page content below
Computational modelling and data-driven homogenisation of
                                                                 knitted membranes

                                                                  Sumudu Herath1,3∗ , Xiao Xiao2,3 and Fehmi Cirak3
                                                            1 Department of
                                                                       Civil Engineering, University of Moratuwa, Moratuwa, Sri Lanka
arXiv:2107.05707v1 [math.NA] 12 Jul 2021

                                                                     2 Inria,
                                                                        2004 route des Lucioles, 06902 Sophia Antipolis, France
                                             3 Department of Engineering, University of Cambridge, Trumpington Street, Cambridge CB2 1PZ, U.K.

                                                                                        SUMMARY

                                           Knitting is an effective technique for producing complex three-dimensional surfaces owing to the
                                           inherent flexibility of interlooped yarns and recent advances in manufacturing providing better control
                                           of local stitch patterns. Fully yarn-level modelling of large-scale knitted membranes is not feasible.
                                           Therefore, we consider a two-scale homogenisation approach and model the membrane as a Kirchhoff-
                                           Love shell on the macroscale and as Euler-Bernoulli rods on the microscale. The governing equations
                                           for both the shell and the rod are discretised with cubic B-spline basis functions. The solution of the
                                           nonlinear microscale problem requires a significant amount of time due to the large deformations and
                                           the enforcement of contact constraints, rendering conventional online computational homogenisation
                                           approaches infeasible. To sidestep this problem, we use a pre-trained statistical Gaussian Process
                                           Regression (GPR) model to map the macroscale deformations to macroscale stresses. During the
                                           offline learning phase, the GPR model is trained by solving the microscale problem for a sufficiently
                                           rich set of deformation states obtained by either uniform or Sobol sampling. The trained GPR model
                                           encodes the nonlinearities and anisotropies present in the microscale and serves as a material model
                                           for the macroscale Kirchhoff-Love shell. After verifying and validating the different components of
                                           the proposed approach, we introduce several examples involving membranes subjected to tension and
                                           shear to demonstrate its versatility and good performance.

                                           Received . . .

                                           KEY WORDS: knitting; membranes; rods; finite deformations; homogenisation; data-driven;
                                                      Gaussian processes

                                                                                     1. INTRODUCTION

                                           Knitting is one of the most efficient and widely used techniques for producing fabric
                                           membranes. The recent advances in computational knitting make it possible to produce
                                           large complex three-dimensional surfaces in one piece without seams [1, 2]. On a modern
                                           programmable flat-bed knitting machine it is possible to produce even non-developable surfaces
                                           by a local variation of the stitch pattern consisting of an interlooped yarn. Most promisingly,
                                           the yarn can be replaced or integrated with electroactive or conductive yarns to produce novel
                                           interactive textiles with sensing and/or actuation capabilities [3, 4, 5]. Knitted membranes are
                                           usually very flexible because the primary deformation mechanism for the yarn is bending
                                           rather than axial stretching. Their unique stretchability and drapability properties make
                                           knitted membranes appealing as a reinforcement in composite components [6, 7]. If needed,

                                           ∗ Correspondence     to: sumuduh@uom.lk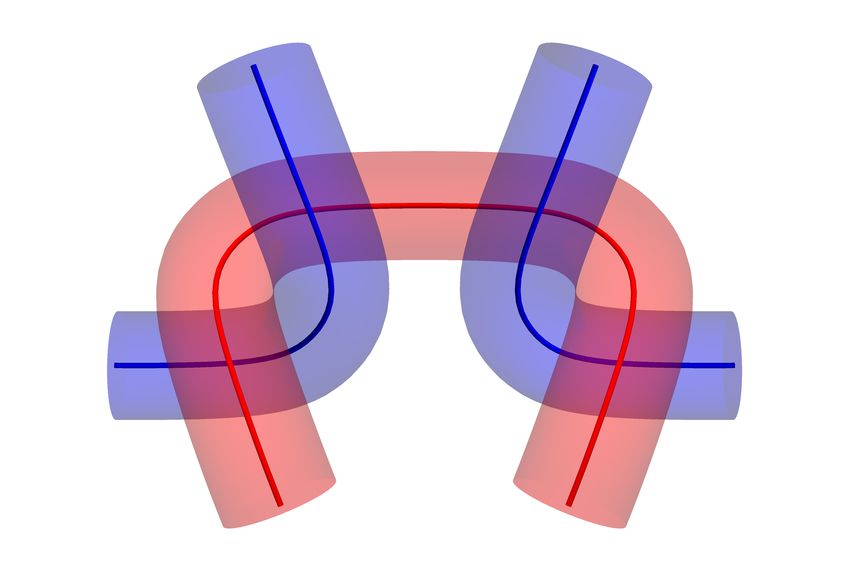
2                              S. HERATH, X. XIAO AND F. CIRAK

the stiffness can be increased by inserting straight high-strength fibres during the knitting
process. Such reinforced membranes have been recently used as a formwork in architectural
engineering [8]. Considering the recent advances in knitting, there is a need for efficient
computational approaches for the analysis of large-scale knitted membranes.
    For large-scale analysis of knitted membranes, the computational homogenisation
approaches which take into account the deformation of the interlooped yarn on the
microscale are crucial. There is an extensive amount of literature on finite element-based
computational homogenisation of heterogeneous solids, see e.g. the reviews [9, 10, 11]. Two-
scale homogenisation often referred to as FE2 , combined with a yarn-level and a membrane-
level finite element model has been also applied to woven and knitted fabrics [12, 13, 14, 15].
The boundary conditions of the microscale representative volume element (RVE) are given
by the membrane deformation and in turn the averaged yarn stress in the RVE yields the
membrane stress. However, such schemes are inefficient for knitted membranes with large
deformations because of the need to solve a nonlinear problem at each quadrature point of the
membrane. It is increasingly apparent that for nonlinear problems two-scale homogenisation
must be considered in combination with a data-driven machine learning model [16]. The
model can be trained in an off-line learning phase by solving the microscale problem for a
sufficiently rich set of deformation states. Subsequently, the trained model provides a closed-
form constitutive equation that is used in the macroscale model. As a machine learning model,
for instance, neural networks or GPR models have been used [16, 17, 18, 19]. Alternatively,
it is possible to formulate the macroscale finite element problem directly on the training data
set bypassing the need to train a machine learning model [20, 21]. GPR regression is a well-
studied Bayesian statistical method and provides as such a principled approach to dealing
with epistemic and aleatoric uncertainties and issues such as overfitting [22]. Therefore, we
approximate the response of the microscale yarn model with GPR. Their limitation to relatively
small dimensions and number of training points is not relevant for this paper.
    Owing to the relative slenderness of the yarn on the microscale and the membrane on the
macroscale, they are best modelled as a rod and a shell, respectively. Evidently, this leads in
comparison to a 3D solid model to an immense reduction in the number of degrees of freedom.
The geometrically exact rod theories pioneered by Simo et al. [23, 24] provide a consistent and
efficient framework for modelling rods undergoing finite deformations. Later contributions to
geometrically exact rod theories include [25, 26, 27]. While in most of these classical rod models
the transverse shear deformations are taken into account, in more recent Euler-Bernoulli type
models they are neglected [28, 29]. The omission of the transverse shear effectively sidesteps
the shear locking problem which is a major impediment in the analysis of slender rods. These
new models are usually discretised using smooth B-spline basis functions due to the presence of
the higher-order displacement derivatives in the energy functional. The Euler-Bernoulli type
rod model introduced in this paper takes into account the stretching, bending and torsion
of the yarn as well as the non-frictional rod-to-rod contact between yarns. Similar to the
yarn, the fabric membrane can be modelled with geometrically exact shell theories going back
again to Simo et al. [30, 31]. As for rods, in more recent Kirchhoff-Love type shell models
the transverse shear deformations are neglected and the weak form is discretised using smooth
B-splines or subdivision basis functions [32, 33, 34]. Although the bending resistance of knitted
membranes is usually very small, a suitably chosen shell bending energy term can serve as a
regularisation for wrinkling under compressive stresses [33, 35]. In this paper we make use of
the Kirchhoff-Love subdivision shell implementation introduced in [36, 37].
    The outline of the paper is as follows. In Section 2 we introduce our finite deformation
rod model, its discretisation with B-splines as well as the treatment of rod-to-rod contact.
Subsequently, in Section 3 we discuss the proposed microscale yarn-level RVE model for
computational homogenisation. This model is verified and validated with experimental and
numerical results from literature. In Section 4, we introduce the data-driven GPR model and
describe its training with the yarn-level RVE model. Finally, in Section 5, we first discuss the
DATA-DRIVEN HOMOGENISATION OF KNITTED MEMBRANES                                 3

Figure 1. Geometric description of a spatial rod in its reference (left) and deformed (right)
configurations. The two configurations are defined using the line of centroids X(θ1 ) and x(θ1 ) and
                               the respective covariant basis vectors.

training of the GPR model and then analyse membranes subjected to tension to assess the
accuracy of the obtained data-driven constitutive model.

                    2. FINITE DEFORMATION ANALYSIS OF YARNS

In this section we summarise the governing equations for the finite deformation Euler-Bernoulli
rod model for the yarn. The presented equations are without loss of generality restricted to
rods with circular cross-sections. We take into account rod-to-rod contact by enforcing the
non-penetration constant with the Lagrange multiplier method.

2.1. Kinematics
The geometry of the rod is described by a set of circular cross-sections connected by their line of
centroids. In accordance with the Euler-Bernoulli assumption, equivalent to the Kirchhoff-Love
assumption for shells and plates, transverse shear is neglected so that cross-sections remain
always normal to the line of centroids.
   The position vectors of material points in the reference and deformed configura-
tions R(θ1 , θ2 , θ3 ) and r(θ1 , θ2 , θ3 ) are parametrised in terms of the convective coordi-
nates {θ1 , θ2 , θ3 } as

                        R(θ1 , θ2 , θ3 ) = X(θ1 ) + θ2 A2 (θ1 ) + θ3 A3 (θ1 ) ,                (1a)
                             1    2     3      1      2      1    3        1
                         r(θ , θ , θ ) = x(θ ) + θ a2 (θ ) + θ a3 (θ ) ,                       (1b)

where X(θ1 ) and x(θ1 ) denote the lines of centroids parameterised by θ1 , see Figure 1. In
turn, the cross-section with the radius r is parameterised by |θ2 | ≤ r and |θ3 | ≤ r. The tangent
vectors to the line of centroids are given by
                                        dX                   dx
                                 A1 =       = X,1 ,   a1 =       = x,1 .                        (2)
                                        dθ1                  dθ1
The two orthonormal directors A2 and A3 are chosen so that they satisfy in the reference
configuration
                        |Aι | = 1 , A2 · A3 = 0 , A1 · Aι = 0 .                      (3)
4 S. HERATH, X. XIAO AND F. CIRAK
Here and in the following Greek indices take the values {2, 3} and summation over repeated
indices is assumed. The two orthonormal directors aι in the deformed configuration are
obtained by rotating the reference configuration directors with a rotation matrix Λ ∈ SO3 ,
aι = ΛAι . (4)
This, in combination with the Euler-Bernoulli assumption, ensures that the two directors a2
and a3 in the deformed configuration satisfy
|aι | = 1 , a2 · a3 = 0 , a1 · aι = 0 . (5)
The rotation Λ is composed of two rotations,
Λ(x, ϑ) = Λ2 (x)Λ1 (ϑ) . (6)
That is, the reference directors Aι are mapped to the deformed directors aι in two steps using
an intermediary configuration with a0ι = Λ1 (ϑ)Aι . The matrix Λ1 (ϑ) describes a rotation by
an angle ϑ about the unit tangent Â1 = A1 /|A1 | and is according to the Rodrigues formula
given by
Λ1 (ϑ) = I + sin ϑL + (1 − cos ϑ)LL (7)
with the identity matrix I and the skew-symmetric matrix
0 −Â1 · e3 Â1 · e2
L = Â1 · e3 0 −Â1 · e1 . (8)
−Â1 · e2 Â1 · e1 0
Subsequently, we use the smallest rotation formula [28, 38] for the second matrix Λ2 (a1 ),
which maps Â1 to the unit tangent vector â1 = a1 /|a1 |,
(Â1 + â1 ) ⊗ â1
Λ2 (a1 ) = I − . (9)
1 + â1 · Â1
To derive the strains corresponding to the assumed kinematics (1), we consider the Green-
Lagrange strain tensor of 3D elasticity
1
E = Eij Gi ⊗ Gj = (gij − Gij ) Gi ⊗ Gj . (10)
2
Here and in the following Latin indices take the values {1, 2, 3}. The covariant basis vectors Gi
and gi and the contravariant basis vectors Gi and g i are defined as
∂R ∂r
Gi = , gi = , Gi · Gj = δij , gi · g j = δij , (11)
∂θi ∂θi
where δij is the Kronecker delta. The corresponding two metric tensors Gij and gij are given
by
Gij = Gi · Gj , gij = gi · gj . (12)
After introducing the assumed kinematics (1) in (10) and some algebraic simplifications we
obtain for the components of the strain tensor
α + θ2 β2 + θ3 β3 θ3 γ −θ2 γ
[Eij ] = 0 0 (13a)
symmetric 0
DATA-DRIVEN HOMOGENISATION OF KNITTED MEMBRANES                               5

with
                                       1
                                α(x) =   (a1 · a1 − A1 · A1 ) ,                            (13b)
                                       2
                           β2 (x, ϑ) = A2 · A1,1 − a2 · a1,1 ,                             (13c)
                           β3 (x, ϑ) = A3 · A1,1 − a3 · a1,1 ,                             (13d)
                                       1
                            γ(x, ϑ) = (a2 · a3,1 − A2 · A3,1 ) .                           (13e)
                                       2
We identify α, β2 , β3 and γ as the membrane, bending about a2 , bending about a3 and
torsional shear strains, respectively. Moreover, due to the Euler-Bernoulli assumption the
strain components E23 , E32 and E33 are zero and the in-plane shear strains E12 and E13
are induced only by torsional shear strain γ.

2.2. Equilibrium equations in weak form
The potential energy of a rod with the line of centroids Γ ⊂ R and the cross-section Ω ⊂ R2
occupying the volume V = Γ × Ω ⊂ R3 in its reference configuration takes the form
                                                 Z
                    Π(r) = Πint (r) + Πext (r) =    ψ(E) dV + Πext (r) ,                (14)
                                                      V

where ψ(E) is the strain energy density and Πext (r) is the potential of the externally applied
forces. At equilibrium the potential energy of the rod is stationary, i.e.,

                           δΠ(r) = δΠint (r) + δΠext (r) = 0                               (15a)

with the external virtual work δΠext (r) and the internal virtual work
                                   Z                     Z
                                      ∂ψ(E)
                       δΠint (r) =           : δE dV =      S : δE dV ,                    (15b)
                                    V   ∂E                V

where S is the second Piola-Kirchhoff stress tensor. The strain tensor of the rod (13) depends
on the displacement of the line of centroids

                                      u(θ1 ) = x(θ1 ) − X(θ1 ) ,                            (16)

and the rotation angle ϑ. Hence, we can write for the internal virtual work (15b) more succinctly

                          Z Z                          Z Z
                                ∂E                                ∂E
            δΠint (x) =          S:  · δu|A1 | dΩ dΓ +         S:    δϑ|A1 | dΩ dΓ         (17a)
                                ∂u                                ∂ϑ
                       ZΓ Ω                Z              Γ Ω

                     =   fu · δu|A1 | dΓ +     fϑ δϑ|A1 | dΓ ,                             (17b)
                          Γ                     Γ

where fu and fϑ are the internal forces conjugate to the virtual displacements δu and
rotations δϑ.
   As a material model we use the isotropic St Venant-Kirchhoff model with the strain energy
density
                                           1          1
                                  ψ(E) =     E :C :E = S :E,                                (18)
                                           2          2
and the fourth-order constitutive tensor

  C = C ijkl Gi ⊗ Gj ⊗ Gk ⊗ Gl = λGij Gkl + µ(Gik Gjl + Gil Gjk ) Gi ⊗ Gj ⊗ Gk ⊗ Gl ,

                                                                                  (19)
6 S. HERATH, X. XIAO AND F. CIRAK
where λ and µ are the two Lamé parameters [39]. The contravariant metric tensor Gij is
determined from the relation Gki Gij = δkj .
To derive analytical expressions for the internal forces we first introduce the rod strain
tensor (13) and the constitutive equation (19) in the internal virtual work (17). Subsequently,
we integrate over the rod cross-section analytically to obtain the internal forces
∂α ∂β2 ∂β3 ∂γ
fu = n + m2 + m3 +q , (20a)
∂u ∂u ∂u ∂u
∂β2 ∂β3 ∂γ
fϑ = m2 + m3 +q . (20b)
∂ϑ ∂ϑ ∂ϑ
Here, the axial force n, the bending moments mι and the torque q are defined as
n = EG11 G11 Aα , (21a)
11 11
mι = EG G Iι βι , (21b)
11
q = 2EG Jγ , (21c)
where A = πr2 , Iι = πr4 /4 and J = πr4 /2 are the cross-section area, second moment of
area and torsional constant of the circular rod, and E is its Young’s modulus. The tedious
but straightforward derivation of internal forces and their derivatives are summarised in
Appendix A.
2.3. Finite element discretisation
We follow the isogeometric analysis paradigm and use univariate cubic B-splines to discretise
the lines of centroids X(θ1 ) and x(θ1 ) in the reference and deformed configurations. We choose
smooth B-splines because the bending strains βι in (13) require at least C 1 continuous smooth
basis functions. The kinematic relationship (16) is restated after discretisation as
nB
X nB
X nB
X
I 1 I 1
B (θ )xI = B (θ )XI + B I (θ1 )uI , (22)
I=1 I=1 I=1
where the B-spline basis B I (θ1 ) and their coefficients correspond to the nB control vertices on
the discretised rod centreline.
The discretised weak form of the equilibrium equations (15) yields after linearisation
an algebraic system of equations, which we solve with the Newton-Raphson scheme. For
linearisation the gradients of the internal forces (20) are required, see Appendix A.2.
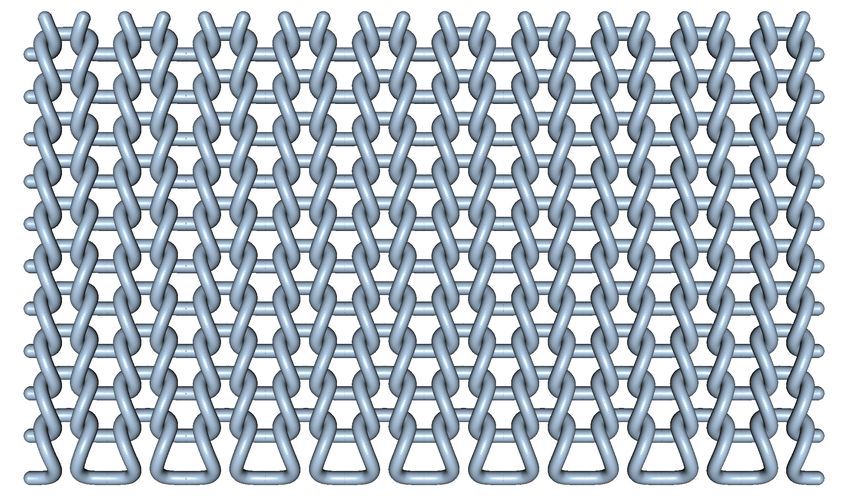
2.4. Yarn-to-yarn contact
We use the Lagrange multiplier method to consider pointwise non-frictional contact between
two circular rods. By closely following Wriggers et al. [40] and Weeger et al. [41], we add to
the total potential energy Π(r) in (14) the contact potential energy
Πc (r) = τ gN , (23)
where the Lagrange multiplier τ represents the repulsive normal force between the two rods,
and the non-positive gap function gN depends on the minimum distance between the two rods.
The distance between the lines of centroids of the two rods xl (θl1 ) and xr (θr1 ) is given by
d(θl1 , θr1 ) = |xl (θl1 ) − xr (θr1 )| , (24)
and its minimum by
dmin = min
1
d(θl1 , θr1 ) = d(θl1c , θr1c ) . (25)
θl ,θr1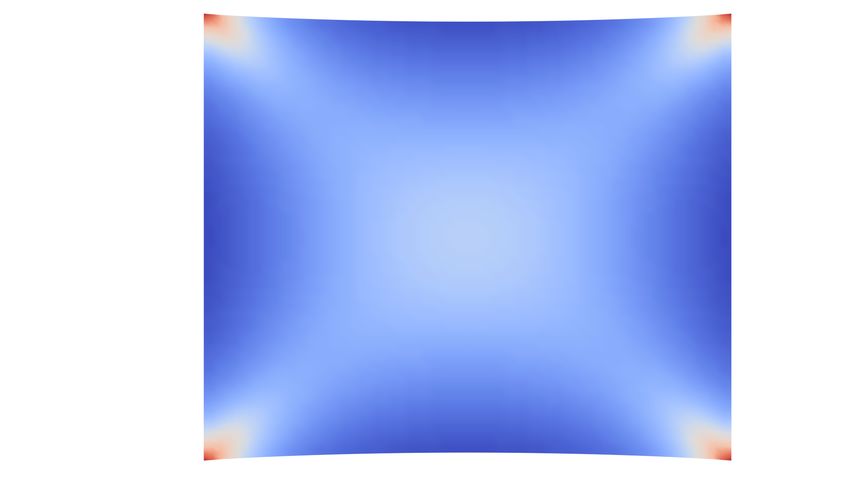
DATA-DRIVEN HOMOGENISATION OF KNITTED MEMBRANES                                 7

Figure 2. Contact between two rods with the lines of centroids xl (θl1 ) and xr (θr1 ). Between the
            points xl (θl1c ) and xl (θl1c ) the distance is minimum and has the value dmin .

This minimum can be determined using the Newton-Raphson scheme. Ultimately, the non-
positive gap function gN is defined as
                                      (
                                       dmin − 2r dmin < 2r ,
                                 gN =                                           (26)
                                       0         dmin ≥ 2r ,
where r is the radius of the rods.
   The first variation of the contact potential energy (23) gives its contribution to the weak
form of the equilibrium equations (15). This contribution takes the form
                                       δΠc = τ δgN + δτ gN .                                  (27)
For further details on our contact implementation we refer to Herath [42].

2.5. Verification of the rod model
We consider a membrane-bending-torsion interaction problem to verify the accuracy of the
presented rod formulation. A spatial helicoidal spring is clamped at one end and a vertical
load of magnitude 25 kN is applied at the other end, see Figure 3a. The reference geometry of
the line of the centroids is given by
                 X(θ1 ) = {10 sin(2π θ1 ), 10 cos(2π θ1 ), 20 θ1 },   θ1 ∈ [0, 1] .           (28)
The material and geometric properties of the spring including the reference director
orientations Aι are given in Figure 3a. The tip load is increased from zero to 25 kN in 10
uniform load steps. In Figure 3b the deflected shapes for five different load levels are shown.
As can be seen in Figure 4 the obtained tip displacements are in excellent agreement with
the results presented in Bauer et al. [29], in which a slightly different approach was used to
parameterise the rotations of the two rod directors Aι .

                        3. COMPUTATIONAL HOMOGENISATION

3.1. Microscale analysis
A characteristic representative volume element (RVE) as depicted in Figure 5 is chosen
to represent the periodic microstructure of a weft-knitted membrane. The intricate spatial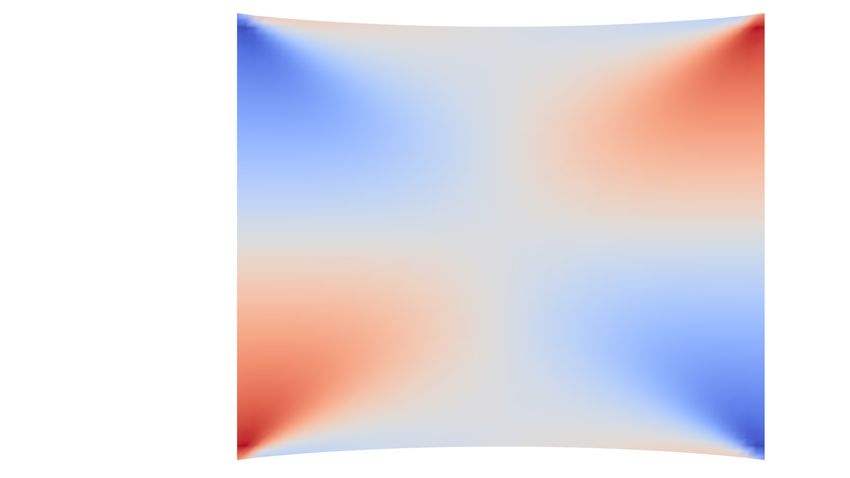
8                               S. HERATH, X. XIAO AND F. CIRAK

                              (a)                                                 (b)

Figure 3. One-sided clamped helicoidal spring with tip loading. Problem description (a) and deformed
                                  shapes under different loads (b).

Figure 4. Comparison of the obtained tip displacements of the helicoidal spring with Bauer et al. [29].

arrangement of the yarns in the RVE is modelled, as in recent works [43, 44], using the
approximate geometry proposed by Vassiliadis et al. [45], see Appendix B. For alternative
geometric descriptions see [46] and references therein. First the yarn centrelines are defined
and then the yarns are generated by sweeping a circle along those lines. On the macroscale
we model the membrane with subdivision shell finite elements [33, 36, 37] and consider for
homogenisation only the in-plane membrane response. The very small out-of-plane bending
stiffness contribution of the rods to the membrane bending stiffness is not taken into account.
   In first-order homogenisation, the macroscale membrane deformation gradient FM is used
to define the boundary conditions on the RVE. Here and in the following the macroscale and
microscale quantities are denoted by subscripts M and m, respectively. It is assumed that
the volume averaged deformation gradient Fm of the rod in the RVE and the membrane
deformation gradient FM are equal, that is,

                                                    Z
                                               1
                                     FM =                 Fm dV ,                                 (29)
                                             VRVE    Vm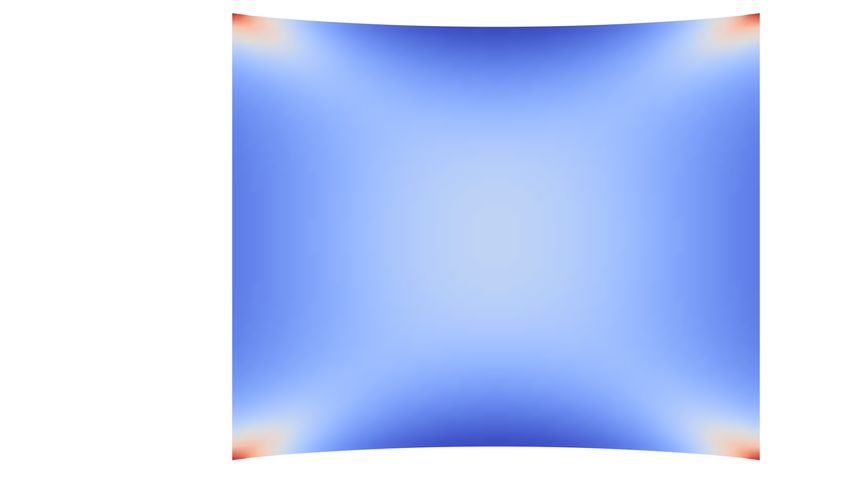
DATA-DRIVEN HOMOGENISATION OF KNITTED MEMBRANES                                   9

Figure 5. Characteristic weft-knitted RVE selection and the definition of fibre geometric and material
                                            parameters.

where VRVE is the RVE volume and Vm is the rod volume within the RVE in the reference
configuration. Without going into details, the deformation gradient Fm = ∂x/∂X of the line
of centroids is given by the kinematic assumption (1). The Hill-Mandel lemma states that the
macroscale and microscale work for an RVE must be equal
                                               Z
                                            1
                              PM : F M =            Pm : Fm dV ,                        (30)
                                          VRVE Vm

where PM is the macroscale first Piola-Kirchhoff membrane stress and Pm is the microscale
first Piola-Kirchhoff rod stress. The integral represents the internal virtual work of the rod
within the RVE and is given by (17). For the lemma (30) to hold only certain types of RVE
boundary conditions can be chosen, including Dirichlet and periodic; see [10, 47] for details.
Moreover, as a consequence of this lemma the macroscopic first Piola-Kirchhoff stress PM can
be obtained from the volume averaged internal energy density

                                         ∂ψM (FM )
                                  PM =                                                          (31a)
                                           ∂FM
with
                                                        Z
                                                  1
                            ψM (FM ) = inf                   ψm (Fm ) dV ,                      (31b)
                                         Fm ∈K   VRVE   Vm

where the set K denotes the deformation gradients satisfying the RVE boundary conditions.
The microscopic energy density ψm of a rod with an isotropic St Venant-Kirchhoff material is
given by (18).
   In this work we choose as RVE boundary conditions the periodic boundary conditions
depicted in Figure 6. Due to the orthotropy of the RVE response, the biaxial stretching and
shear response are decoupled. Therefore, we consider the two cases separately and choose for
each different boundary conditions. Boundary displacements in the thickness direction e3 are
zero to simulate plane stress conditions.

3.2. Verification and validation of the microscale model
To verify and validate our microscale model we consider RVEs under wale-wise and coarse-wise
uniaxial tension and shear as reported in Dinh et al. [43] and Weeger et al. [44]. For a detailed
problem description we refer to [43] and [44]. In our computations the yarn is discretised
with 128 rod finite elements. In Dinh et al. [43] the yarn is modelled as a 3D solid and in
Weeger et al. [44] as a discretised Euler-Bernoulli rod with the collocation method. As evident
from Figure 7 our results are in excellent agreement with the experimental and computational
results obtained with other approaches. Throughout this paper, we use the yarn geometry and
material parameters given in the above-mentioned two papers.
10                               S. HERATH, X. XIAO AND F. CIRAK

                           (a)                                           (b)

Figure 6. Prescribed periodic boundary conditions and the respective deformed configuration of an
RVE subjected to biaxial tension (a) and shear (b). At the six boundary finite element nodes, the
four labels describe the boundary conditions for the three displacements and the one rotation, i.e.
(u1 , u2 , u3 , ϑ), where ui refers to the applied displacements in the ei direction. The labels p and 0
                  denote periodic and zero displacement or twist constraints, respectively.

Figure 7. Comparison of the obtained homogenised stresses for an RVE under course-wise and wale-
wise uniaxial tension and pure shear with the experimental and numerical results reported in Weeger
 et al. [44] and Dinh et al. [43]. The unit conversion for stresses is 1.00 N/mm = 1019.716213 gf/cm.

                            4. DATA-DRIVEN HOMOGENISATION

4.1. Review of Gaussian process regression
Gaussian process regression is a statistical inference method rooted in Bayesian statistical
learning. In the following, we briefly review the key steps in Gaussian process regression. For
further details we refer to Rasmussen et al. [22]. To begin with, we assume as a prior in the
Bayesian formulation a random function f (z) given by the zero-mean Gaussian process

                                      f (z) ∼ GP (0, k(z, z 0 )) .                                 (32)

The respective covariance function k(z, z 0 ) is chosen to be the (stationary and isotropic)
squared exponential function

                                                   (z − z 0 )T (z − z 0 )

                            k(z, z 0 ) = σf2 exp −                          ,                      (33)
                                                            2`2
DATA-DRIVEN HOMOGENISATION OF KNITTED MEMBRANES 11
where σf and ` are the yet to be determined scaling and characteristic lengthscale
hyperparameters. For convenience, we define Θ = (σf , `) as the vector of hyperparameters.
The infinitely smooth covariance function (33) encodes our prior assumptions about f (z)
before observing any training data. Other choices are possible, see [22, Chapter 4].
Next, we consider a database comprised of a known training dataset and testing points.
Each data point is given by an input vector zi and a corresponding scalar observation yi ,
with i = 1 , 2 , · · · , nGP . All training data points are collected in (Z, y) and all testing data
points with unknown y∗ in (Z∗ , y∗ ). Moreover, we define the covariance matrix K with the
components Kij = k(zi , zj ). The discretisation of the Gaussian process (32) for the considered
training and test data is given by the multivariate Gaussian distribution
y K(Z, Z) K(Z, Z∗ )
∼ N 0, . (34)
y∗ K(Z∗ , Z) K(Z∗ , Z∗ )
The probability density of the unknown data y∗ at the given locations Z∗ conditioned on the
known training data (Z, y) reads
y∗ |Z∗ , Z, y ∼ N K(Z∗ , Z)K(Z, Z)−1 y, K(Z∗ , Z∗ ) − K(Z∗ , Z)K(Z, Z)−1 K(Z, Z∗ ) .
(35)
Hence, the best estimate for y∗ is given by the expectation
y∗ = K(Z∗ , Z)K(Z, Z)−1 y , (36)
and the uncertainty of the estimate K∗ is given by the covariance matrix
cov(y∗ ) = K(Z∗ , Z∗ ) − K(Z∗ , Z)K(Z, Z)−1 K(Z, Z∗ ). (37)
The covariance matrix K(Z, Z) of size nGP × nGP is dense for the covariance kernel (33). If
the number of training points nGP become too large to invert K(Z, Z), alternative approaches
leading to sparse covariance matrices need to be considered [22, Chapter 8].
To estimate the hyperparameters Θ, we consider the marginal likelihood, or the evidence,
Z
p(y|Z) = p(y|Z, f)p(f|Z) df , (38)
with the likelihood p(y|Z, f) and the prior p(f|Z) = N (0, K(Z, Z)), where f are function values
evaluated at Z, c.f. (32). The marginal likelihood is the probability of observing the data y
for given hyperparameters Θ. Hence, it suggests itself to choose the hyperparameters so that
the probability observing the given training data y is maximised. In practice, it is numerically
more stable to compute the maximum of the log marginal likelihood given by
1 1 nGP
log p(y|Z) = − yT K−1 y − log |K| − log 2π . (39)
2 2 2
Note that the log is a monotonic function so that
Θ∗ = arg max p(y|Z) = arg max (log p(y|Z)) . (40)
Θ Θ
We use the scikit-learn Python library [48] to find Θ∗ with a gradient-based optimisation
algorithm. The marginal likelihood is a non-convex function and certain care has to be taken
to find the global maximum. After the optimal hyperparameters are determined they are used
in computing the mean (36) and covariance (37).12 S. HERATH, X. XIAO AND F. CIRAK
Figure 8. Data-driven computational homogenisation and material design framework using Gaussian
process regression.
4.2. Gaussian process homogenisation
The implemented data-driven homogenisation framework is illustrated in Figure 8 and closely
follows Bessa et al. [16]. Data-driven homogenisation begins with constructing a response
database for the RVE. This response database is designed by defining the microscale boundary
value problem (BVP) using three types of design variables, namely geometric properties Gm ,
material properties Mm and boundary conditions DM . In this paper, we concentrate on the
design variable DM relevant to homogenisation. It is straightforward to include Gm and Mm
which lead to the material design of knitted membranes.
Next, we determine the hyperparameters of the GPR model using k-fold cross-validation
rather than directly using the Θ∗ obtained with (40) considering the entire training dataset.
The GPR model is iteratively evaluated by using k − 1 folds for training and the remaining
one for testing. We choose k = 5 which provides a good compromise between accuracy and
efficiency. As error metrics for the predicted strain energy and stress resultants we use the
correlation of determination R2 and the mean squared error (MSE) given by
PnT
(yi − ybi )2
R2 (y, b
y) = 1 − Pi=1
nT 2
, (41a)
i=1 (yi − y)
nT
1 X
MSE(y, b y) = (yi − ybi )2 , (41b)
nT
i=1
where nT = bnGP /(k − 1)c is the number of the test points, y is the target output, b y is the
predicted output and y is the expectation of the target output given by the GPR model. When
evaluating the MSE of the predicted stress tensor, we take the square root of the squared sum
of the MSE of each stress resultant
q
b = MSE2 (S11 , Sb11 ) + MSE2 (S22 , Sb22 ) + MSE2 (S12 , Sb12 ).
MSE(S, S) (42)
The GPR model training is implemented in a Python environment using scikit-learn machine
learning library [48]. For each test fold, we determine the corresponding hyperparameters by
maximising the log marginal likelihood (40). It is expected that the obtained hyperparametersDATA-DRIVEN HOMOGENISATION OF KNITTED MEMBRANES 13
have similar values for all test folds. In practice, this is not the case because the log marginal
likelihood is usually a non-convex function. Therefore, we vary during optimisation the upper
and lower limits of the hyperparameters so that all test folds yield similar hyperparameter
values. Once this is achieved, we record the hyperparameters Θ∗ of the GPR model, which
has the lowest MSE, and save the model for subsequent macroscale analyses.
Lastly, we integrate our in-house thin-shell solver [32, 37] with the trained GPR model to
simulate the homogenised knitted membrane. As shown in Figure 8, for given macroscale
deformations (strains) the trained GPR model yields the corresponding predicted stress
resultants and their tangents to the macroscale shell solver.
4.3. Macroscale analysis
For plane-stress membrane deformation, a response database is created with the three in-
plane components of the Green-Lagrange strain E as the inputs and RVE volume averaged
strain energy ψ(E) as the output, i.e. zi and yi in Section 4.2. With a slight abuse of
notation E is here, in contrast to Section 2.1, a two-dimensional second order tensor. In the
four-dimensional response database, points have the coordinates (E, ψ) = (E11 , E22 , E12 , ψ).
The strain components E11 and E22 correspond to a biaxial deformation state that is decoupled
from the shear deformation state with E12 , see Section 3.1. The RVE strain energy ψ is
obtained by considering a biaxial strain state with E11 and E22 and a shear deformation state
with E12 and summing up their strain energies. We use the validated strain limits of Figure 7
in constructing the response database. Thus, allowing for a 5% compressive strains, we define
the design variables of the response database as,
1
DM = E11 ∈ [−0.05, 0.15] ,
DM 2
= DM = E22 ∈ [−0.05, 0.15] , (43)
D3 = E ∈ [0.00, 0.15] .
M 12
We solve the RVE problem with the boundary conditions stipulated by the strain states defined
in (43) and store the strain components and respective volume averaged energies in the response
database. After passing the GPR model training and testing phase, as shown in Figure 8, the
strain energy density ψb of the plane-stress deformation is predicted for a given deformed state
of the RVE. Plane stresses and stress tangents are computed by differentiating (36), that is,
bM = ∂ ψM bM = ∂ SM .
b b
S and C (44)
∂EM ∂EM
5. EXAMPLES
5.1. GPR model training and testing
We start with presenting the error metrics of GPR model training and testing for varied sizes
of response databases. GPR model training errors are observed to take values R2 = 1.0 and
MSE < 10−8 . Hence, we present only the error metrics of testing datasets. All the following
computations are performed on the Intel Core i5-4590 CPU @ 3.30GHz × 4 processor.
Figure 9 shows the MSEs of predicted energy density and second Piola-Kirchhoff stress
resultants, as well as a comparison between two sampling techniques, namely uniform sampling
and Sobol sampling [49], on the testing errors. Uniformly sampled data points are generated
in a way that for the three features in the input vector zi , n3S entries occupy the response
database, where nS is the number of uniformly distributed entries in each feature. In total
seven datasets with n3S ∈ {216, 343, 729, 1331, 1728, 2197, 4913, 12167} are considered; 80%
of each are taken as training points and the remaining as testing points. Moreover, R2 = 1.0 is14 S. HERATH, X. XIAO AND F. CIRAK
Figure 9. GPR model training and testing. The mean squared error of the predicted strain energy
density and the second Piola-Kirchhoff stress resultants for uniform and Sobol sampling.
(a) (b)
Figure 10. GPR model training and testing. Predictions of (a) strain energy density (sorted by
ascending potential) and (b) stress resultants for a biaxial strain state of E11 = [−0.05, 0.15],
E22 = 0.08 and E12 = 0.
rounded to the fifth decimal number for all response databases. MSEs in stress predictions are
comparatively higher than those in energy predictions but remain less than 2%. Considering
the error convergence and algorithmic efficiency, we use a response database with 2601 test
data points in the subsequent macroscale simulations. Furthermore, this particular trained
GPR model has the optimum hyperparameter values Θ∗ = (σf , `) = (1.25213, 0.00904) and the
maximum log marginal likelihood 9594.98391. Model training time was recorded as 29 minutes
and 48 seconds. In Figure 10, we visualise and compare the predictions of a subsample of the
chosen response database. Figure 10a depicts the strain energy density predictions, whereas
Figure 10b presents the stress predictions for the biaxial homogenised response of an RVE.
5.2. Stretched membrane I: comparison of yarn-level and homogenised displacements
We consider a membrane under uniaxial tension and compare its response using the Gaussian
process homogenised material model and an equivalent yarn-level model. The yarn-level
model comprises 12 loops in the course direction and 12 loops in the wale direction. We
use for the analysis with the homogenised material model a membrane of equal size, that
is, 10.00 mm long, 5.85 mm wide and 0.2356 mm thick. The membrane is discretised with aDATA-DRIVEN HOMOGENISATION OF KNITTED MEMBRANES 15
(a) (b)
Figure 11. Stretched membrane I. Problem description for the yarn-level (a) and the homogenised
membrane (b) models.
(a) (b)
Figure 12. Stretched membrane I. Comparison of horizontal and vertical displacement iso-contours of
the yarn-level (a) and homogenised membrane (b) models.
structured quadrilateral mesh with 12 × 12 elements. Problem descriptions of the two models
are presented in Figure 11.
Both models are stretched by 1 mm in the x-direction and the resulting x and y
displacements are presented in Figure 12. For comparison purposes, the results of the yarn
level model in Figure 12a are visualised by projecting the nodal values of the yarn onto
the x − y plane and interpolating them on a Delaunay mesh. The y-direction displacement
distribution of the yarn model in Figure 12a is slightly different from that of the homogenised
membrane in Figure 12b. This difference has two causes. First, zero out-of-plane displacement
boundary conditions on the top and bottom edges of the yarn-level model directly contribute to
the observed difference. These boundary conditions are applied to simulate selvedge stitches
that restrict the top and bottom yarns from being freely straightened during deformation.
Secondly, the geometric asymmetry of the yarn-level model about the mid-horizontal plane
has an influence on the overall response due to the relatively small number of loops used in
both course and wale directions. Furthermore, a very similar Poisson effect is observed in both
the yarn-level and homogenised membrane models. The absolute maximum y-displacement is
recorded with 0.12 mm for a stretch by 1 mm in the x-direction.16 S. HERATH, X. XIAO AND F. CIRAK
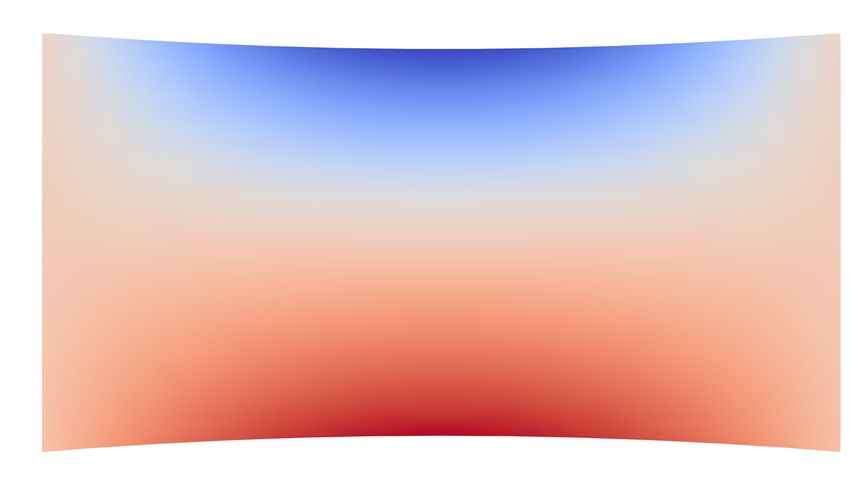
(a)
(b)
Figure 13. Stretched membrane II: Second Piola-Kirchhoff stress contours of the homogenised course-
wise stretched (a) and wale-wise stretched (b) membranes.
5.3. Stretched membrane II: homogenised stresses
We perform two stretch tests on a square knitted membrane sheet with a side length of
10 mm in the course and wale directions. A structured quadrilateral mesh of size 10 × 10
(100 elements) is used. During the displacement controlled deformation one edge is fixed while
the other is stretched in the course or wale direction, respectively, by 1 mm. The deformed
shapes and stress contours are depicted in Figure 13a for course-wise and in Figure 13b for
wale-wise stretching. Figure 13 clearly shows the orthotropic response of the knitted membrane
as the stress resultants are different depending on the direction of the stretching, comparing,
e.g., S11 in Figure 13a with S22 in Figure 13b. Furthermore, the stiffer response in the wale-
wise direction manifests itself in a higher stress S22 in Figure 13b in comparison to S11 in
Figure 13a.
6. CONCLUSIONS
We introduced a data-driven approach for computational homogenisation of knitted
membranes to address the challenges posed by conventional homogenisation schemes. The
inherent large deformations in knitted textiles are accurately captured by the finite deformation
rod model and validated against experimental and numerical results. Incorporating the
statistical GPR model in computational homogenisation circumvents the need for expensive
microscale simulations at each quadrature point of the macroscale membrane, thus yielding
significant computational savings.
The presented approach can be extended in several ways. In this paper, we considered only
weft-knitted membranes with a uniform stitch pattern. To produce complex three-dimensional
surfaces, it is necessary to alter the stitch pattern, for instance, by locally increasing or
decreasing the number of loops from row to row or reducing the number of rows. Such
changes represent discontinuities in the stitch pattern, and suitable RVEs have to be defined
to capture their homogenised response. Putting aside questions of RVE size and validity of
homogenisation assumptions, it is straightforward to consider in the introduced data-drivenDATA-DRIVEN HOMOGENISATION OF KNITTED MEMBRANES 17
approach RVEs with other stitch patterns. Furthermore, depending on the loading conditions
knitted membranes are prone to geometric instabilities in form of wrinkling on the macroscale
and rod buckling on the microscale. In presence of such instabilities the homogenisation
assumptions are usually not valid and alternative approaches must be used [50, 51]. The
data-driven variants of these approaches are essential for the analysis of large-scale knitted
membranes. Finally, a key advantage of the data-driven approach is the prospect to consider
design parameters, pertaining to the stitch geometry or yarn material, in the GPR model.
This opens up the possibility to optimise those parameters with an efficient gradient-based
optimisation algorithm.
A. DERIVATIVES OF STRAINS AND INTERNAL FORCES
In this Appendix we summarise the detailed equations used in the implementation of the
introduced finite deformation rod finite element.
A.1. Strain derivatives
The derivative of the components Eij of the strain tensor (13) with respect to the nodal
displacements uI are given by
∂α I
= a1 B,1 , (45a)
∂uI
∂βι ∂aι ∂a1,1
=− · a1,1 − aι · , (45b)
∂uI ∂uI ∂uI
∂γ 1 ∂a2 ∂a3,1
= · a3,1 + a2 · , (45c)
∂uI 2 ∂uI ∂uI
where
∂a1 I
= B,1 I,
∂uI
∂a1,1 I
= B,11 I,
∂uI
∂aι ∂Λ2
= Λ1 Aι ,
∂uI ∂uI
aι,1 = Λ2,1 Λ1 Aι + Λ2 Λ1,1 Aι + Λ2 Λ1 Aι,1 ,
∂aι,1 ∂Λ2,1 ∂Λ2 ∂Λ2
= Λ1 Aι + Λ1,1 Aι + Λ1 Aι,1 .
∂uI ∂uI ∂uI ∂uI
The derivative of the rotation matrix Λ2 in (9) with respect to the nodal displacements uI
reads
∂Λ2 ∂Λ2 ∂ â1
= , (46)
∂uI ∂ â1 ∂uI
where
∂Λ2 (Â1 + â1 ) ⊗ I I ⊗ â1 ((Â1 + â1 ) ⊗ Â1 ) ⊗ â1
=− − + ,
∂ â1 (1 + â1 · Â1 ) (1 + â1 · Â1 ) (1 + â1 · Â1 )2
∂ â1 I a1 ⊗ a1 I
= − B,1 .
∂uI |a1 | |a1 |318 S. HERATH, X. XIAO AND F. CIRAK
The derivatives of the bending and torsional shear strains in (13) with respect to the nodal
twist ϑI are given by
∂βι ∂aι
=− · a1,1 , (47a)
∂ϑI ∂ϑI
∂γ 1 ∂a2 ∂a3,1
= · a3,1 + a2 · , (47b)
∂ϑI 2 ∂ϑI ∂ϑI
where
∂aι ∂Λ1
= Λ2 Aι ,
∂ϑI ∂ϑI
∂aι,1 ∂Λ1 ∂Λ1,1 ∂Λ1
= Λ2,1 Aι + Λ2 Aι + Λ2 Aι,1 .
∂ϑI ∂ϑI ∂ϑI ∂ϑI
The derivative of the rotation matrix Λ1 in (7) with respect to the nodal twist ϑI is given by
∂Λ1 ∂Λ1 ∂ϑ
= , (48a)
∂ϑI ∂ϑ ∂ϑI
∂Λ1
= cos ϑL + sin ϑLL , (48b)
∂ϑ
where
∂ϑ
= BI ,
∂ϑI
∂Λ1,1
= cos ϑL,1 B I − sin ϑLϑ,1 B I + cos ϑLB,1
I
∂ϑI
+ sin ϑ(LL,1 + L,1 L)B I + cos ϑLLϑ,1 B I + sin ϑLLϑ,1 B,1
I
.
The second derivatives of the rotation matrix Λ1 and its derivative Λ1,1 with respect to the
nodal twist ϑI are given by
∂ 2 Λ1
= (− sin ϑL + cos ϑLL)B I B J , (49a)
∂ϑI ∂ϑJ
∂ 2 Λ1,1
= − sin ϑL,1 B I B J − cos ϑLϑ,1 B I B J − sin ϑLϑ,1 B I B,1
J
+ (LL,1 + L,1 L) cos ϑB I B J
∂ϑI ∂ϑJ
− sin ϑLLϑ,1 B I B J + cos ϑLLB I B,1 J
+ cos ϑLLB,1I
BJ .
(49b)
A.2. Internal force derivatives
We derive next the derivatives of the internal forces needed in computing the stiffness matrix.
The derivative of the internal force vector fu with respect to the nodal displacements uJ and
the twist ϑJ are given by
3
∂2α ∂ 2 βj ∂2γ
∂(fu )I ∂n ∂α X ∂mj ∂βj ∂q ∂γ
= +n + + mj + +q ,
∂uJ ∂uJ ∂uI ∂uI ∂uJ ∂uJ ∂uI ∂uI ∂uJ ∂uJ ∂uI ∂uI ∂uJ
j=2
(50a)
3
∂ 2 βj ∂2γ
∂(fu )I X ∂mj ∂βj ∂q ∂γ
= + mj + +q . (50b)
∂ϑJ ∂ϑJ ∂uI ∂uI ∂ϑJ ∂ϑJ ∂uI ∂uI ∂ϑJ
j=2DATA-DRIVEN HOMOGENISATION OF KNITTED MEMBRANES 19
Due to the symmetry of the second derivatives we have
T
∂(fϑ )I ∂(fu )I
= , (51)
∂uJ ∂ϑJ
and the derivative of the internal force vector fϑ with respect to the nodal twist ϑJ is simplified
as
3
∂ 2 βj ∂2γ
∂(fϑ )I X ∂mj ∂βj ∂q ∂γ
= + mj + +q . (52)
∂ϑJ ∂ϑJ ∂ϑI ∂ϑI ∂ϑJ ∂ϑJ ∂ϑI ∂ϑI ∂ϑJ
j=2
The second derivatives of the strains with respect to the nodal displacements uI are given by
∂2α
∂ ∂a1 ∂a1 ∂a1
= a1 · = · , (53a)
∂uI ∂uJ ∂uJ ∂uI ∂uJ ∂uI
∂ 2 βι
∂ ∂βι ∂ ∂aι ∂a1,1
=− =− · a1,1 + aι ·
∂uI ∂uJ ∂uJ ∂uI ∂uJ ∂uI ∂uI
∂aι ∂a1,1 ∂ 2 aι ∂aι ∂a1,1
=− · − · a1,1 − · , (53b)
∂uI ∂uJ ∂uI ∂uJ ∂uJ ∂uI
∂ 2 aι ∂ 2 Λ2
∂ ∂Λ2
= Λ1 A ι = Λ1 A ι , (53c)
∂uI ∂uJ ∂uJ ∂uI ∂uI ∂uJ
∂2γ
1 ∂ ∂a2 ∂a3,1
= · a3,1 + a2 · ,
∂uI ∂uJ 2 ∂uJ ∂uI ∂uI
∂ 2 a2 ∂ 2 a3,1
1 ∂a2 ∂a3,1 ∂a2 ∂a3,1
= · + · a3,1 + · + a2 · , (53d)
2 ∂uI ∂uJ ∂uI ∂uJ ∂uJ ∂uI ∂uI ∂uJ
∂ 2 a3,1
∂ ∂Λ2,1 ∂Λ2 ∂Λ2
= Λ1 A3 + Λ1,1 A3 + Λ1 A3,1 ,
∂uI ∂uJ ∂uJ ∂uI ∂uI ∂uI
∂ 2 Λ2,1 ∂ 2 Λ2 ∂ 2 Λ2
= Λ1 A 3 + Λ1,1 A3 + Λ1 A3,1 . (53e)
∂uI ∂uJ ∂uI ∂uJ ∂uI ∂uJ
And the mixed second derivatives of the strains are given by
∂ 2 βι
∂ ∂βι ∂ ∂aι ∂a1,1
=− =− · a1,1 + aι ·
∂uI ∂ϑJ ∂ϑJ ∂uI ∂ϑJ ∂uI ∂uI
∂ 2 aι ∂aι ∂a1,1
=− · a1,1 − · , (54a)
∂uI ∂ϑJ ∂ϑJ ∂uI
∂ 2 aι
∂ ∂Λ2 ∂Λ2 ∂Λ1
= Λ1 A ι = Aι , (54b)
∂uI ∂ϑJ ∂ϑJ ∂uI ∂uI ∂ϑJ
∂2γ
1 ∂ ∂a2 ∂a3,1
= · a3,1 + a2 ·
∂uI ∂ϑJ 2 ∂ϑJ ∂uI ∂uI
2
∂ 2 a3,1
1 ∂a2 ∂a3,1 ∂ a2 ∂a2 ∂a3,1
= · + · a3,1 + · + a2 · , (54c)
2 ∂uI ∂ϑJ ∂uI ∂ϑJ ∂ϑJ ∂uI ∂uI ∂ϑJ
∂ 2 a3,1
∂ ∂Λ2,1 ∂Λ2 ∂Λ2
= Λ1 A3 + Λ1,1 A3 + Λ1 A3,1
∂uI ∂ϑJ ∂ϑJ ∂uI ∂uI ∂uI
∂Λ2,1 ∂Λ1 ∂Λ2 ∂Λ1,1 ∂Λ2 ∂Λ1
= A3 + A3 + A3,1 . (54d)
∂uI ∂ϑJ ∂uI ∂ϑJ ∂uI ∂ϑJ
Lastly, the second derivatives of the strains with respect to the nodal twist ϑI take the following20 S. HERATH, X. XIAO AND F. CIRAK
Figure 14. Geometry modelling of a weft-knitted RVE (a) Different views of a RVE of a weft-knitted
textile (b) Introducing the geometric parameters that define the geometric description of the selected
RVE [52].
forms.
∂ 2 βι ∂ 2 aι
∂ ∂βι ∂ ∂aι
=− =− · a1,1 = − · a1,1 , (55a)
∂ϑI ∂ϑJ ∂ϑJ ∂ϑI ∂ϑJ ∂ϑI ∂ϑI ∂ϑJ
∂ 2 aι ∂ 2 Λ1
∂ ∂Λ1
= Λ2 A ι = Λ2 Aι , (55b)
∂ϑI ∂ϑJ ∂ϑJ ∂ϑI ∂ϑI ∂ϑJ
∂2γ
1 ∂ ∂a2 ∂a3,1
= · a3,1 + a2 ·
∂ϑI ∂ϑJ 2 ∂ϑJ ∂ϑI ∂ϑI
∂ 2 a2 ∂ 2 a3,1
1 ∂a2 ∂a3,1 ∂a2 ∂a3,1
= · + · a3,1 + · + a2 · , (55c)
2 ∂ϑI ∂ϑJ ∂ϑI ∂ϑJ ∂ϑJ ∂ϑI ∂ϑI ∂ϑJ
∂ 2 a3,1
∂ ∂Λ1 ∂Λ1,1 ∂Λ1
= Λ2,1 A3 + Λ2 A3 + Λ2 A3,1
∂ϑI ∂ϑJ ∂ϑJ ∂ϑI ∂ϑI ∂ϑI
∂ 2 Λ1 ∂ 2 Λ1,1 ∂ 2 Λ1
= Λ2,1 A 3 + Λ2 A3 + Λ2 A3,1 . (55d)
∂ϑI ∂ϑJ ∂ϑI ∂ϑJ ∂ϑI ∂ϑJ
B. GEOMETRY DEFINITION OF A WEFT-KNITTED RVE
The following equations for the geometry depicted in Figure 14 are extracted from Vassiliadis
et al. [45] and smoothened at C 0 locations to recover the real smooth geometry of the RVE.
In part EM (0 < y < c/2):
2r
x(y) = − y , (56a)
qc
2
z(y) = (s + r) − y 2 − (s + r) , (56b)DATA-DRIVEN HOMOGENISATION OF KNITTED MEMBRANES 21
" 2 2 #
1 t t
where s = c−r− − r+ .
4r 2 2
In part MK (c/2 < y < c/2 + R):
s
y − c/2
x(y) = h − a 1− , (57a)
b
q
2
z(y) = (s + r) − y 2 − (s + r) , (57b)
c π c t c − 2r sin γ
where h= − R tan −φ , R = − − r, φ = arctan and
2 2 2 2 2r
c/2
γ = arcsin .
s+r
In part KA (x(y = c/2 + R) < x < w/4):
q
2 2
y(z) = (s + r) − (z + s + r) , (58a)
p
z(x) = OZ − A2 − (x − OX)2 , (58b)
where
OZ = (x2 − OX)2 − (x1 − OX)2 + z22 − z12 /2(z2 − z1 ) ,
p
A = (x1 − OX)2 + (z1 − OZ)2 ,
OX = w/4 .
Additionally, (x1 , z1 ) and (x2 , z2 ) are the coordinates of two points in part MK with
y1 = c/2 + R − 0.001 and y2 = c/2 + R.
A cubic B-spline curve was fitted at C 0 continuous locations namely, M and K. Moreover,
this smooth curve EMKA is mirrored on the vertical axis passing at point A to obtain the
complete geometry of the red yarn shown in Figure 14. Lastly, one smooth EMKA is rotated
and translated appropriately to create the blue left yarn of Figure 14 and mirrored subsequently
to complete the RVE geometry.
REFERENCES
1. J McCann, L Albaugh, V Narayanan, A Grow, W Matusik, J Mankoff, and J Hodgins. A compiler for
3D machine knitting. ACM Transactions on Graphics, 35:1–11, 2016.
2. M Popescu, M Rippmann, T Van Mele, and P Block. Automated generation of knit patterns for non-
developable surfaces. In Humanizing Digital Reality, pages 271–284. Springer, 2018.
3. Y Luo, K Wu, T Palacios, and W Matusik. KnitUI: Fabricating interactive and sensing textiles with
machine knitting. In Proceedings of the 2021 CHI Conference on Human Factors in Computing Systems,
pages 1–12, 2021.
4. A Maziz, A Concas, A Khaldi, J Stålhand, N-K Persson, and E W H Jager. Knitting and weaving artificial
muscles. Science Advances, 3:e1600327, 2017.
5. N-K Persson, J G Martinez, Y Zhong, A Maziz, and E W H Jager. Actuating textiles: next generation of
smart textiles. Advanced Materials Technologies, 3:1700397, 2018.
6. K H Leong, S Ramakrishna, Z M Huang, and G A Bibo. The potential of knitting for engineering
composites — a review. Composites Part A: Applied Science and Manufacturing, 31:197–220, 2000.
7. H Hasani, S Hassanzadeh, M J Abghary, and E Omrani. Biaxial weft-knitted fabrics as composite
reinforcements: A review. Journal of Industrial Textiles, 46:1439–1473, 2017.
8. M Popescu, L Reiter, A Liew, T Van Mele, R J Flatt, and P Block. Building in concrete with an ultra-
lightweight knitted stay-in-place formwork: prototype of a concrete shell bridge. In Structures, volume 14,
pages 322–332, 2018.
9. D Perić, EA de Souza Neto, RA Feijóo, M Partovi, and AJ Carneiro Molina. On micro-to-macro transitions
for multi-scale analysis of non-linear heterogeneous materials: unified variational basis and finite element
implementation. International Journal for Numerical Methods in Engineering, 87:149–170, 2011.22 S. HERATH, X. XIAO AND F. CIRAK
10. M G D Geers, V G Kouznetsova, K Matouš, and J Yvonnet. Homogenization methods and multiscale
modeling: Nonlinear problems. In Encyclopedia of Computational Mechanics. John Wiley & Sons, Ltd,
2017.
11. S Saeb, P Steinmann, and A Javili. Aspects of computational homogenization at finite deformations: a
unifying review from reuss’ to voigt’s bound. Applied Mechanics Reviews, 68, 2016.
12. B Nadler, P Papadopoulos, and D J Steigmann. Multiscale constitutive modeling and numerical simulation
of fabric material. International Journal of Solids and Structures, 43:206–221, 2006.
13. S Fillep, J Mergheim, and P Steinmann. Computational modelling and homogenization of technical
textiles. Engineering Structures, 50:68–73, 2013.
14. D Liu, S Koric, and A Kontsos. A multiscale homogenization approach for architectured knitted textiles.
Journal of Applied Mechanics, 86:111006, 2019.
15. H Do, Y Y Tan, N Ramos, J Kiendl, and O Weeger. Nonlinear isogeometric multiscale simulation for design
and fabrication of functionally graded knitted textiles. Composites Part B: Engineering, 202:108416, 2020.
16. M A Bessa, R Bostanabad, Z Liu, A Hu, D W Apley, C Brinson, W Chen, and W K Liu. A framework for
data-driven analysis of materials under uncertainty: Countering the curse of dimensionality. Computer
Methods in Applied Mechanics and Engineering, 320:633–667, 2017.
17. B A Le, J Yvonnet, and Q-C He. Computational homogenization of nonlinear elastic materials using
neural networks. International Journal for Numerical Methods in Engineering, 104:1061–1084, 2015.
18. V Nguyen-Thanh, L Nguyen, T Rabczuk, and X Zhuang. A surrogate model for computational
homogenization of elastostatics at finite strain using high-dimensional model representation-based neural
network. International Journal for Numerical Methods in Engineering, 121:4811–4842, 2020.
19. L Wu, N G Kilingar, and L Noels. A recurrent neural network-accelerated multi-scale model for elasto-
plastic heterogeneous materials subjected to random cyclic and non-proportional loading paths. Computer
Methods in Applied Mechanics and Engineering, 369:113234, 2020.
20. K Karapiperis, L Stainier, M Ortiz, and J E Andrade. Data-driven multiscale modeling in mechanics.
Journal of the Mechanics and Physics of Solids, 147:104239, 2021.
21. A Platzer, A Leygue, L Stainier, and M Ortiz. Finite element solver for data-driven finite strain elasticity.
Computer Methods in Applied Mechanics and Engineering, 379:113756, 2021.
22. C E Rasmussen and C K I Williams. Gaussian processes for machine learning. MIT Press, 2006.
23. J C Simo. A finite strain beam formulation. The three-dimensional dynamic problem. Part I. Computer
Methods in Applied Mechanics and Engineering, 49:55–70, 1985.
24. J C Simo and L Vu-Quoc. A three-dimensional finite-strain rod model. part ii: Computational aspects.
Computer Methods in Applied Mechanics and Engineering, 58:79–116, 1986.
25. A Cardona and M Geradin. A beam finite element non-linear theory with finite rotations. International
Journal for Numerical Methods in Engineering, 26:2403–2438, 1988.
26. K Kondo, K Tanaka, and Atluri S N. An explicit expression for the tangent-stiffness of a finitely deformed
3-d beam and its use in the analysis of space frames. Computers & Structures, 24:253–271, 1986.
27. G Jelenić and M A Crisfield. Geometrically exact 3D beam theory: implementation of a strain-invariant
finite element for statics and dynamics. Computer methods in applied mechanics and engineering, 171:141–
171, 1999.
28. C Meier, A Popp, and W A Wall. An objective 3D large deformation finite element formulation for
geometrically exact curved Kirchhoff rods. Computer Methods in Applied Mechanics and Engineering,
278:445–478, 2014.
29. A M Bauer, M Breitenberger, B Philipp, R Wüchner, and K-U Bletzinger. Nonlinear isogeometric spatial
Bernoulli beam. Computer Methods in Applied Mechanics and Engineering, 303:101–127, 2016.
30. J C Simo, D D Fox, and M S Rifai. On a stress resultant geometrically exact shell model. Part II:
The linear theory, computational aspects. Computer Methods in Applied Mechanics and Engineering,
73:53–92, 1989.
31. J C Simo and D D Fox. On a stress resultant geometrically exact shell model. Part I: Formulation and
optimal parameterization. Computer Methods in Applied Mechanics and Engineering, 72:267–304, 1989.
32. F Cirak, M Ortiz, and P Schröder. Subdivision surfaces: A new paradigm for thin-shell finite-element
analysis. International Journal for Numerical Methods in Engineering, 47:2039–2072, 2000.
33. F Cirak and M Ortiz. Fully c1 -conforming subdivision elements for finite deformation thin-shell analysis.
International Journal for Numerical Methods in Engineering, 51:813–833, 2001.
34. J Kiendl, K-U Bletzinger, J Linhard, and Wüchner R. Isogeometric shell analysis with Kirchhoff-Love
elements. Computer Methods in Applied Mechanics and Engineering, 198:3902–3914, 2009.
35. F Cirak, Q Long, K Bhattacharya, and M Warner. Computational analysis of liquid crystalline elastomer
membranes: Changing Gaussian curvature without stretch energy. International Journal of Solids and
Structures, 51:144–153, 2014.
36. F Cirak and Q Long. Subdivision shells with exact boundary control and non-manifold geometry.
International Journal for Numerical Methods in Engineering, 88:897–923, 2011.
37. Q Long, P B Bornemann, and F Cirak. Shear-flexible subdivision shells. International Journal for
Numerical Methods in Engineering, 90:1549–1577, 2012.
38. M A Crisfield. Non-linear finite element analysis of solids and structures. John Wiley & Sons, 1997.
39. P G Ciarlet. An Introduction to Differential Geometry with Applications to Elasticity. Springer, 2006.
40. P Wriggers and G Zavarise. On contact between three-dimensional beams undergoing large deflections.
Communications in Numerical Methods in Engineering, 13:429–438, 1997.
41. O Weeger, B Narayanan, L De Lorenzis, J Kiendl, and M L Dunn. An isogeometric collocation method
for frictionless contact of Cosserat rods. Computer Methods in Applied Mechanics and Engineering,
321:361–382, 2017.You can also read