Defence Program Fiscal Sustainability of Canada's National - Ottawa, Canada March 26, 2015 www.pbo-dpb.gc.ca
←
→
Page content transcription
If your browser does not render page correctly, please read the page content below

Fiscal Sustainability of Canada’s National
Defence Program
                                   Ottawa, Canada
                                    March 26, 2015
                                 www.pbo-dpb.gc.ca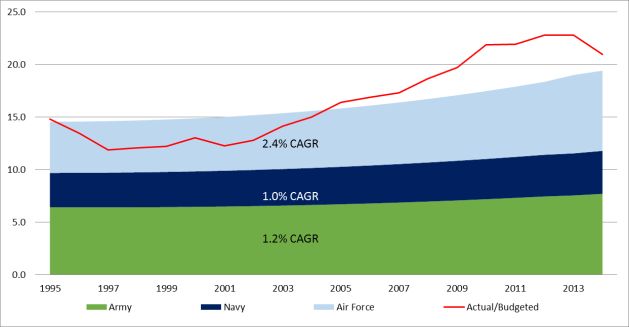
Fiscal Sustainability of the National Defence Program

The mandate of the Parliamentary Budget Officer (PBO) is to provide independent analysis to Parliament on
the state of the nation’s finances, the government’s estimates and trends in the national economy; and upon
request from a committee or parliamentarian, to estimate the financial cost of any proposal for matters over
which Parliament has jurisdiction.

This report provides PBO’s estimate of the fiscal gap between the status quo budget allocations and the cost of
sustaining Canada’s status quo national defence forces. Parliamentarians may wish to examine scenarios that
will reduce or eliminate the gap between the cost of maintaining the current force structure and the amount
of funding being allocated to paying for it.

Prepared by: Peter Weltman *

* The author would like to thank David Perry and George Petrolekas for their assistance in the research and
preparation of this work, Mostafa Askari, Erin Barkel, Negash Haile, Jason Jacques and Rod Story for their
helpful comments; and Pat Brown and Jocelyne Scrim for their assistance in preparation of this report. The
author would also like to thank our third-party reviewers: David Arthur, Senior Analyst, National Security
Division, Congressional Budget Office; Mark Thomson, Senior Analyst and Andrew Davies, Senior Analyst and
Director of Research, Australian Strategic Policy Institute; and Dr. Craig Stone, Director of Academics, Canadian
Forces College. Any errors or omissions are the responsibility of the author. Please contact Peter Weltman
(email: Peter.Weltman@parl.gc. ) or Mostafa Askari (email: Mostafa.askari@parl.gc.ca) for further
information.

                                                        ii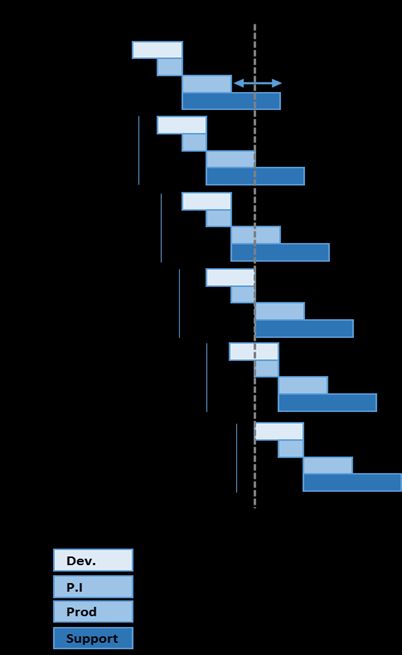
Fiscal Sustainability of the National Defence Program

Contents

Executive summary ........................................................................................................ 1
1    Introduction: Fiscal sustainability of Canada’s National Defence program .............. 2
    1.1    Background – The defence portfolio.................................................................. 3
    1.2    Use of funds - What is Canada’s National Defence program? ............................ 3
    1.3    What is force structure? .................................................................................... 4
    1.4    Source of Funds - Historical defence budget allocations .................................... 4
2    Methodology - Assessing fiscal sustainability of the defence program .................... 5
    2.1    Forecasting future defence budgets .................................................................. 5
    2.2    Projecting the future cost of the force structure ............................................... 6
3    Model results ......................................................................................................... 10
    3.1    Force structure cost vs. expenditures .............................................................. 10
    3.2    Force structure cost: Army, Navy, Air Force .................................................... 11
    3.3    Force structure cost: personnel, capital, other operating ............................... 11
    3.4    Forecast budget scenarios ............................................................................... 13
    3.5    Model Sensitivity ............................................................................................. 14
4    Conclusions and observations................................................................................ 15
Appendix A - Key Model Assumptions ......................................................................... 15
References ................................................................................................................... 16
Endnotes ...................................................................................................................... 17

                                                                iii
Fiscal Sustainability of the National Defence Program
Executive summary The government’s Canada First Defence Strategy
(CFDS) promised to raise the nominal (non-inflation
This report examines sustainability of the national adjusted) annual increase in defence expenditure to
defence program by providing two estimates: a 2 per cent starting in fiscal year 2011-2012, investing
‘source of funds’ forecast, meaning a forecast of a total of $490 billion over a 20-year horizon, in an
future defence budgets; and a ‘use of funds’ effort to provide the military with reliable funding.1
estimate, meaning the cost of delivering a national
defence program. However, PBO’s long-term defence program
affordability estimate (the ‘should-cost’ estimate)
The Parliamentary Budget Office (PBO) estimates indicates that defence costs will become
that the current force structure of the Department of unsustainable over the next 10 years. Our modelling
National Defence (DND) is unsustainable at current shows that until 2014, there were sufficient funds to
funding levels. To achieve sustainability, it will be maintain the program. The cost to maintain Canada’s
necessary to change the force structure, increase the national defence force structure increased at roughly
amount of funding allocated to DND, or implement a 1.5 per cent per year in real terms (adjusted for
combination of the two. inflation) from 1995 to 2014; over the same period,
defence spending increased 1.9 per cent per year in
In the 2013-2014 fiscal year, DND expenditures
real terms.
totalled $21.5 billion, accounting for 1.1 per cent of
gross domestic product (GDP). Of that amount, In Summary Figure 1-1, PBO estimates that the
roughly half went toward personnel costs and annual, inflation-adjusted rate of growth in the cost
roughly one-third was used for operations and of maintaining the force structure from 2015
infrastructure; the balance went toward the onwards will be 2.5 per cent per year.
acquisition and replacement of capital equipment.
Summary Figure 1-1 Historic and forecast defence budgets against cost to maintain force structure
Sources: Fiscal Reference Tables, PBO, DAS Ltd.
1Fiscal Sustainability of the National Defence Program
PBO calibrated the model to the 1995 force composition and costs of the nation’s defence
structure, to ensure that the slope of the program that continue many years into the future.
expenditure line to 2012 and beyond was
reasonable. Because the model is driven by force Recognizing this fact, other countries provide greater
detail regarding long-term defence expenditure
structure, notably the size of the regular force and
associated equipment and support costs, calibrating sustainability plans.
to a different year will produce a different outcome. In the United States, the Department of Defence
The report should be read with that in mind. Please (DoD), in conjunction with the President’s budget,
refer to Section 3.5 Model Sensitivity, on page 14, for publishes a five-year Future Years Defence Program
more detail. (FYDP). It is then assessed by the US Congressional
Budget Office (CBO) to provide Congress with a 15-
1 Introduction: Fiscal sustainability of
Canada’s National Defence program year projection of DoD budget requirements.3
The legislative mandate of the Parliamentary Budget In the United Kingdom, the Ministry of Defence
Officer (PBO) includes providing independent (MoD ) committed to publish a Statement of
analysis on the state of the nation’s finances. This Affordability, partly in response to significant
report examines defence sustainability by providing affordability problems in its budget in 2009, and
two forecasts: a ‘source of funds’ forecast, meaning following the Strategic Defence and Security Review
a forecast of future defence budgets; and a ‘use of in 2010. The statement is an attestation to
funds’ forecast, meaning the cost of delivering a Parliament of the gap between the costs of the
national defence program. defence program and the long-term forecast budget
allocation.
Canada’s National Defence program consumes about
7 per cent of total government expenditures, and In conjunction with that statement, the MoD
accounts for roughly 20 per cent of total direct publishes detailed defence acquisition plans 10 years
program expenditures. At present, Parliament has into the future.4 The UK National Audit Office
an incomplete picture about the medium and longer- provides its own independent analysis of that plan to
term affordability of the defence program. the House of Commons and is building capacity to
eventually provide an audit opinion of the Statement
Although departmental spending estimates of Affordability.
published in the Report on Plans and Priorities
present the department’s estimate of its funding The Australian Strategic Policy Institute, a
requirements over a three-year period, it is subject government-funded defence think tank, produces an
to considerable variation in the transition from annual defence budget brief. The report’s purpose is
planned activities to execution.2 Consequently, to scrutinize in detail defence expenditure, cost, and
parliamentarians do not have a complete picture of policy decisions over a long-term horizon.5
the sustainability of the defence program at current
While it is true that the long-term plans of the United
or future funding levels.
States and United Kingdom can also be subject to
Near-term defence budgeting and procurement variations from plans to execution, it is important to
decisions can have significant consequences for the note that these long-term assessments are
nonetheless made available to their respective
legislatures.
2Fiscal Sustainability of the National Defence Program
The fundamental purpose of these analyses is to 1.2 Use of funds - What is Canada’s
advise the legislatures and citizens of these National Defence program?
respective countries on the long-term affordability of
National Defence is a government program with
their defence programs in addition to providing a
three key objectives:7
framework for an informed legislative debate around
an appropriate budget allocation. At present, there is 1. Defence of Canada: protecting Canada’s
nothing comparable provided by DND to Canada’s interests at home and abroad.
Parliament.6
2. Defence of North America in partnership
1.1 Background – The defence portfolio with the United States.
For the purpose of this analysis, the expenditure 3. Contributing to international peace and
amounts provided for the National Defence portfolio, security.
as outlined in the Public Accounts of Canada, are The ultimate purpose of Canada’s defence program is
used as a proxy for the budget provided to maintain to defend Canada’s interests and sovereignty and to
the defence force structure. Strictly speaking, keep all Canadians safe and secure. Canada’s
expenditures in the portfolio can be broken out as National Defence program is delivered by DND.
follows in Table 1.
The program’s ‘fundamental purpose is to employ
Table 1 Canada’s National Defence portfolio military armed forces, including deadly forces,
lawfully at home or abroad, at the direction of the
Agency Expenditure Percent of
($M) Total
government’8. It relies primarily on the ability and
readiness to project military force to meet these
Department of National $18,764.4 98 objectives.
Defence
To do so, DND must remain flexible, prepared, and
Communications Security 443.6 2
Establishment (CSE)
capable of sustaining an agile world‐class force, one
that is able to protect Canadians at home effectively,
Military Grievances External 5.9 - while remaining a strong and reliable partner on the
Review Committee
continent, all while making a valuable contribution to
Military Police Complaints 5.5 - international security.9
Commission
DND manages Canada’s defence program using a
Offices of the CSE 1.9 -
combination of personnel and equipment readiness.
Commissioner Readiness is the term used to define the state of
equipment and personnel. Both effort and
Source: Public Accounts of Canada 2014
budgetary resources are required to maintain
equipment and personnel at specified levels of
Although the portfolio includes some items that are
combat capability.
not strictly related to the cost of the force structure,
the table above shows that the dollar value of these Equipment requires regular renewal, replacement,
items is not material. and maintenance to meet a certain level of
operational capability. Personnel require regular
3Fiscal Sustainability of the National Defence Program
training, almost always necessitating the use of ’National Defence’ portion of the government’s
equipment, to meet appropriate levels of operational direct program expenses, as reflected in the
capability. Department of Finance Fiscal Reference Tables
(FRT).11
1.3 What is force structure?
1.4 Source of Funds - Historical defence
“Force structure” is the combat-capable part of a budget allocations
military organisation which describes how military
personnel, their weapons, and their equipment, are Figure 1-1 below shows, annual defence spending in
organized for operations or demanded by the Canada has increased in real (inflation-adjusted)
environment of the conflict. terms over the past 30 years at an average annual
rate of 1.2 per cent. However, it has varied between
Force structuring considers the allocation of military periods of significant growth and periods of
personnel, their skills, and the relationship among significant decline.
military units required to provide mutual support
during military operations as a military capability of Figure 1-1 Historical defence expenditure ($B 2012)
the armed forces in part or as a whole. In Canada,
the military organization is known as the Canadian
Armed Forces.
The combat-capable part of the organization relies
extensively on the efforts of the non-combat-capable
portion of the organization for support in providing
materiel and resources. These include construction
and maintenance of defence infrastructure and
works needed to support the Canadian Armed Forces
across Canada, as well as research relating to
defence and security science and technology, and
providing equipment and technological advantages
needed to defend Canada’s interests.
Changes in force structure can be caused not only by
modifications in forms of warfare and doctrine and Sources: Fiscal Reference Tables, Veterans Affairs Canada
changes to the threat environment, but also by rapid
change in technology and budgetary considerations Following the end of the Cold War in 1989, defence
based on the wider national economy.10 spending was reduced almost 30 per cent in real
terms from the 1990s to the mid-2000s as Canada
For the purposes of this analysis, the PBO defines the attempted to address significant fiscal deficits.
costs incurred in supporting the combat and non-
combat capable parts of the organization as the cost For example, in the early 1990s, the Forces consisted
of 87,000 regular force personnel, which was
of the defence program’s force structure.
reduced to 60,000 by 1999 as a result of Program
The budget allocation made available to support the Review. In 2008, the CFDS provided resources to
force structure is represented in this analysis as the expand the regular force to 70,000 and the primary
4Fiscal Sustainability of the National Defence Program
reserve to 30,000. Currently, the regular force of government, has averaged 6.9 per cent of total
numbers 68,000 and the primary reserves, 27,000.12 government expenditure over the past 30 years.
13
Figure 1-3 Federal government expenditures (per
As seen in Figure 1-2, defence spending as a share of cent of total)
GDP hovered around the 1.7 per cent range from
1984 to 1991. Subsequently, defence spending as a
share of GDP steadily declined from 1.5% in 1992 to
1 per cent in 1999. The proportion remained at that
level until 2010, when the increases promised in
CFDS brought defence spending up to 1.3 per cent of
GDP.
Since 1995, defence spending has not exceeded 1.3
per cent of GDP. In 2013-2014, defence spending
Source: Fiscal Reference Tables
was $21.5 billion, about 1.1 per cent of GDP. Over
the past 30 years, defence spending as a portion of 2 Methodology - Assessing fiscal
all government direct program expenditure has sustainability of the defence program
remained relatively constant, within a range of 18-22
per cent. This report assesses the cost of the current force
structure, projects that cost forward for 10 years into
Figure 1-2 Defence expenditure as a share of direct the future and compares the projected cost of the
program expenditures (LHS) and GDP (RHS) force structure to the projected budget available. It
does not take into account any substantive changes
in force structure. Its purpose is to provide a baseline
‘status quo’ estimate, to be used as a starting point
for discussion and debate.
2.1 Forecasting future defence budgets
Although the Department of National Defence
presents its budget request to Parliament on a partial
accrual14 basis, PBO’s budget forecast relies on past
expenditure as recorded by the Department of
Source: PBO, Fiscal Reference Tables Finance in the Fiscal Reference Tables, as well as
projected expenditures as recorded in successive
Figure 1-3 illustrates defence spending as a share of federal budgets.
total government spending, relative to other forms
of major government expenditures. These figures are recorded on an accrual basis. The
force structure cost (discussed in Section 2.2
Defence spending as a share of total government “Projecting the future cost of the force structure”) is
spending, which includes public debt charges, also calculated on an accrual basis. Box 1 below
transfers to individuals, and transfers to other levels outlines why an accrual basis is appropriate for
projecting program sustainability.15
5Fiscal Sustainability of the National Defence Program
All of the figures used in this section are drawn from adjusted expenditures for the defence program in
the Fiscal Reference Tables, Budget Plans from 2010, response to the recession of 2008.
2012, and 2014, as well as information received from
the Department of Finance through an information Figure 2-1 outlines in grey the historical expenditure,
followed by the succession of spending reductions
request made by the PBO,16 which provided a year by
year defence budget allocation from 2008 to 2020.17 first announced in Budget 2010. It is important to
In addition, PBO adjusted the budget forecast to note that the historical defence expenditures include
reflect projected increases in wages and salaries that funding for overseas military operations and the
would not have been included in the department’s 2010 Olympics.21
forecast budget.18 Unless otherwise noted, all
Figure 2-1 Historic and forecast defence budgets
figures have been adjusted for inflation, using 2012
($B 2012)
as a base year and using the Consumer Price Index
inflation factors published by Statistics Canada.19
Box 1 Budgeting in the federal government:
accrual and modified cash basis
The Government of Canada adopted full accrual
accounting as its basis for budgeting in Budget 2003. It
provides information on: (a) a government's ability to
meet its financial obligations, both short- and long-term;
(b) a government's ability to maintain the level and quality
20
of its services and to finance new programs.
This PBO report is a study of the sustainability of the
defence program in future years. The amounts allocated in Sources: Fiscal Reference Tables, PBO
federal budgets to DND represent the government’s
resource commitment to enable delivery of the defence
program. These funds are set aside in the fiscal 2.2 Projecting the future cost of the force
framework on an accrual basis. structure
Departments seek authorities from Parliament on a cash To determine the affordability of the defence
basis to ensure sufficient resources for program delivery in program, it is necessary to project the estimated cost
the short term, but this does not provide sufficient
information to address points a) and b) above.
of maintaining the force structure over the longer
term.
There can be significant differences in cash vs. accrual
expenditure amounts for any given year. For example, in To undertake this portion of the analysis, PBO
2013-2014, the Department of National Defence engaged Decision Analysis Services Limited (DAS) a
expended $19.2 billion on a cash basis, but used $21.5
billion of ‘fiscal room’ on an accrual basis. UK consulting firm specializing in defence costing. It
has provided similar analysis to the UK Ministry of
The difference represents the non-cash costs of the Defence.
amortization, or ‘wear and tear’, of DND’s capital assets
and equipment, as well as any funds that have been set
2.2.1 DAS force structures model
aside to fund current or future capital investments.
Since the Canada First Defence Strategy was The DAS force structures model is designed to
introduced in 2008, successive federal budgets have provide insight into the long-term impact of the key
cost drivers on future department of defence budget
6Fiscal Sustainability of the National Defence Program
needs. Using key assumptions (Appendix A - Key relationships between the weight of a jet airplane
Model Assumptions), the model represents all and its cost of manufacture and support.
support, “tooth to tail” and equipment acquisition
costs and is designed to project these costs beyond The DAS model uses dozens of cost estimating
relationship models. It relies on extensive research
the traditional three-year reporting period of the
Estimates. Figure 2-2 below provides a schematic to into rates of escalation for types of defence
illustrate how the model operates. equipment, unit costs of contemporary equipment,
trends in development timelines, trends in service
Figure 2-2 Force structures model overview lives, and real rates of growth in personnel costs.
Some of these data are published within the Source
Book of Defence Equipment Costs.24
To establish a baseline personnel cost, the model
requires the establishment of traditional frontline
force structure units (that is, ships, regiments,
squadrons and so on), and from there, estimates of
the associated personnel, including those in training,
command and administrative posts.
2.2.2.1 Equipment acquisition
Source: DAS
At any time over the study period, there will be a
number of major equipment acquisition projects
The model is designed to provide an understanding
ongoing. The model assumes that year-to-year
of budget envelopes, constraints, and the likely
variations are minimized in order to smooth the
consequences of major defence policy changes.
funding cycle.
The model does not provide annual forecasts, but
The model, therefore, attributes an average annual
rather identifies long-term cost trends. funding requirement for each project in any given
Similarly, the model does not look at individual year. This does not allow the model to represent the
procurement programs or short-term changes in details of any one project in any given year. But the
management programs such as the Deficit Reduction point of this study is to project what funds are
Action Plan.22 The model is not intended to replace required over the study’s span to complete whatever
detailed, bottoms-up analysis of present and future projects are included over their respective time
force structures. horizons.
Overhead factors are also established for minor
2.2.2 Model operation
projects, logistic overheads, costs of training and
The DAS model uses parametric modelling number of service support personnel, using
techniques23 that rely on data taken from public information from the current force. These factors
domain sources. Parametric estimating is a technique are assumed to apply in all years.
used to develop cost estimates based on previously To provide an annual requirement to meet the
observed and validated cost estimating relationships. specified force structure, the model runs through the
For example, there exist well-known statistical following activities:
7Fiscal Sustainability of the National Defence Program
Identifies replacement strategies for each those to get a rate of cost growth (or decline). At
equipment type and computes replacement the start and end of the planning period, the
equipment costs, in accordance with a model calculates the required rate of spending
standardized equipment replacement schedule and the associated cost escalation rate required
(Figure 2-3). to maintain the given force structures.
Figure 2-3 Acquisition of a unit of force element Through interpolation between these start and
equipment is represented as a generic project cycle end data (both expenditures and rates of change
within the industrial sector of expenditures), the model estimates
expenditures in each year of the period covered
for each of nine categories of expenditure:
capital, personnel and other operating costs for
each of Naval, Land and Air technology areas.
The model then aggregates these calculations
appropriately to provide the overall defence
budget expenditure required to support the
status-quo force structure into the future. It is
important to note that the model assumes that
existing capabilities will be maintained.25
Source: DAS. ISD is In Service Date
Identifies the number of front line personnel
required to man this structure and applies its
historic ratio data to compute the associated
personnel cost for the specified force structure,
including the ‘back-room’ personnel.
Calculates the associated spares, repairs, and
consumables cost of the proposed force
structure.
Assumes that the acquisition community is
actively developing next generation equipment
following completion of the current acquisition
program. The acquisition cycle is assumed to be
a continuous set of development, production
investment, production, and support activities
(see Figure 2-4 ).
Adds allowances for personnel and other support
so as to obtain total materiel running costs.
Computes and stores data as above for the start
and end years of the period being considered
and for the years immediately following both of
8Fiscal Sustainability of the National Defence Program
Figure 2-4 Acquisition is a continuous set of equipment type using statistical relationships derived
activities through analyses of a large number of past
comparable projects.
Personnel support costs and expenditure in support
of other activities (such as defence procurement) are
treated as overheads on the costs of personnel and
capital expenditure. This calculation uses ratios of
personnel support to personnel costs and ratios of
other support to capital expenditure obtained via
analysis of the 2007 UK defence budget, calibrated to
the Canadian situation.26
2.2.3 Calibration and model inputs:
‘Canadianizing’ the model
The force structure model was calibrated against
historical and current Canadian force structure
inputs. This process involved detailed collation,
synthesizing, and triangulation of the data sources. 27
The DAS ‘should cost’ model projects the cost of
maintaining the force structure as it exists at 2012. In
order to ensure that the slope of the expenditure
curve was reasonable, the model was calibrated to
Source: DAS back to 1995. The year 1995 was chosen because it
represents the last year of the round of major budget
Thus, if we consider Year “Y”, we can see that there cuts that occurred during Program Review, and it
are a number of concurrent equipment generations represents the mid-point of the effect of the cuts.
at varying stages of their lifecycle. These are used to With the assistance of subject matter experts and
determine average costs of development, using public domain data, PBO undertook an
production, and in-service costs calculated using the inventory of the force structure elements and
parametric cost estimating relationships described composition in 1995 and in 2012.
earlier.
Once the inputs were established for 1995, the
Equipment operating costs include provision of model was used to forecast the expenditure required
spares, repairs, and the like to keep equipment in to move from the 1995 force structure to the 2012
use; accommodation and other personnel support, force structure. This was compared against actual
such as bases and infrastructure; as well as other expenditures over that time period.
support activities, such as the significant resources
The model also requires an input of the spending
dedicated to supporting defence procurement.
broken out by capital, personnel, and other
Costs of spares, repairs, and consumables are expenses. While DND does not report expenses in
estimated from production cost, quantity, and this manner, PBO was able to provide this
9Fiscal Sustainability of the National Defence Program
information using public accounts data supported by required to maintain the existing force structure. A
independent analyses.28 variety of studies undertaken since that period
confirm that the national defence program suffered
The most significant challenge to calibrating the from symptoms of ‘hollowing-out”.29 30 31 32
model was ensuring that the cost base used in the
model and the cost base used by DND were aligned. Figure 3-1 Estimated cost to support the force
This required some effort in normalizing inflation and structure against actual expenditure 1995-2014 ($B
currency exchange rates, as well as ensuring that any 2012)
modifications to equipment types were reasonably
“Underinvestment Period” “Overinvestment Period”
accounted for in the model.
3 Model results
The DAS force structures model returns results in a
variety of formats. To ensure that the model was
predicting reasonable results for the Canadian
situation, we compared the change in the estimated
cost of the force structure from 1995 to 2014 against
actual defence expenditure for the same period.
Sources: Fiscal Reference Tables, DAS Model Projection
We also broke out the defence expenditure by
service area, and by standard object of expenditure. Once Canada’s fiscal situation was stabilized, defence
If the model was behaving reasonably, we would spending started to increase the following year in
expect that the changes in force structure cost and recognition of the fact that the defence program
composition predicted by the model compare needed to be re-built.33
reasonably closely with current conditions.
Consequently, the period from 2005 to 2014 shows
It is important to remember that the model assumes cumulative expenditures exceeding the ‘should-cost’
ongoing capital replenishment and replacement; it total by roughly $20.9 billion. From 1995 until the
also assumes that year-over-year variations are end of fiscal year 2014, there is a cumulative surplus
minimized. There will be small discrepancies of $7.5 billion between what was spent and the
between actual expenditure figures for any given estimated cost to support the force structure.
year and what the model returns as a ‘should cost’
expenditure amount. The recent budget cuts at the Department of
National Defence appear to signal the start of
3.1 Force structure cost vs. expenditures potentially another period of underinvestment. The
model shows that the cost of maintaining the current
Figure 3-1 illustrates the cyclicality of defence
force structure is projected to grow at an inflation-
spending in Canada. The most significant budget
adjusted rate of 2.5 per cent per year from 2014 to
cuts under program review occurred from 1995 to
2025, (Figure 3-5 on page 14 ), which is higher than
2004 and are represented as the ‘underinvestment’
forecast real GDP growth of 1.6 per cent per year
period on the chart. The cumulative defence
over the same horizon.
expenditure over that period of time was roughly
$13.4 billion below what our modelling showed was
10Fiscal Sustainability of the National Defence Program
3.2 Force structure cost: Army, Navy, Air 3.3 Force structure cost: personnel,
Force capital, other operating
Figure 3-2 shows the costs of the force structure Figure 3-3 shows the costs of the force structure
broken out by service area, and the changes in those broken out by key standard objects of expenditure:
costs from 1995 to 2014. personnel expenditures, capital expenditures, and
other operating expenditures.
Figure 3-2 Historical defence budgets and share by
service area, 1995-2014 ($B 2012) Figure 3-3 Historical defence budgets and share by
standard object of expenditure, 1995-2014 ($B
2012)
Source: DAS Model Projection. CAGR = Compound Annual Growth Rate
Source: DAS Model Projection. CAGR = Compound Annual Growth Rate
While the Army’s component of total expenditure
remains the largest from 1995 to 2014, its share has
In 1995, personnel costs accounted for 51 per cent of
fallen due to relatively low cost escalation. Each of
defence expenditure; by 2014, its share had dropped
the services made a range of changes in its force
to 47 per cent. Meanwhile, over the same period, the
structure between 1995 and 2012. The cost growth
share of defence costs for capital increased from 18
to fund these changes is much higher in the Navy and
per cent to 23 per cent35.
Air Force.34
11Fiscal Sustainability of the National Defence Program
Figure 3-4 illustrates the significant growth in capital
expenditure that is required over the next ten years
in order to maintain the status quo force structure.
12Fiscal Sustainability of the National Defence Program
Figure 3-4 Projected defence expenditure by nor do figures on a partial accrual basis provide any
standard object of expenditure, 2015-2025 ($B indication of longer term affordability (see Box 1
2012) above).
Using fiscal year 2019-2020 as a starting point, the
last year for which the Department of Finance has
provided a planned budget allocation, PBO overlaid
three medium-term expenditure scenarios against
the forecast cost of maintaining the current force
structure:
1. Maintain defence spending at 0 per cent real
growth (that is, growth at the same level as the
forecast inflation rate). While to some this may
represent a ‘worst-case scenario’, it is consistent
Source: DAS Model Projection. CAGR = Compound Annual Growth Rate with the revised CFDS.37
2. Maintain defence spending at its average share
3.4 Forecast budget scenarios of GDP over the last 20 years. This represents a
The government does not publish future budget baseline status quo. Over the past decade,
defence spending has been maintained at 1.1 per
expenditures on an accrual basis for the defence
cent of GDP. This implies that real defence
program beyond what PBO has derived for the fiscal spending grows at the same rate as forecast real
year ended 2020. DND’s Report on Plans and GDP growth.38
Priorities (RPP) outlines the amounts, on a partial
accrual basis, that it will request from Parliament 3. Maintain defence spending at its historical real
rate of growth of 1.9 per cent per year since
over the next three years.
1995.
As discussed elsewhere36 the amounts in the RPP are
not necessarily a good indication of future spending,
13Fiscal Sustainability of the National Defence Program
Figure 3-5 Historical and forecast defence budget scenarios against force structure cost (2008-2025)
Sources: Fiscal Reference Tables, PBO, DAS Model Projections
Figure 3-5 displays the results of the model for these growth from 2015 to 2020 is held to the rate of
three scenarios. The blue solid line is the estimated inflation.
cost of maintaining the force structure and the red
line represents past spending and the planned 3.5 Model Sensitivity
defence budget until 2020. The dotted lines The model highlights the significant affordability
represent projections from the three scenarios challenges that will occur post 2015 in maintaining
described above. the capability of the 2012 force structure with
projected defence budget allocations. As such, the
The gap between the blue line and each of the three
model is sensitive to large changes in force structure.
dotted lines represents the gap between the
estimated cost of the force structure and the funding Figure 3-6 below presents the gap between the
being provided. That is, the gap indicates the estimated budget and the estimated costs of
amount the estimated funding falls short of the maintaining the force structure to levels of three
estimated amount required to maintain the 2012 alternate years: 1994, 1996 and 1997. These years
military force structure. The figures in the table are reflect – respectively – a larger force structure, a
in billions of dollars. Negative numbers reflect a gap somewhat comparable force structure, and a smaller
between budgets and estimated cost, and positive force structure than that of 2012. In 1994, for
numbers reflect a surplus of budget relative to cost. example, the regular forces numbered 75,693, which
The lowest cumulative gap is $33.0 billion, and is dropped significantly to 60,300 in 1997. The
calculated by summing the figures in the row entitled equipment and operating expense requirements for
‘Gap at Past Spend/Current Budget’ and ‘Gap at smaller armed forces is significantly less than one
growth rate since 1995’. The highest cumulative gap that is almost 15,000 members larger.
is $42.1 billion, and occurs when defence spending
14Fiscal Sustainability of the National Defence Program
When calibrating the model to the 1994 force 42.1, and for 1996 it is 10.1 and 19.1. When
structure, the model calculates a cumulative gap of calibrating to the 1997 force structure, the model
between $54.2 billion and $63.3 billion. When estimates a cumulative surplus of between $9.7
calibrating to 1995, the gap is between 33.0 and billion and $18.7 billion.39
Figure 3-6 Sensitivity of estimated force structure costs using different calibration years
Source: DAS Model Projections
Undoubtedly, maintaining a larger force structure – 10 years. Spending growth would also need to
such as that in 1994 (the green dotted line) – will increase much higher than the 0.6 per cent long-term
increase the estimated costs, just as maintaining a growth projected by DND in the Canada First Defence
smaller force structure – such as that in 1997 (the Strategy.40
solid orange line) – will decrease the estimated costs.
The purpose of these results is to provide estimates 4 Conclusions and observations
of the costs of maintaining alternate force structure As a result of the underinvestment through the
levels in the context of the estimated budget. 1990s, the model illustrates the cumulative
affordability gap that existed until the early 2000s.
Maintaining the 2012 force structure, however, is
The model shows that it was only with the significant
better aligned with the objectives in the CDFS. With
spending increases seen in the latter half of the
the drop in defence spending announced in Budget
2000s that the affordability gap was closed and
2012 and subsequent years, another period of
capability was able to be maintained and to some
underinvestment appears evident. Even if the funds
extent re-built. However, the recent cuts to the
removed in recent budgets are re-allocated to future
defence budget point to an impending affordability
years, trend spending on defence needs to grow
gap beginning in this fiscal year.
significantly from its base of 1.9 per cent in order to
match the 2.5 per cent growth in the cost of The outcomes of a fiscal gap in the defence program
maintaining the existing force structure over the next are beyond the scope of this paper41. However, if
15Fiscal Sustainability of the National Defence Program
program costs and the budget allocation are not Ultimately, it is the role of policy makers to decide on
brought to equilibrium, there will be a reduction in the future role of the defence program, the makeup
the capabilities of the current force structure. This of the force structure to support that role, and the
means a reduction in the numbers and types of budgetary allocation required to support that force
equipment and potentially a reduction in the number structure.
of personnel in the Armed Forces42. This would also
result in the government falling short of its CFDS
commitments.
14Fiscal Sustainability of the National Defence Program
Appendix A - Key Model Assumptions
Capital Expenditure includes expenditure on:
Armed forces and peacekeeping forces
Defence ministries and other government
agencies engaged in defence projects
Paramilitary forces; when judged to be trained,
equipped and available for military operations
Military space activities
Personnel Expenditures include:
Expenditures on current personnel (military and
civil)
Military personnel retirement pensions
Military personnel and their families’ social
services
Procurement Expenditures include:
Military research and development
Military construction
Military aid (reflected in expenditures of donor
country)
Excluded Military Related Expenditures:
Civil defence
Current expenditure for previous military
activities
Veterans’ benefits
Demobilization
Conversion of arms production facilities
Destruction of weapons
15Fiscal Sustainability of the National Defence Program
References bvg.gc.ca/internet/English/parl_oag_201311
_03_e_38797.html.
Bland, D. L., & MacDonald, B. (2012). Canada's Perry, D. (2014). The Growing Gap Between Defence
Defence and Security Policies after 2011: Ends and Means: The Growing Disconnect
Missions, Means and Money. In D. S. between the Canada First Defence Strategy
McDonough (Ed.), Canada's National Security and the Defence Budget (Vol. Vimy Paper).
in the Post-911 World. Strategy, Interests Ottawa: Conference of Defence Associations
and Themes (pp. 227). Toronto: University of Institute.
Toronto Press. Public Sector Accounting Standards Board. (2014).
Cohen, A. (2003). While Canada Slept. Toronto: Public Sector Accounting Standards Concepts
McClelland & Stewart. and Principles: Chartered Professional
Department of Finance. (2014). Fiscal Reference Accountants Canada.
Tables, October 2014 (pp. Table 12). Ottawa: Pugh, P. G. (2007). Source book of defence
Department of Finance, Government of equipment costs (2012 ed.). Bedfordshire: D.
Canada. G. Pugh.
Department of National Defence. (2011). Stone, J. C. (2009). Defence Budget Allocation 1950-
Recruitment and Retention in the Canadian 2007. In C. Stone (Ed.), The Public
Forces. Ottawa. Management of Defence in Canada (pp.
Douglas L. Bland (Ed.). (2004). Canada Without Appendix 2). Toronto: Breakout Educational
Armed Forces. Montreal: McGill-Queen's Network.
University Press,. The Conference of Defence Associations Institute.
Future Years Defense Program (FYDP). (2010). (2002). A Nation at Risk. Ottawa.
Retrieved November 4, 2014, from Thomson, M. (2014) The Cost of Defence, ASPI
https://dap.dau.mil/acquipedia/Pages/Articl Defence Budget Brief 2014–2015. Australia:
eDetails.aspx?aid=a2cc2ade-6336-433e- Australian Strategic Policy Institute (ASPI).
a088-42f497cdf7ef
Hood, J. (2015, January 22). Investment Planning at Treasury Board of Canada Secretariat. (2000).
National Defence. Paper presented at the Forging Stronger Links - Changing the Basis of
Financial Management Institute, Ottawa. Appropriations in the Government of
International Society of Parametric Analysts. (2008). Canada. Ottawa.
Parametric Estimating Handbook (4th Edition Treasury Board of Canada Secretariat. (2011).
ed.). Vienna VA: I.S.P.A. Treasury Board President reaffirms
National Audit Office. (2013). Ministry of Defence commitment to reduce government
Equipment Plan 2012 – 2022. London: UK spending and return to a balanced budget.
National Audit Office. United States Air Force. (2010). FY10 Force Structure
National Defence and the Canadian Armed Forces. Announcement.
(2008). Canada First Defence Strategy
Retrieved October 5, 2014, from
http://www.forces.gc.ca/assets/FORCES_Inte
rnet/docs/en/about/CFDS-SDCD-eng.pdf
National Defence and the Canadian Armed Forces.
(2014). Department of National Defence and
the Canadian Armed Forces - Report on Plans
and Priorities 2014-15. Ottawa.
Office of the Auditor General of Canada. (2008). 2008
Fall Report of the Auditor General of Canada.
Retrieved from http://www.oag-
16Fiscal Sustainability of the National Defence Program
Endnotes
not included because there was no significant information
pertaining to the defence budget.
1
National Defence and the Canadian Armed Forces (2008)
2 17
By way of example, Budget 2014 removed $3.1 billion http://www.pbo-
from the defence capital procurement budget. Only a dpb.gc.ca/files/get/infReq/132?path=%2Ffiles%2Ffiles%2F
portion of this reduction was reflected in DND’s spending Response_IR0115_FC_Defence_Expenditures_EN.pdf
plans for 2014-15 to 2016-17.
3 18
Future Years Defense Program (FYDP) (2010) Except in the event of an operating budget freeze,
4
National Audit Office (2013) departments are compensated for changes to terms and
5
Thomson (2014) conditions of employment from a central budget
6
In 1998, the Auditor General undertook assessments of allocation, TBS Vote 15. See http://www.tbs-
DND’s ability to modernize the armed forces and sct.gc.ca/ems-sgd/sups/c/20142015/atbcv-accct-eng.asp
concluded that the department did not have adequate for a description. PBO uses a projected nominal wage
funds to do so. See Office of the Auditor General of increase of 4.5% per year (http://www.pbo-
Canada (2008) dpb.gc.ca/files/get/publications/191?path=%2Ffiles%2Ffil
7
National Defence and the Canadian Armed Forces (2014) es%2FFed+Personnel+Expenses_EN.pdf), which works out
8
Bland and MacDonald (2012) to roughly 2.5% per year adjusted for inflation. The
9
National Defence and the Canadian Armed Forces (2014) adjustment for the transfer of authorities to Shared
10
United States Air Force (2010) Services Canada is $306 million per year as per the Main
11
Department of Finance (2014) Estimates, 2012-2013 (http://www.tbs-sct.gc.ca/est-
12
Department of National Defence (2011) pre/20122013/me-bpd/me-bpd-eng.pdf). PBO assumes
13
National Defence and the Canadian Armed Forces that services of a comparable value will be delivered to
(2014) DND, thereby reducing DND’s expenses by the same
14
There are three types of accrual: Full, Modified and amount.
19
Partial. The major difference between "modified" and The GDP deflator, a measure of the change in prices of
"full" accrual is that under "modified" accrual accounting, all goods and services produced (as opposed to the change
non-financial assets such as capital assets are expensed in prices of a fixed basket of goods which is the basis of
when they are acquired, whereas under "full" accrual the Consumer Price Index), is also a valid basis of analysis.
accounting, capital assets are expensed as they are The results are not materially different.
consumed (amortized/depreciated) over their useful life.
20
Public Sector Accounting Standards Board (2014)
21
"Partial" accrual accounting followed for the Estimates is Total incremental funding for these expenses amounted
somewhere between "cash" accounting and "modified" to $6 billion in constant 2012 dollars from 2001 to 2011.
accrual accounting. Under the "partial" accrual basis This amount differs from PBO’s 2008 estimate of the cost
currently followed by individual departments, some of the Afghanistan mission (http://www.pbo-
expenses are accrued, but not all; revenues are on a pure dpb.gc.ca/files/get/publications/6?path=%2Ffiles%2Ffiles
cash basis; and, non-financial assets are expensed on %2FPublications%2FAfghanistan_Fiscal_Impact_FINAL_E_
acquisition. WEB.pdf). The cost of military operations is published by
See Treasury Board of Canada Secretariat (2000) DND in its RPP. In some instances, DND is required to
15
The ‘Accrual Envelope’ is funding set aside in the Fiscal absorb some of the cost of these overseas operations in its
Framework for Defence, and provides a source of funds existing budget. These amounts were provided by DND
for capital acquisitions in the year of purchase and a through an Access to Information request A-2011-1104.
22
source of operating funds to implement CFDS and sustain Treasury Board of Canada Secretariat (2011)
22
new capital investments. Hood (2015) For more information on parametric cost estimating, see
16
The PBO has the legal right to request economic and International Society of Parametric Analysts (2008)
24
financial data from government departments. These Pugh (2007)
requests, as well as the government’s responses, are
posted on the PBO website. Budgets 2011 and 2013 were
17Fiscal Sustainability of the National Defence Program
25 41
This does not always translate into a one-for-one The CDA Institute’s Strategic Outlook 2014
replacement. This may mean, for example, fewer but (DeKerckhove, F. and G. Petrolekas (2014). THE STRATEGIC
more capable force structure units going forward. OUTLOOK FOR CANADA. Vimy Paper, Conference of
26
For example, adjustments were made to the size of Defence Associations Institute: 55-60.)provides a cogent
different major force structure elements (battalion, discussion about Canada’s security considerations. It
squadron, regiment, ship) between the UK and Canada. proposes five scenarios of future capabilities of the force
27
PBO will publish in a separate note the methodology structure concurrently with budgetary requirements.
42
and assumptions used to collect and assess the force By way of example, the model shows that the projected
structure inputs. defence budget would be more than sufficient to maintain
28
Stone (2009) a force structure that resembles the one that existed in
29
Manifested most significantly in a shortage of trained 1997. In order to maintain equilibrium, however, the
personnel, loss of airlift and surveillance capability in the existing force structure would have to be significantly
Air Force, loss of command, control and air defence reduced.
platforms in the Navy and loss of direct and indirect fire
capabilities and wheeled logistics vehicles in the Army.
Douglas L. Bland (2004)
30
A very recent example is the complete loss of at-sea
replenishment capability for the Navy.
31
The Conference of Defence Associations Institute (2002)
32
Cohen (2003)
33
National Defence and the Canadian Armed Forces
(2008)
34
It is important to remember that the Army is personnel
intensive, while the Navy and Air Force are capital
intensive. If overall capital spending is changed, the effect
is felt disproportionately on the Navy and Air Force.
35
The figures are close but not identical to the amounts
that would be found in the Public Accounts. The model is
projecting higher capital costs based on the existing force
structure inputs. The lower capital expenditure figure in
Public Accounts reflects the significant amount of lapsed
capital budget funds at DND over the past few years.
36
Perry (2014)
37
CAGR for defence spending from 2008, the starting
point of the CFDS to 2020, the last year for which we have
information for the DND budget allocation, is effectively
flat in inflation-adjusted terms.
38
PBO’s real GDP growth rate forecast for the period
2020-2025 is 1.5 per cent per year.
39
Adjusting the calibration year results in a shift of the
expenditure curve, but does not change its slope. The
slope is derived by calibrating the model using the two
years for which PBO has actual force structure data: 2012
and 1995.
40
National Defence and the Canadian Armed Forces
(2008)
18You can also read