Develop a GIS-based Megaregion Transportation Planning Model - Qisheng Pan & Bumseok Chun November 2020
←
→
Page content transcription
If your browser does not render page correctly, please read the page content below
Develop a GIS-based Megaregion
 Transportation Planning Model

 Qisheng Pan & Bumseok Chun
 November 2020

 A publication of the USDOT Tier 1 Center:
Cooperative Mobility for Competitive Megaregions
 At The University of Texas at Austin
DISCLAIMER: The contents of this report reflect the views of the authors, who are
 responsible for the facts and the accuracy of the information presented herein. This
document is disseminated in the interest of information exchange. The report is funded,
 partially or entirely, by a grant from the U.S. Department of Transportation’s University
 Transportation Centers Program. However, the U.S. Government assumes no liability
 for the contents or use thereof.
 1
Technical Report Documentation Page
 1. Report No. CM2-25 2. Government Accession 3. Recipient’s Catalog No.
 No. ORCID:
 Qisheng Pan: 0000-0002-4588-3199
 Bumseok Chun: 0000-0001-7096-4743
 4. Title and Subtitle 5. Report Date
 Develop a GIS-based Megaregion Transportation Planning November 2020
 Model 6. Performing Organization Code
 7. Author(s) 8. Performing Organization Report No.
 Qisheng Pan, Bumseok Chun CM2-25

 9. Performing Organization Name and Address 10. Work Unit No. (TRAIS)
 The University of Texas at Austin
 School of Architecture
 11. Contract or Grant No.
 310 Inner Campus Drive, B7500
 USDOT 69A3551747135
 Austin, TX 78712
 12. Sponsoring Agency Name and Address 13. Type of Report and Period Covered
 U.S. Department of Transportation Technical Report conducted May 2018-
 Federal Transit Administration November 2020
 Office of the Assistant Secretary for Research and 14. Sponsoring Agency Code
 Technology, UTC Program
 1200 New Jersey Avenue, SE
 Washington, DC 20590
 15. Supplementary Notes
 Project performed under a grant from the U.S. Department of Transportation’s University Transportation
 Center’s Program.
 16. Abstract
 Few studies have focused on the development and implementation of megaregional transportation models. It is
 a big challenge to build such kind of models because they need to ensure theoretical soundness and
 methodological validity in academic and professional studies while at the same time to meet the expectation of
 public agency on the models for reliability, efficiency, and user friendliness. This study intends to fill the gaps
 to develop a GIS-based operational model for megaregion transportation planning. It extends the spatial scale
 of a regional transportation model to megaregion, which accommodates larger areas, more passenger and
 freight trips, and more complex transportation networks. It aims to balance the priorities in both academic
 research setting and operational planning setting. It selects Texas Triangle, including Austin, Dallas, Houston,
 and San Antonio metropolitan areas, as an empirical case to demonstrate the procedure of analytical
 framework design, data inventory, model development, and model implementation. This study also estimates
 both personal access to employment opportunities and truck access to freight facilities in megaregion traffic
 analysis zone to facilitate transportation policy development in Texas Triangle.
 17. Key Words 18. Distribution Statement
 Megaregions, Transportation Planning, No restrictions.
 Analytical Model, Passenger Trip, Freight
 Trip, Accessibility, Texas Triangle.
 19. Security Classif. (of report) 20. Security Classif. (of this page) 21. No. of pages 22. Price
 Unclassified Unclassified 33
Form DOT F 1700.7 (8-72) Reproduction of completed page authorized

 2
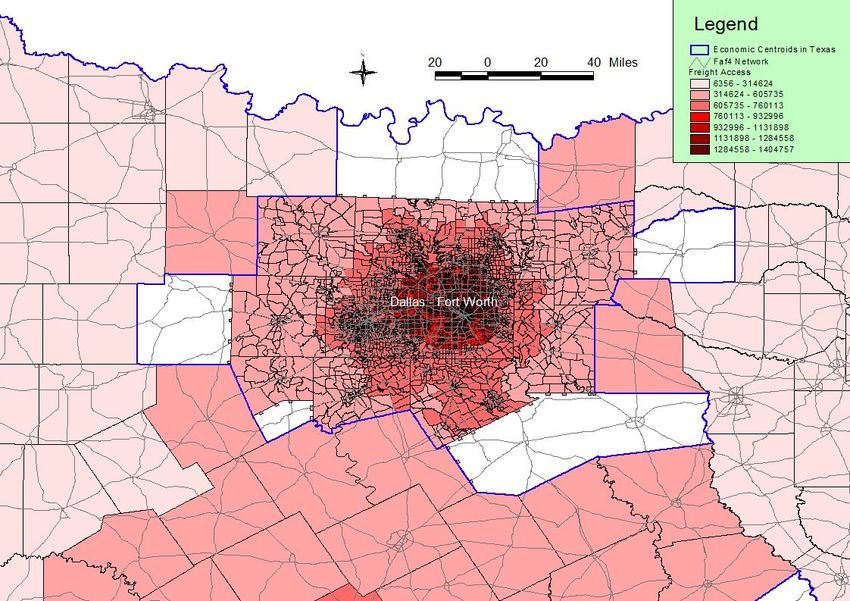
Table of Contents

Chapter 1. ........................................................................................................................................ 4
Chapter 2. Previous Studies ............................................................................................................ 8
Chapter 3. Methodology ............................................................................................................... 11
Chapter 4. Analysis ....................................................................................................................... 18
 4.1. Study Area .......................................................................................................................... 18
 4.2. Data .................................................................................................................................... 19
 4.3. Data Analysis and Modeling Results ................................................................................. 22
Chapter 5. Conclusions ................................................................................................................. 29
References ..................................................................................................................................... 31

 3
Chapter 1.
Megaregions or, as the United Nations (UN) refers to them, megacities are large clustered urban
areas with more than 10 million inhabitants. The UN reported that there were 31 megacities
globally in 2016 and this number is expected to reach 41 by 2030 (UN, 2016). In addition to the
requirement of the total population, economic production is also important for the emergence and
development of megaregions. Florida et al. (2008) argued that a megaregion must have a certain
level of economic production. The megaregion’s economic competitiveness in domestic and
international markets is a key concern given the increasing connections between the urban areas
in globalization.

In the US, a megaregion is considered a contiguous area connecting major cities. Ross (2009a)
defined it as a network of metropolitan centers and their surrounding areas that are spatially and
functionally connected through environmental, economic, and infrastructure interactions. This
definition regards metros as not only the “space of places” but also the “space of flows” such as
transportation, information, and business networks (Lang and Dhavale, 2005). The Regional Plan
Association (RPA) (2017) identified 11 megaregions in the United States that encompass more
than 70 percent of the nation’s population and jobs. Between 2015 and 2045, the US population is
projected to increase 22% to 390 million while its GDP is projected to grow by 115% to $36.7
trillion, according to “Beyond Traffic 2045”. Most of the population and GPD growth will be
concentrated in megaregions.

Transportation infrastructure is inherently a megaregion issue because it forms networks within
and among regions and municipalities (Monolith Press 2013). The unprecedented urban sprawl
made possible by the expansion of transportation infrastructure has certainly increased the size of
megaregions and captured more attention in urban planning. Planners need megaregion travel
demand models to formulate projects and programs, appraise and prioritize plans and policies, and
assess the economic and social impacts of transportation investments (NASEM 2017). However,
it has laid great challenges on understanding and modeling the performance of megaregional
transportation systems because they have shaped urban development profoundly. Existing

 4
transportation-related issues in urban areas such as congestion, urban sprawl, air pollution, public
health, and equitable accessibility may become more serious at the megaregional level than at the
local, state, or national levels. It is necessary to develop appropriate integrated urban models
(IUMs) to achieve socio-economic and environmental sustainability (Miller 2018).

As emerging economic units, megaregions open a new context for US transportation planning in
the 21st century. It is important to advance the existing infrastructures in megaregions to support
personal, local, regional, federal, and global mobility needs and address the relevant economic
competitiveness and environmental issues (Ross 2009b). However, there are some challenges to
developing models and implementing plans for megaregional transportation development. The
megaregional transportation study is a complex and largely unexplored issue partially due to the
heterogeneity of data sources and the variety of spatial and temporal definitions. For example, no
zonal system has been designated for existing megaregions. The boundaries of megaregions are
difficult to delineate because the conceptual areas are defined by connections such as interrelated
transportation, geographies, socio-economic activities, or demographic backgrounds.

In the available literature, most studies of megaregions are still limited to academic interests. To
advance the state of the practice and accelerate the pace of innovation in transportation planning,
the Transportation Research Board (TRB) Committee on Transportation Planning Applications
has held seventeen biennial conferences showcasing innovative methods since 1987. Based on the
presentations given at the first seven conferences, the committee concluded that “those methods
and procedures that have served well for the past 40 years seem increasingly unable to address the
issues of most concern to decision-makers. On the eve of the third millennium, entirely new
transportation planning methods are needed.” (Marshment 2000).

Different aspects of the transportation system in a large planning area may be controlled by
different public agencies. The Metropolitan Planning Organizations (MPOs) are responsible for
the development of a transportation improvement plan (TIP) and the maintenance of a regional
transportation plan (RTP). Many state transportation agencies also have a Statewide
Transportation Improvement Program (STIP) and a Statewide Long-Range Transportation Plan
(SLRTP). Travel forecasting models have become a necessary means of evaluating policies, plans,

 5
and projects at both regional and state levels. A study by the National Academies of Sciences,
Engineering, and Medicine (NASEM) (2017) pointed out that the distinction between regional and
state models becomes vague as their levels of resolution converge and the pressures for fine-
grained analyses are increasing.

However, few states are ready or able to model the entire state or megaregions at the urban level.
Most state transportation agencies and MPOs have failed to encourage greater cooperation among
individual MPOs (Seedah and Harrison, 2011). They lack analytical methods to estimate travel
demands and measure the performance of transportation infrastructure on moving people and
goods at the megaregion level. Zhang et al. (2007) argued that a megaregional approach can
provide provocative and imaginative answers to growing problems of congestion, development
disparity, and air pollution facing individual metropolitan areas or cities that they are unlikely to
solve individually.

To address emerging issues such as the impacts of autonomous vehicles, new high-speed rail
services, and aging infrastructures on the clustered metropolitan centers and their surrounding
areas, advanced megaregional transportation models need to be developed by integrating
individual metropolitan transportation plans and by considering the inter-metropolitan movements
of people and goods within the megaregion. However, there are few professional programs and
academic studies on megaregional transportation models. There are even fewer studies that explore
both passenger travel and freight movement at the megaregion level. NASEM (2017) claimed that
no operational megaregion model has been developed in the U.S.

IUMs offer the potential to expand the scope of spatial analysis from metropolitan to megaregional
level, evaluate transportation performance of both passenger and freight traffic in megaregions,
and support decision making and policy analysis for megaregional transportation planning. Miller
(2018) pointed out that persistent and important technological improvements in computer software
and hardware, advanced GIS techniques and large urban spatial databases, and model estimation
software have made the development and implementation of operational IUMs possible. The
significant modeling progress has also made it possible to develop and apply operational
megaregional transportation models.

 6
By recognizing the problems in existing models and the potential of IUMs, this study intends to
develop a GIS-based operational transportation model with an analytical framework for estimating
the movement of people and goods in megaregions based on the available datasets. It aims to gain
a better understating of megaregional transportation flows and facilitate the improvement of
passenger access to employment opportunities and truck access to freight facilities. It also plans to
balance the priorities of academic research and the needs of operational planning agencies to
support decision making on socio-economic and environmental issues related to megaregional
transportation. It focuses on the Texas Triangle as an empirical case to demonstrate the
implementation of the megaregional transportation model for both passenger and freight traffic.

 7
Chapter 2. Previous Studies
In the available literature on megaregional transportation planning, most studies are limited to
qualitative descriptions and case study research, which address policy issues and governance
frameworks for megaregions. Few academic studies or professional programs focus on the
development and implementation of operational megaregional transportation models. There are
even fewer studies that explore both passenger and freight movement within a megaregion.

Ross (2009a) used knowledge of current regional and statewide transportation planning structures
to conceive a framework for governing megaregional transportation planning based on a review
of the organizational structures and finance of multijurisdictional initiatives in the U.S. and around
the world. Dewar and Epstein (2007) also did pioneer work on megaregional planning by
reviewing the relevant planning work for megaregions in the U.S. through 2050. They explored
the data available for the public to analyze commute flows and truck flows, but their studies were
conceptual and descriptive without any quantitative analysis.

As a follow-up study of Ross (2009a), Read et al. (2017) reviewed local and regional long-range
plans to determine the extent of megaregional planning. They also conducted case-study research
on Cascadia and the Texas Triangle by reviewing the long-range transportation plans of their
largest Metropolitan Planning Organizations (MPOs), and the comprehensive plans of the most-
and second-most-populous cities as well as a peripheral city within the MPOs. They reported that
there remains a lack of clear guidance for the planning agencies on addressing megaregional issues
in planning practice. They also pointed out an increasing level of interregional collaboration
around large-scale issues of transportation, air and water quality, and resilience across local
jurisdictional borders. The increase of accessibility and mobility for people and freight is one of
the key planning factors of the regional long-range planning framework.

In the past decades, statewide modeling has made some important advances in expanded detail and
capacities, wider diversities of demands, more robust freight models, larger investments in data
collection, more sophisticated forecasting modeling for mode choice of high-speed rail,
incremental model enhancement for passenger travel, and the extension of modeling with GPS

 8
tracking data. However, this progress in statewide modeling has not been accompanied by similar
advances in megaregional modeling. Existing megaregion studies are either research-driven or
project-based, such as high-speed rail projects. No agency is responsible for the development of
megaregional transportation models except for some federal initiatives because megaregions have
no institutionalized governance structures in place (NASEM 2017).

Moeckel et al. (2015) concluded that little research has been conducted to model megaregions after
a review of a considerable body of literature on megaregions. In a synthesis report compiled for
the National Cooperative Highway Research Program (NCHRP), NASEM (2017) asserted that
there is no operational megaregional model in the U.S. as of 2016 except for a prototype called the
Chesapeake Bay Megaregional Model. The few published studies tend to focus on one aspect of
megaregional planning, rather than integrating transportation, land use, demographic, economic,
and environmental components.

An operation freight model developed as a collaborative effort of the Maricopa Association of
Governments (MAG), the Pima Association of Governments (PAG), the Arizona Department of
Transportation (ADOT), and the Federal Highway Administration (FHWA) stands as one of the
few megaregional transportation models. It can be integrated with regional and statewide travel
forecasting models to support decision making and transportation analysis across the Arizona Sun
Corridor megaregion, the metropolitan areas served by MAG and PAG (Maricopa Association of
Governments 2017). The model consists of several major components, including firm synthesis,
supply chain, mode choice and transport, and truck tour sub-models. The firm synthesis and the
supply chain sub-models account for an evolving market of buyers and sellers, and the mode choice
and the truck touring sub-models captured trip chaining activities of freight deliveries of differing
classes. Although this model aims to support transportation analysis at the megaregion level, it is
limited to freight movement.

Zhang et al. (2013) developed a microlevel traffic simulation for a megaregion evacuation, which
incorporates the transportation processes of the Gulf Coast region from Houston to New Orleans.
These researchers simulated a regionwide evacuation event using a traffic demand generation
process, which yields a spatial-temporal distribution of traffic flows in a hurricane threat scenario.

 9
The model focused on the traffic assignment step and only measured transportation performance
in a hurricane evacuation.

As the outcome of a case study and demonstration project funded by FHWA about assembling
analysis tools to evaluate scenarios and impacts in megaregions, the Chesapeake Bay Megaregion
(CBM) Model was developed for the megaregion around Washington, D.C. NASEM (2017)
highlighted it as a prototype of an operational megaregional transportation model in the U.S. The
CBM model fully integrates economic, land-use, transportation, and environmental modules in
two geographic layers. A megaregional layer with 2,075 zones represents more details of economic
activities, land-use changes, environmental impacts, and travel demands in MPOs, while a national
layer with 126 zones captures relevant activities and flows outside of the main study area (Moeckel
et al. 2015). The CBM model uses a vertical integration approach to enable data exchange across
the two geographic layers while a horizontal integration function facilitates the integration of
different modules within a geographic layer.

Although researchers employed the CBM model to analyze the effects of a high energy price on
the megaregion’s land use and transportation systems, they implemented it only as a prototype,
and there has been no detailed model validation outside of the state of Maryland (NASEM 2017).
Another limitation of the CBM is that the Chesapeake Bay area spans the area from the southern
border of Pennsylvania through Maryland and eastern Virginia to Norfolk and Virginia Beach,
which is only a part of the most populous Northeast megaregion of the Boston–Washington
corridor extending from the northern suburbs of Boston, Massachusetts, to the southern suburbs
of Washington, D.C., in northern Virginia. Therefore, the CBM model does not cover an entire
megaregion.

To fill a gap in the practice of modeling megaregions, this study intends to develop an operational
transportation planning model to gain a better understanding of the movement of persons and
freight within megaregions. The model relies on two geographic layers, i.e., the intra-metropolitan
and inter-metropolitan layers. It develops a series of functions to facilitate data exchange or
integration in the same geographic layer or between the two different layers on a GIS-based
platform.

 10
Chapter 3. Methodology
It is a substantial challenge to build integrated models for analyzing passenger and freight
movement in megaregions because they need to have theoretical soundness and methodological
validity in academic and professional studies while at the same time meeting the expectations of
public agencies for reliability, efficiency, and user-friendliness.

This research focuses on the development of a transportation model at the megaregion level. It
proposes an analytical framework to address this issue. This model aims to assist policymakers
and facilitate the planning process for megaregional development. It is built on the base of the
transportation module developed in the Southern California Planning Model (SCPM), which is a
regional planning model initially developed at the University of Southern California (USC) in the
early 1990s to address the problems of spatial economic impact analysis within the five counties
of the Los Angeles Metropolitan area (Richardson et al. 1993). This model has been widely applied
in Los Angeles, Houston, and other cities and regions to estimate the effects of natural or manmade
disasters and steadily updated over the years as new and revised data sources became available
(Richardson et al. 2015).

SCPM is a regional input-output model that reports results in considerable spatial detail. The first
version of SCPM (SCPM1) employed an origin-destination (OD) matrix to trace all economic
impacts, including those of intra- and interregional shipments, usually at a certain level of sectoral
and geographical disaggregation. It did not include transportation network and travel demand
modeling. The second version (SCPM2) endogenizes traffic flows including freight deliveries and,
therefore, indirect interindustry effects by including an explicit representation of the transportation
network. It incorporates a transportation network model with gravity models to allocate indirect
and induced impacts generated by the input-output model to the traffic analysis zones (TAZs). The
latest version (SCPM3) adds time-of-day functions to the capabilities of SCPM to model AM peak,
PM peak, and off-peak traffic. It facilitates an understanding of the effects of peak-load pricing on
a complex land use-transportation system, including impacts on transportation network
performance at the link level and activity effects at the TAZ level.

 11
To extend the SCPM transportation module from the regional level to a megaregion, it is important
to incorporate passenger and freight trips between metropolitan areas into the modeling process.
Similar to the framework of intraregional and interregional data processing in Pan (2006) and
Giuliano et al. (2010) as well as the two-layer structure of the Chesapeake Bay Megaregion Model
described by Moeckel et al. (2015), this study has adopted a framework of two geographic layers
to examine intra-metropolitan and inter-metropolitan transportation flows.

In comparison to passenger flows, freight movement is a much more complex and largely
unexplored issue mainly because of the costs of data collection, the heterogeneity of data sources,
the ambiguity of classifications, and the lack of adequate methodologies (Pan 2006). Giuliano et
al. (2010) employed reliable secondary data sources, including small-area employment data, and
derived estimates of commodity flows when vehicle (trip)-based freight data were not available.
However, truck movement data including OD trip matrices have become available in the past
decade at more and more local, state, and federal transportation agencies.

This study develops an analytical framework for a megaregional transportation model, which
involves four major research steps: (1) Megaregion transportation data processing, including (a)
intra-metropolitan and (b) inter-metropolitan transportation data processing; (2) Transportation
data tool functions; (3) Megaregion transportation data integration, including the combination of
intra-metropolitan and inter-metropolitan passenger trips and the combination of intra-
metropolitan and inter-metropolitan freight trips; and (4) Megaregion network modeling.

As the analytical framework in Figure 1 illustrates, the model separates megaregional
transportation into two geographic layers, i.e., intra-metropolitan and inter-metropolitan parts for
both passenger and freight trips. Intra-metropolitan transportation represents passenger and freight
flows among traffic analysis zones (TAZs) within each metropolitan area of a megaregion, and
inter-metropolitan transportation represents passenger and freight movements that do not begin
and end within the same metropolitan area of a megaregion.

 12
The local MPOs within a megaregion are expected to provide intra-metropolitan transportation
data for their metropolitan planning areas, including passenger and freight trip ODs, traffic analysis
zones (TAZs), and network link files, etc.

Inter-metropolitan transportation includes passenger and freight movement between two different
metropolitan areas of a megaregion, trips originating in or destined for areas outside of the
metropolitan areas within the megaregion, or trips to areas outside of the megaregion. Usually, the
state or federal transportation agencies have inter-metropolitan transportation data available. For
example, the Bureau of Transportation Statistics (BTS) and the Federal Highway Administration
(FHWA) have incorporated data from Commodity Flow Surveys (CFSs), the US Census Bureau’s
international trade data, and a variety of data sources to develop a Freight Analysis Framework
(FAF) to describe freight movement among states and major metropolitan areas by all modes of
transportation. 1 The US Census Bureau also provides data about commuting trips between workers’
residence location and workplace at the county level through its American Community Survey
(ACS). 2

FAF data for freight shipments are available in tonnage, value, and ton-miles by origin and
destination, commodity type, and mode. However, data conversion is necessary, for example, from
tons to dollars to jobs to trucks to passenger-car-equivalents (PCEs). This study develops the
necessary tool functions for data unit transformations.

1
 https://ops.fhwa.dot.gov/freight/freight_analysis/faf/
2
 https://www.census.gov/topics/employment/commuting/guidance/flows.html

 13
(1a) Intra-Metropolitan Transportation Data Processing (1b) Inter-Metropolitan Transportation Data Processing (2) Transportation
 Data Tool Functions

 Passenger Trip ODs Freight Trip ODs Freight Trip Data Passenger Trip Data

 Freight Analysis US Census ACS CFS 2017
 ODs by trip purpose, ODs by truck type,
 tollway or freeway, Framework (FAF) county to county
 occupancy,
 or time-of-day, or time-of-day, commodity flows commuting flows
 … … ($, tons)
 Create $/ton
 ratios for each
 mode

 Validate and aggregate Validate and aggregate Develop inter-metropolitan Develop inter-metropolitan
 ODs to a single/integrated ODs to a single/integrated freight trip ODs passenger trip ODs Source for
 passenger trip OD within freight trip OD within unit
 each metropolitan area each metropolitan area transformations

 (3) Megaregion Transportation (4) Megaregion Network Modeling
 Data Integration on GIS
 Platform. Megaregion highway
 network
 Combine intra-metropolitan and inter-
 metropolitan freight trip ODs for megaregion

 Equilibrium
 Combine intra-metropolitan and inter-metropolitan flows including
 Network Analysis
 passenger trip ODs for megaregion passenger and freight
 trips on highways

 Figure 1. An analytical framework for a megaregional transportation model

The framework also shows that the intra-metropolitan and inter-metropolitan transportation data
will be incorporated into the megaregional transportation system on a GIS-based platform. GIS
functions combine the TAZs in metropolitan areas and the zones outside of metropolitan areas into
megaregion analysis zones (MAZs). The megaregional transportation system has passenger and
freight trips originating in or destined for the MAZs that move through megaregional
transportation networks.

The megaregional network models described in the framework load megaregional passenger and
freight trip ODs onto megaregional highway networks through network assignment functions. The
passenger and freight trips are assigned together in an equilibrium-based model by considering the
network overloading condition, which is presented as follows,

 14
xa
 Min ∑ ∫Ca
 a ( x)dx (3.1)
 0

 subject to x a = ∑∑∑ δ
 o d p
 od
 a, p h pod ∀a (3.2)

 ∑ ℎ = ∀o, d (3.3)

 ℎ = + ∀o, d (3.4)

 ℎ , , ≥ 0 ∀p, o, d (3.5)

 where xa is the total flow on link a,

 C a (t ) is the cost-flow function to calculate average travel cost on link a,

 δ a,odp is the link-path incidence variable; equal to one if link a belongs to path p connecting

 OD pair o and d,

 h pod is the flow on path p connecting OD pair o and d, including both passenger flow and

 freight flow ,

 Tod is total trips between origin node o and destination node d, including both passenger and

 freight trips,

 p is a network path, and o and d are two end nodes on the network.

This assignment model for both passenger and freight flows adopts the equations described by
Sheffi (1985) that Beckman et al. (1956) used to formulate a mathematical model for Wardrop’s
first principle of route choice (“user equilibrium”). The objective function (3.1) aims to minimize
the overall travel costs of transportation networks, which are constrained by link flows and zonal
demands. Giuliano et al. (2010) employed this model to load freight traffic onto regional highway

 15
networks and Pan (2003) and Pan (2006) utilized it to assign both passenger and freight trips in
regional transportation models.

The implementation of the model requires the solution of all feasible values to be generated in
iterations. The total travel costs of the network are minimized to satisfy the objective function (3.1)
when the model reaches convergence. The procedure can be described as follows,

 Step 0: Initialization. Perform an all-or-nothing approach for assigning both passenger and

 freight trips simultaneously using free-flow travel costs C a = C a (0) , for each link a

 on the empty network. Link flows x a are obtained.

 Step 1: Update link travel times. The travel time on link a is updated as C a = C a ( xa ) .

 Step 2: Find a feasible descent direction. Use the updated travel time { C a } for an all-or-

 nothing assignment for passenger and freight trips, which yields a set of auxiliary link

 flows { u a } combining passenger trips with freight trips in PCEs.

 Step 3: Find the optimal parameter. A linear approximation algorithm (LPA) such as the

 Golden section or Bisection method described in Sheffi (1985) is applied to obtain

 optimal parameter α satisfying the following equation:
 xa +α ( u a − xa )
 Min ∑a
 ∫C a ( x)dx
 0

 Step 4: Update link flows. Link flows x a are changed to be x a +α (u a − x a )

 Step 5: Test Convergence. The process stops when a convergence criterion is satisfied and

 link flows are the optimal link flows at the equilibrium condition. Otherwise, go back

 to Step 1 and continue the process.

 16
Pan (2003) and Pan (2006) adopted this approach to load both passenger and freight flows onto a congested regional highway network under a user equilibrium condition. A similar procedure can also be utilized to load both passenger and freight trips onto megaregional highway networks with congestion. 17
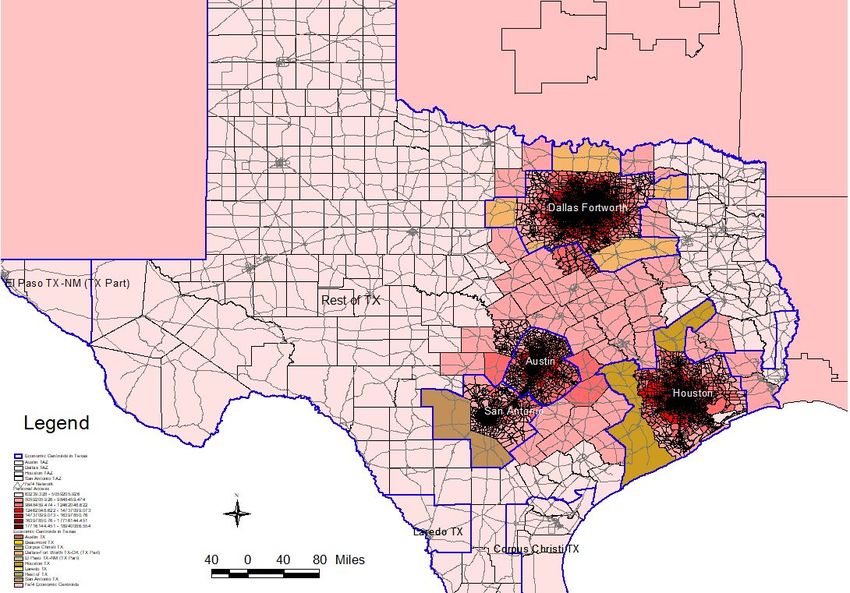
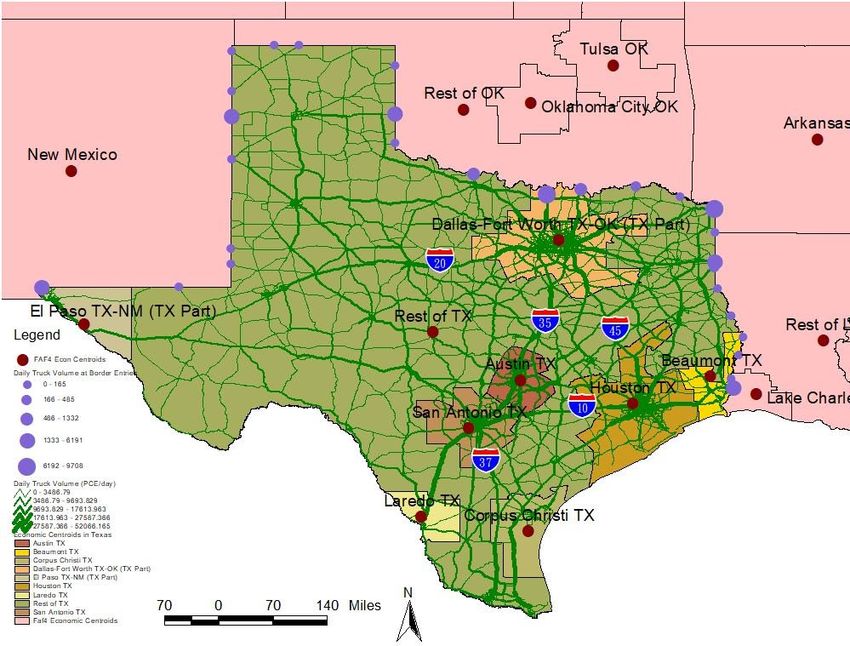
Chapter 4. Analysis
4.1. Study Area
The megaregional transportation model described by the analytical framework in Figure 1 will
analyze passenger and freight flows in the Texas Triangle, which contains the state’s four largest
metropolitan areas, i.e., Austin, Dallas-Fort Worth, Houston, and San Antonio, connected by major
interstate highways, including I-10, I-45, and I-35. The total population of the four metropolitan
areas within the Texas Triangle was 16.2 million in 2010, which increased 19.7% to a total of 19.4
million in 2019 3 making it one of the fastest-growing megaregions in the U.S.

The boundaries of the four large metropolitan areas in the Texas Triangle are different from those
of the Freight Analysis Framework, version 4 (FAF4) zones defined in the Commodity Flow
Survey (CFS). Figure 2 shows that the areas of the FAF4 zones are larger than the traffic analysis
zones (TAZs) of the metropolitan areas determined by their local MPOs. It also illustrates the
coverage of the Texas Triangle based on the passenger job accessibility calculated in this study.

Figure 2. The study area – the Texas Triangle with its megaregion analysis zones (MAZs).

3
 Author calculation using the US Census Bureau’s data for Metropolitan and Micropolitan Statistical Areas
Population Totals and Components of Change: 2010-2019, https://www.census.gov/newsroom/press-kits/2020/pop-
estimates-county-metro.html

 18
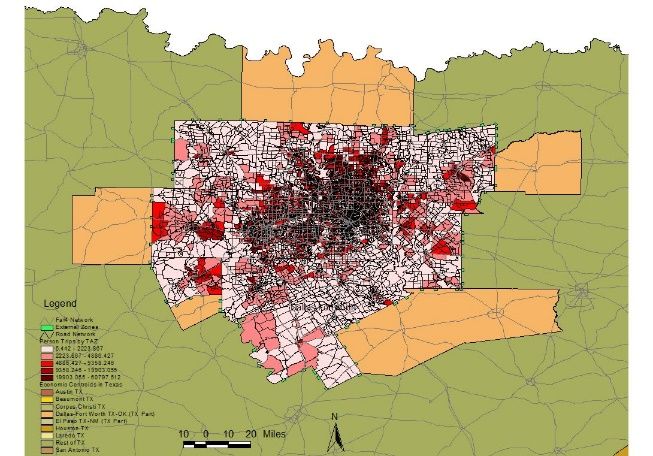
4.2. Data
Researchers obtained data from a variety of agencies at two geographic levels: the intra-
metropolitan level and the inter-metropolitan level. One of the most important sources of
metropolitan-level data was the metropolitan planning organizations (MPOs). As federally
mandated and funded organizations, the MPOs are required to develop transportation plans and
policies for the country in their areas with a population of 50,000 or more, including a long-term
transportation plan, i.e., Regional Transportation Plan (RTP), and a four-year plan called the
Transportation Improvement Program (TIP). Our traffic analysis zones, origin-destination matrix,
and transportation network data of metropolitan areas were obtained from local MPOs.

The Austin MPO, or the Capital Area Metropolitan Planning Organization (CAMPO), is
responsible for transportation planning for Bastrop, Burnet, Caldwell, Hays, Travis, and
Williamson counties. CAMPO provided transportation modeling data in 2018 that it had developed
for its 2040 regional transportation plan, including passenger and freight trip ODs for 2,102
internal TAZs plus 59 external zones, a master road network with 17,169 links and 6,533 miles,
396 existing and planned transit routes, etc. A total of 11,678,748 daily passenger vehicle trips and
1,031,178 freight truck trips were generated in the metropolitan areas, of which 320,610 passenger
vehicle trips and 51,333 freight truck trips were external trips with one end out of the CAMPO
region (Table 1). The passenger trip tables were available for different trip purposes, occupancy,
and time-of-day. The TAZ system completely covers the six-county CAMPO region, which is
consistent with the FAF4 zone designated for the Austin metropolitan area (Figure 3a).

The Transportation Department at the North Central Texas Council of Governments (NCTCOG)
serves as the MPO for the Dallas-Fort Worth region. It provided transportation data for Collin,
Dallas, Denton, Ellis, Hill, Hood, Hunt, Johnson, Kaufman, Parker, Rockwall, Tarrant, and Wise
counties. The NCTCOG data include passenger and freight trip ODs for 5,386 TAZs, including
5,303 internal TAZs and 83 external zones, and a road network with 41,454 links in 19,404 miles.
The passenger trip tables were categorized by time-of-day and occupancy, and the freight trip
tables were also available for different times-of-day. There were a total of 19,843,163 passenger
trips and 758,006 freight trips generated in the NCTCOG area per day, including 331,914 external

 19
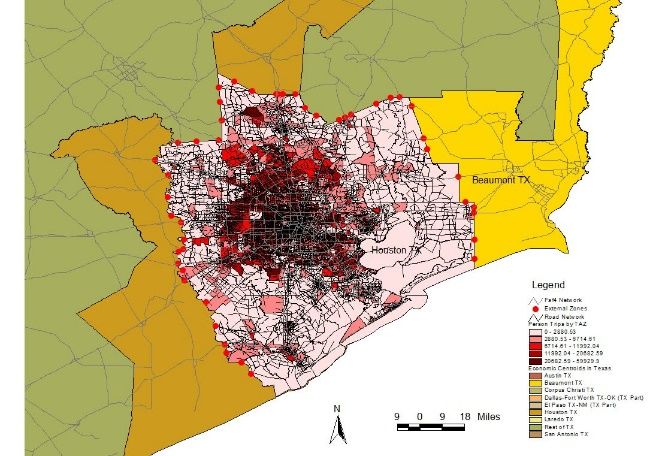
passenger trips and 95,528 external freight trips (Table 1). The NCTCOG’s TAZs cover an area
smaller than the FAF4 zone designated for the Dallas metropolitan area, which includes seven
more counties, i.e., Cooke, Henderson, Hopkins, Grayson, Palo Pinto, Navarro, Somervell (Figure
3b).

The Houston-Galveston Area Council (H-GAC) cooperates with local governments in the Houston
metropolitan area to address regional planning issues. Its transportation plans cover an eight-
county area, including Brazoria, Chambers, Fort Bend, Galveston, Harris, Liberty, Montgomery,
and Waller counties. -H-GAC provided passenger and freight trip ODs for 2,954 internal TAZs
and 46 external zones, and a road network with 68,314 links and 30,167 miles. The passenger trip
tables were available for different trip purposes. A total of 15,726,515 passenger trips and
1,154,140 freight trips were generated every day in the H-GAC region, including 181,121
passenger trips and 31,924 freight trips entering or leaving the region through its external zones
(Table 1). The FAF4 zone designated for Houston metropolitan area includes Austin, Matagorda,
Walker, Washington, and Wharton counties in addition to the eight-county H-GAC region (Figure
3c).

 a. Austin b. Dallas-Fort Worth

 20
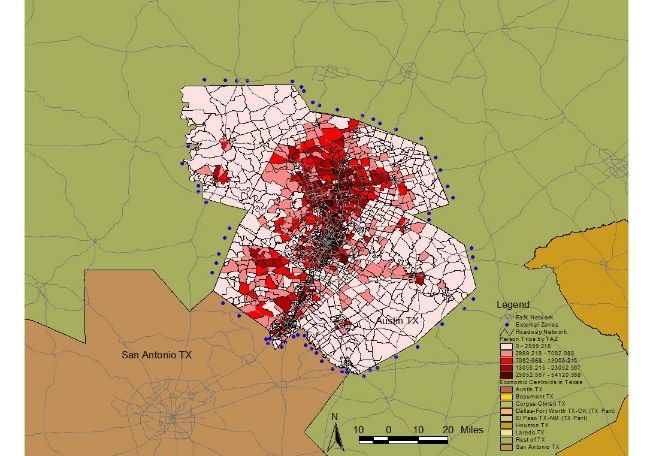
c. Houston d. San Antonio

Figure 3. Transportation data collected for Austin, Dallas-Fort Worth, Houston, and San Antonio

The Alamo Area Metropolitan Planning Organization (AAMPO) develops transportation plans
and programs to address the needs of the greater San Antonio area, including Bexar, Comal,
Kendall, Guadalupe, and Wilson counties, which is smaller than the FAF4 zone designated for the
San Antonio metropolitan area. Atascosa, Bandera, and Medina County are a part of the FAF4
zone but are not included in the AAMPO transportation region (Figure 3d). AAMPO provided the
passenger and freight trip ODs for 1,248 internal zones and 42 external zones, and a road network
with 16,140 links and 6,256 miles. There were a total of 6,610,887 passenger trips and 621,961
freight trips, and 175,658 passenger trips and 31,509 freight trips were external trips (Table 1).

Table 1. Passenger and freight trips in the four metropolitan areas of the Texas Triangle

 Passenger Trips Freight Trips
 Metropolitan Intra- External Total Intra- External Total
 area metropolitan metropolitan
 Austin 11,358,138 320,610 11,678,748 979,844 51,333 1,031,178
 Dallas-Fort
 Worth 19,511,249 331,914 19,843,163 662,478 95,528 758,006
 Houston 15,545,394 181,121 15,726,515 1,122,215 31,924 1,154,140
 San Antonio 6,435,229 175,658 6,610,887 590,453 31,509 621,961
Source: Author calculation based on data from local MPOs.

In addition to the transportation data at the metropolitan level, the project also obtained data for
the inter-metropolitan level from federal agencies, including the passenger commuting data from

 21
the US Census Bureau and freight transportation data from FAF4. The US Census Bureau’s 2011-
2015 5-Year ACS Commuting Flows data provided the commuting trips from workers’ residence
county to workplace county. The FAF4 provided commodity flow OD matrices in tonnage and
dollar value for 132 pre-defined domestic regions, which are called economic centroids. Nine
FAF4 economic centroids are located in Texas, including Austin, San Antonio, Dallas-Fort Worth,
Houston, Laredo, Beaumont, Corpus Christi, El Paso, and the rest of Texas. Four of these nine
economic centroids—Austin, Dallas-Fort Worth, Houston, and San Antonio—are located within
the Texas Triangle. The Census ACS commuting flow data and the FAF4 commodity flow data
fill the gaps in the passenger and freight trips that have at least one end outside of the four
metropolitan areas of the megaregion.

A benefit of this research is that the heterogeneous transportation data we collect from a variety of
sources were in similar formats and from almost the same base-year, i.e., H-GAC provided data
from its 2015 base year model, and the US Census commuting tables were 5-Year ACS commuting
flows from 2011 to 2015.

4.3. Data Analysis and Modeling Results
After data collection, the study followed the analytical framework in Figure 1 to process the intra-
megaregion and inter-megaregion data for passenger and freight flows. The first step was to
validate the data by comparing the passenger trips with population and employment at the TAZ or
county level, checking the calculated freight ratios in the total vehicle fleet, and comparing freight
trip data obtained from local MPOs and FAF4, etc. Researchers also examined passenger and
freight trip densities and checked whether their distribution patterns matched the urban forms. The
dollar value or tonnage of commodity flows for inter-metropolitan freight movement was
converted to the number of trucks and further to PCEs by adopting the ratios estimated from the
transportation data tool functions.

In addition to data validation, researchers aggregated the passenger trip ODs by trip purpose,
occupancy, or time-of-day to a daily passenger trip OD for each of the four metropolitan areas,
i.e., Austin, Dallas-Fort Worth, Houston, and San Antonio. Similarly, they also combined the

 22
freight trip ODs categorized by truck type, highway type, or time-of-day into a daily freight trip
OD for each of the four metropolitan areas.

As for the inter-metropolitan transportation data, passenger commuting data at the county level
and freight truck flow data in the FAF4 zonal system were not compatible in geographic locations.
Researchers developed a zonal system for the megaregion on a GIS platform, including the intra-
metropolitan zonal systems adopted from MPOs, the counties outside of metropolitan areas but
within the state, and the external zones out of the state. It has a total of 12,436 MAZs for the Texas
Triangle, as listed in Table 2.

Table 2. The transportation megaregional analysis zones (MAZs) for the Texas Triangle

 Name TAZs Internal External Descriptions
 Zones Zones
 Ext-Tex 391 N/A N/A External zones
 located out of
 Texas
 Austin 2,161 2,102 59 TAZs in Austin
 Dallas 5,386 5,303 83 TAZs in Dallas
 Houston 3,000 2,954 46 TAZs in Houston
 San Antonio 1,290 1,248 42 TAZs in San
 Antonio
 TexCounty- 208 N/A N/A Texas counties out
 OutMetro of the four
 metropolitan areas
 defined by FAF4
 Total 12,436 N/A N/A Total number of
 zones for the
 megaregion
Source: Author preparation based on data from local MPOs and FAF4.

The megaregion zonal system for the Texas Triangle includes 391 external stations located outside
of the state of Texas, which are identified through the FAF4 zonal system, the border entries, and
other geographic information. It also incorporates the internal and external zones of the four
metropolitan areas in the megaregion, which are exactly the same TAZ systems defined by their
respective MPOs. It also includes the counties located outside of the four metropolitan areas but
within the boundaries defined by FAF4. The design principle of the megaregion zonal system is

 23
similar to the development of the TAZ system in regional transportation analysis or the census
tract in socio-demographic analysis. The higher the population density, the smaller the size of the
zones. There are a large number of intra-metropolitan transportation zones that usually have a
smaller size and a much smaller number of inter-metropolitan transportation zones that have a
much larger size due to differences in density. Figure 2 shows the megaregion zonal system, and
Figure 3 illustrates the internal and external zones for each metropolitan area in the megaregion.

Following the analytical framework in Figure 1, the intra-metropolitan passenger trip tables for
the four metropolitan areas in the Texas Triangle are combined with inter-metropolitan passenger
trip ODs to build a megaregion passenger trip OD. Similarly, the intra-metropolitan freight trip
tables for the metropolitan areas in the Texas Triangle are also incorporated with inter-
metropolitan freight trip tables to create a megaregion freight trip OD.

To facilitate network analysis of megaregion passenger and freight movement, researchers adopted
the transportation network from FAF4, which has 39,160 network links in Texas. Based on an
assumption that all the network links have two ways or two directions, the number of network
links based on the FAF4 data set becomes 78,320. Researchers also added two-way centroid
connectors to each of the 12,436 network centroids. The total number of network links for the
megaregion transportation system is 103,192 by incorporating 24,872 centroid connectors and
78,320 FAF4 network links.

In this study, the 103,192 highway network links were reorganized in the forward star data
structure described by Sheffi (1985) to save space in computer memory and facilitate the
management of the sequence list of links. In addition to from-node, to-node, length, and lanes, the
network link attributes also include link capacity, speed, and link type attributes. The link capacity
is obtained from the FAF4 data set, which estimates capacity using the methodology in the
Highway Capacity Manual (HCM). The speed of a link is estimated based on the type of the link.

Once the megaregion passenger and freight trip ODs were prepared and the network links were
developed, researchers adopted the user-equilibrium-based model with capacity constraints and
the iterative procedure described in the methodology section to load both passenger and freight

 24
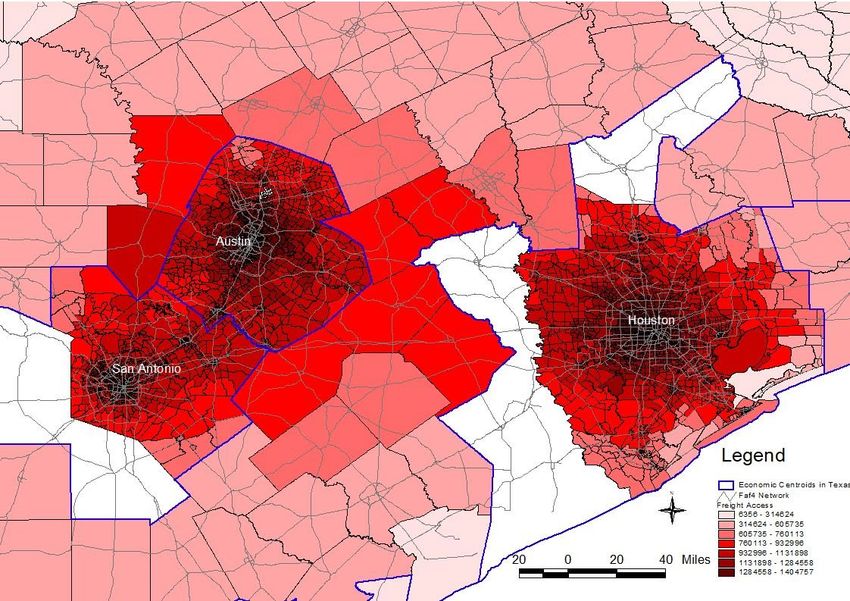
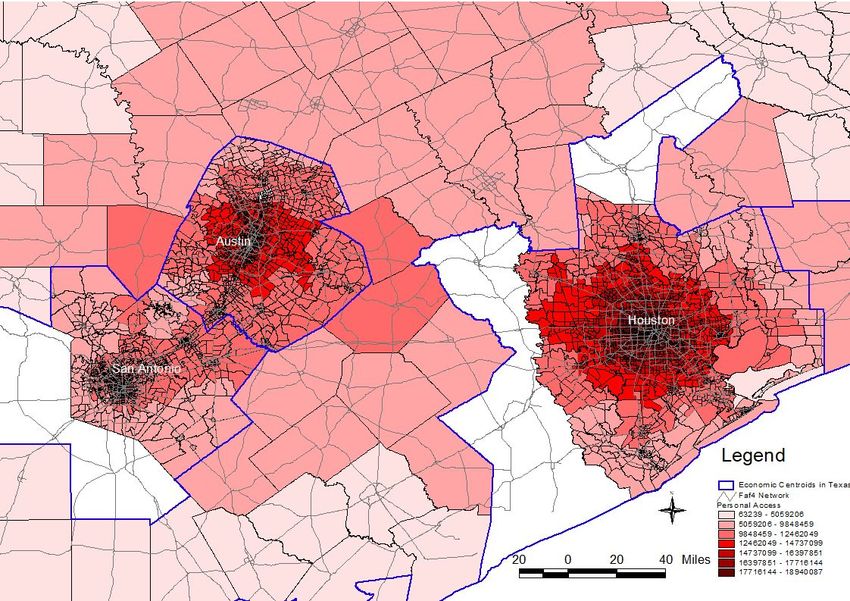
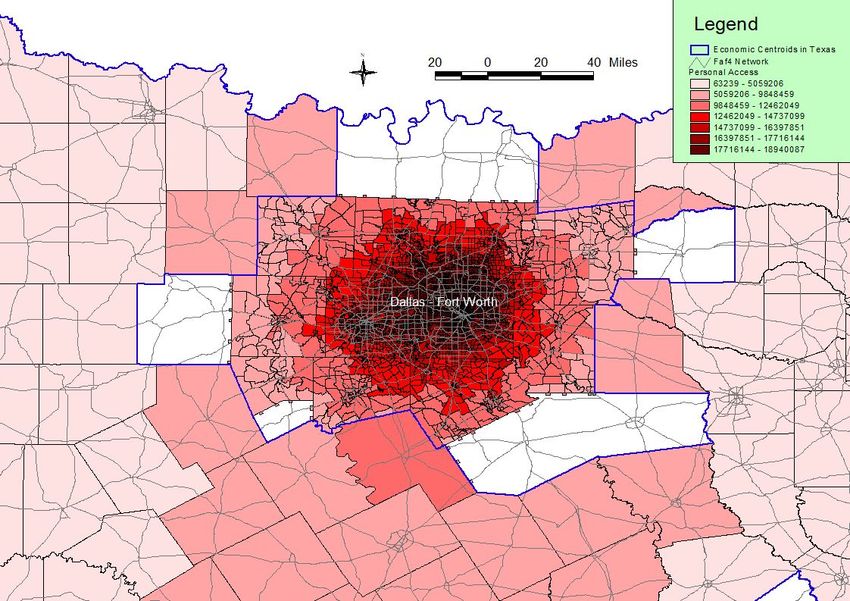
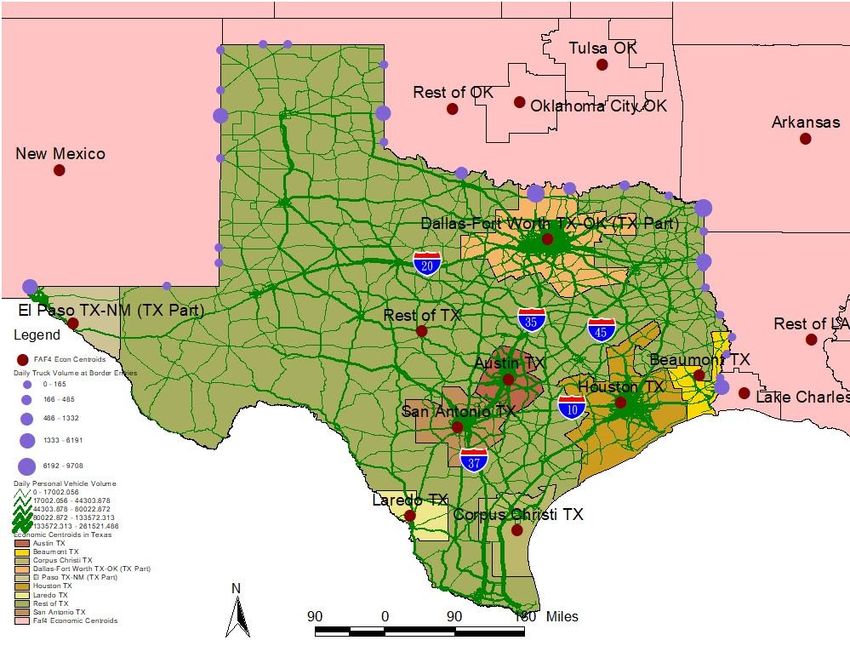
flows into the megaregional transportation network. The model has run multiple iterations (more
than 10 in this study) to reach convergence in 6 iterations (Figure 4).

 Objective Function Value- Iteration
 1,200,000

 1,000,000
 Objective Function Values
 (Million Min*PCEs)

 800,000

 600,000

 400,000

 200,000

 0
 1 2 3 4 5 6 7 8 9 10
 Iterations

 Figure 4. Objective function values vs. iterations using user-equilibrium assignment.

To be compatible with passenger trips, the freight trips are measured in PCE, which was converted
from freight tonnage in the FAF4 database using the ton-per-PCE ratio estimated by Giuliano et
al. (2010). Figure 5a and Figure 5b show the link volumes estimated by the user equilibrium
assignment with link capacity constraints for passenger flows and freight flows, respectively.

Figure 5a and Figure 5b clearly show that passenger and freight flows have similar distributions
in the Texas Triangle. The intra-metropolitan trips have much higher volumes than the inter-
metropolitan trips. The inter-metropolitan trips have high volumes on the major highways, such as
I-20, I-35, I-45, I-10, and I-37, etc. Fewer trips cross the state’s borders than cross the boundaries
of metropolitan areas in the Texas Triangle.

To facilitate transportation policy-making, researchers also estimated passenger accessibility to
employment opportunities and freight accessibility in the northern and southern parts of the
megaregion, which are shown in Figures 6a, 6b, 6c, and 6d. Due to the discrepancies between the

 25
metropolitan boundaries defined by FAF4 and those defined by local MPOs, accessibility has not
been calculated for a few counties outside of the boundaries of MPOs for transportation planning
but within FAF4 zones designated for the four major metropolitan areas.

 Figure 5a. Passenger Flows in the Texas Triangle.

 26
Figure 5b. Freight Flows in the Texas Triangle.

The figures illustrate that the Texas Triangle, including the four major metropolitan areas and the
clustered counties between them, has higher passenger accessibility and freight accessibility than
do the other parts of the state. It is also interesting to observe different patterns of passenger and
freight accessibility in the northern and southern parts of the Texas Triangle. Freight accessibility
is more concentrated than passenger accessibility in the central part of the Dallas-Fort Worth
metropolitan area while passenger accessibility is more concentrated than freight accessibility in
the core of the Austin, Houston, and San Antonio metropolitan areas.

 27
Figure 6a. Passenger accessibility in the Figure 6b. Freight accessibility in the northern
northern part of the Texas Triangle. part of the Texas Triangle.

Figure 6c. Passenger accessibility in the southern Figure 6d. Freight accessibility in the southern part
part of the Texas Triangle. of the Texas Triangle.

 28
Chapter 5. Conclusions
Few studies have focused on the development and implementation of megaregional transportation
models. It is a substantial challenge to build such models because they need to have both theoretical
soundness and methodological validity in academic and professional studies, while at the same
time they must meet the expectations of public agencies in terms of reliability, efficiency, and
user-friendliness. NASEM (2017) highlighted that there is no operational megaregional model in
the U.S. except for a prototype model developed for a part of a megaregion.

This study fills the gap by developing an operational model on a GIS platform for megaregional
transportation planning. It extends the spatial scale of a regional transportation model to the
megaregion, which accommodates larger areas, more passenger and freight trips, and more
complex transportation networks. It illustrates the development of a megaregional transportation
model in an analytical framework with four steps: megaregional transportation data processing,
transportation data tool functions, megaregional transportation data integration, and megaregional
network modeling. The Texas Triangle serves as an empirical case to demonstrate the procedures
of framework design, data inventory, model development, and model implementation.

One of the outcomes of this study is that this model bridges the separation of passenger and freight
movement in a megaregional transportation network. It provides an integrated framework and a
design for megaregional analysis zones (MAZs) that breaks the spatial barriers between
transportation planners and decision-makers in transportation planning agencies at the federal,
state, and local levels and allows them to work together to coordinate projects and policies in
megaregions.

This model also provides a base for the development of advanced application scenarios. This
capability allows decision-makers and planners to gain a better understanding of the potential
impacts of policies, plans, and events in megaregion. For example, it has provided insights into
passenger and freight accessibility in megaregions. It is capable of estimating the economic and
transportation impacts of high-speed rail connecting Dallas-Fort Worth and Houston. It also

 29
enables planners to study the effects of autonomous vehicles in megaregional transportation
systems.

 30
References
Beckman, M., C. B. McGuire, and C. B. Winsten (1956) Studies in the Economics of
 Transportation. New Haven, Connecticut: Yale University Press.
Dewar, M., and D. Epstein (2007) “Planning for ‘Megaregions’ in the United States.” Journal of
 Planning Literature, 22, pp. 108–124.
Florida, R., T. Gulden, and C. Mellander (2008) The rise of the mega-region, Cambridge Journal
 of Regions, Economy and Society 1(3), 459–476.
Giuliano, G., P. Gordon, Q. Pan, J. Park, and L. Wang (2010) “Estimating Freight Flows for
 Metropolitan Area Highway Networks Using Secondary Data Sources,” Networks and
 Spatial Economics 10(1), 73–91.
Lang, R. E. and D. Dhavale (2005) “Beyond Megalopolis: Exploring America’s New
 ‘Megapolitan’ Geography,” Metropolitan Institute Census Report Series: Census Report
 05:01. Metropolitan Institute at Virginia Institute of Technology, available at
 https://digitalscholarship.unlv.edu/brookings_pubs/38/
Maricopa Association of Governments (2017) Mega-Regional Multi-Modal Agent-Based
 Behavioral Freight Model: MAG Next Generation Freight Demand Model (Final Report).
 Phoenix, AZ.
Marshment, R. (2000) Transportation Planning Challenges and Opportunities, A1C07: Committee
 on Transportation Planning Applications. Washington DC.
Moeckel, R., S. Mishra, F. Ducca, and T. Weidner (2015) “Modeling Complex Megaregion
 Systems: Horizontal and Vertical Integration for a Megaregion Model,” International
 Journal of Transportation 3(1), 69–90.
Miller, E. J. (2018) “Integrated urban modeling: Past, present, and future,” Journal of Transport
 and Land Use (11)1, 387–399.
Moeckel, R., S. Mishra, F. Ducca, and T. Weidner (2015) “Modeling Complex Megaregion
 Systems: Horizontal and Vertical Integration for a Megaregion Model,” International
 Journal of Transportation 3(1), 69–90.
Monolith Press (2013) Megaregions: transportation planning in the U.S., U.N. Agenda 21/Future
 Earth Series.

 31
National Academies of Sciences, Engineering, and Medicine (NASEM) (2017) Statewide and
 Megaregional Travel Forecasting Models: Freight and Passenger. Washington, DC: The
 National Academies Press.
Pan, Q. (2003) Non-Survey Regional Freight Modeling System, Ph.D. Thesis, University of
 Southern California, Los Angeles, USA.
Pan. Q. (2006) “Freight Data Assembling and Modeling: Methodologies and Practice,” Journal
 of Transportation Planning and Technology 29(1), 43-74.
Read, A. D. Morley, C. Ross, and S. Smith (2017) Multimodal Planning at the Megaregional Scale,
 FHWA-HEP-17-091 Final Report, Federal Highway Administration, United States
 Department of Transportation, Washington DC.
Regional Plan Association (RPA) (2017) America 2050. Last access on March 19, 2017, at
 http://www.america2050.org/texas_triangle.html.
Richardson, H.W., P. Gordon, M. J. Jun, and M.H. Kim (1993) “Pride and prejudice: the economic
 and racial impacts of growth control in Pasadena,” Environmental Planning A, 25(7), 987–
 1002.
Richardson, H. W., Q. Pan, J. Park, and J. E. Moore (2015) Regional Economic Impacts of
 Terrorist Attacks, Natural Disasters and Metropolitan Policies, Advances in Spatial
 Science Series, Springer. http://www.springer.com/us/book/9783319143217
Ross, C. (2009a) Megaregions: Literature Review of Organizational Structures and Finance of
 Multi-jurisdictional Initiatives and the Implications for Megaregion Transportation
 Planning in the U.S., Research report submitted to Federal Highway Administration,
 United States Department of Transportation, Washington, DC.
Ross, C. (2009b) Megaregions: Planning for Global Competitiveness, 6th Edition, Island Press.
 Washington DC.
Seedah, D. and R. Harrison (2011) Megaregion Freight Movements: A Case Study of the Texas
 Triangle, Research Report SWUTC/11/476660-00075-1, Southwest Region University
 Transportation Center, Center for Transportation Research, University of Texas at
 Austin, Austin, Texas.
Sheffi, Y. (1985). Urban Transportation Networks, Prentice-Hall, NJ.

Zhang, M., F. Steiner, and K. Butler (2007) “Connecting the Texas Triangle: Economic
 Integration and Transportation Coordination.” In The Healdsburg Research Seminar on

 32
Megaregions, 21-36. Healdsburg, California: Regional Plan Association & Lincoln
 Institute of Land Policy.
Zhang, Z., K. Spansel, and B. Wolshon (2013) “Megaregion Network Simulation for Evacuation
 Analysis,” Transportation Research Record: Journal of the Transportation Research Board,
 No. 2397, 161–170. http://dx.doi.org/10.3141/2397-19.
United Nations (UN) (2016) The World’s Cities in 2016, Data Booklet.
 http://www.un.org/en/development/desa/population/publications/pdf/urbanization/the_wo
 rlds_cities_in_2016_data_booklet.pdf

 33
You can also read