Cost of Dietary Data Acquisition with Smart Group Catering - Unpaywall
←
→
Page content transcription
If your browser does not render page correctly, please read the page content below
Cost of Dietary Data Acquisition with Smart
                                                          Group Catering

                                                        Jiapeng Dong, Pengju Wang, and Weiqiang Sun

                                            Shanghai Institute for Advanced Communication and Data Science, Shanghai
                                                           JiaoTong University, Shanghai, 200240, China
                                                                        sunwq@sjtu.edu.cn
arXiv:2001.00367v1 [cs.CY] 2 Jan 2020

                                              Abstract. The need for dietary data management is growing with pub-
                                              lic awareness of food intakes. As a result, there are increasing deploy-
                                              ments of smart canteens where dietary data is collected through either
                                              Radio Frequency Identification (RFID) or Computer Vision(CV)-based
                                              solutions. As human labor is involved in both cases, manpower allocation
                                              is critical to data quality. Where manpower requirements are underesti-
                                              mated, data quality is compromised. This paper has studied the relation
                                              between the quality of dietary data and the manpower invested, using
                                              numerical simulations based on real data collected from multiple smart
                                              canteens. We found that in both RFID and CV-based systems, the long-
                                              term cost of dietary data acquisition is dominated by manpower. Our
                                              study provides a comprehensive understanding of the cost composition
                                              for dietary data acquisition and useful insights toward future cost effec-
                                              tive systems.

                                              Keywords: CV systems, data accuracy, dietary data acquisition, di-
                                              etary management, health management, RFID systems, Smart group
                                              catering

                                        1   Introduction

                                        The emerging public concern with health has led to the proliferation of health
                                        management applications, individual health monitoring[1] and nutritional assessments[2,3]
                                        in which dietary data is often an important component. Given the diversity of
                                        food and unpredictable dining locations, however, recording a persons regular
                                        intake has never been an easy task. Since 2017, smart group catering (SGC)
                                        systems targeted at canteens of different sizes, and featuring automatic billing
                                        and data acquisition, have become popular. Onsite experiences with SGC sys-
                                        tems indicate that even though dietary data acquisition technologies seem to be
                                        readily available, data quality may vary drastically from one canteen to another.
                                        One important reason behind this is a widespread under-estimation of the nec-
                                        essary manpower needed for accurate data acquisition. Thus, it is important to
                                        understand this cost and its relationship to other factors.
                                            There are two types of widely used SGC systems implemented for dietary
                                        data acquisitionRadio Frequency Identification (RFID)- and Computer Vision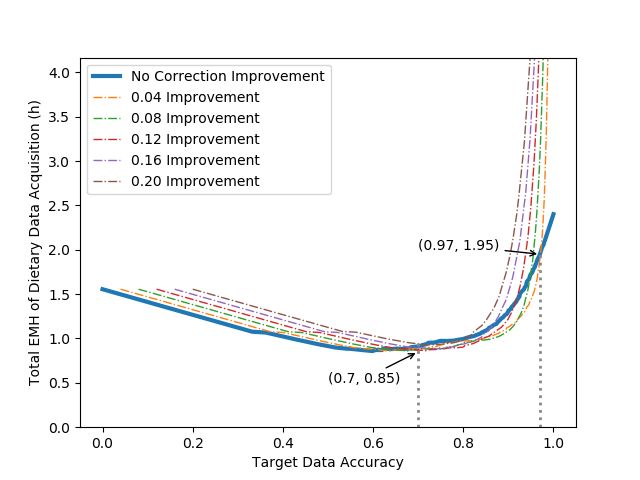
2         Jiapeng Dong et al.

(CV)-based solutions. The data acquisition workflows of the two types of solu-
tions are shown in Fig. 1. In RFID-based systems, special dishes with embedded
tags are used when food is served. The food information is read when customers
checkout. In CV-based systems, cameras are used at checkout counters to recog-
nize the dish . Fig. 1 shows the basic workflow of a traditional canteen and the
extra procedural intrusion of the two systems.

      Fig. 1: Workflow of Traditional Canteen and Intrusion of Two Systems

    RFID is a mature technology and has countless applications, [4] e.g. RFID
systems were first proposed for SGC by Yao.X et al.[5] in 2011. There were
subsequent implementations by Y.H.Liang et al.[6], Pai-Hsun.C et al.[7] and
E.B.Kossonon et al.[8], which were mainly prototypes and somewhat different
from the systems deployed in canteens, as shown in Fig. 1. With the advantage
of mature technology and simple software, RFID systems currently account for
over 80% of the market.
    CV systems are less mature. The food detection algorithm used in CV sys-
tems has become popular in recent years. Lead by Bossard.L et al.[9] in 2014,
some researchers put up new datasets[10], while others focused on a food recog-
nition algorithm. A group of studies tried to solve image segmentation before
further recognition[11,12]. Those that directly tackle the entire food detection
mission[13,14] also achieve good performance. Among all these studies, the se-
quential works[15,16] are the milestone for the canteen scenarios, which also
provides solid references for our study.
    In this paper, we aimed to study the relation between dietary data quality
and invested manpower. We conducted our study by means of numerical simu-
lations, with parameters taken from real-life canteens operating SGC systems.
Our contributions are:

    – Information flow-centric modeling of dietary data acquisition for RFID and
      CV-based SGC systems.
    – A comprehensive numerical analysis of the cost of dietary data acquisition
      with the two types of technologies.
    – Comparative analyses of RFID and CV-based systems’ application scenar-
      ios and limitations based on the dynamic relationships between cost, data
      accuracy and other relevant factors of deployment.
Cost of Dietary Data 3
– Future directions and evolutionary trends for dietary data collection using
SGC systems.
The rest of the paper is organized as follows: Chapter 2 builds the cost accu-
racy model based on information flows and key procedure properties. Chapter 3
describes our data set and basic settings of the experiments. Chapter 4 progres-
sively analyzes the cost of dietary data harvesting and its major influence factors.
Other accessory factors are discussed in Chapter 5. Finally, the conclusions and
future outlooks are presented.
2 Models
In this section, we modeled different types of costs for both systems and the
relationships between relevant ones and data accuracy. We included the cost of
the system itself and the corresponding extra costs necessary to maintain normal
operation and obtain accurate data.
2.1 Cost Composition: Key Procedures and Cost Groups
In order to excavate the essential mechanism of dietary data harvesting in both
RFID and CV systems, we reviewed its general workflow, as illustrated in Fig. 1.
We considered the nature of data harvesting as an information flow. Thus, we
ruled out all the factors that were not concerned with the information flow.
Afterwards, we defined and located the key procedures for the necessary trans-
formation or transmission of dietary information. The rearranged and expanded
workflow chart is presented as an information flow chart in Fig. 2.
Fig. 2: Information Flow of Two Systems: Step blocks in white background are
the intermediate formation or carrier of dietary information and those in gray
represent sources and targets.
From Fig. 2, the data quality of RFID systems is much more dependent
on staff operation at three key sequential procedures, namely inputting, setting4 Jiapeng Dong et al.
and labeling. The flow of CV systems, however, is primarily determined by its
algorithm performance and secondarily by sampling procedures. The information
flow of RFID systems looks simpler and more direct while the flow of CV systems
contains fewer procedures requiring staff operation. Both systems have to correct
errors at checkout to ensure normal billing.
All costs are incurred during the procedure of information transformation and
transmission. In order to discriminate between different cost items, we divided
them into two groups according to whether they are staff operation related costs
(SORC) or not staff operation related cost (NSORC). For each type of system:
SORC RF ID = Cinput + Cset + Clabel + Ccorrect (1)
X
N SORC RF ID = RF ID
Cdevices RF ID
+ Csof tware + Cplate−loss (2)
SORC CV = Csample + Ccorrect (3)
X
N SORC CV = CV
Cdevices CV
+ Csof tware (4)
, where Cplate−loss represents the RFID-embedded plates malfunctioning during
the usage, determined by the plate number used per meal and the statistical
loss rate. Assuming five years of lifespan, devices and their converted per meal
cost for each system are presented in Table. 1, where m depends on the ratio of
canteen total throughput and unit checkout velocity.
Table 1: NSORC Items Comprised in Two Systems
System NSORC Item Number Value (RMB)
RFID Writer T 1.37 × 10⁻¹
RFID Reader m 5.48 × 10⁻¹
Control Terminal 1 5.48 × 10⁻¹
Checkout Terminal m 5.48 × 10⁻¹
RFID
Peripheral Network 1 2.74 × 10⁻¹
Server 1 8.22 × 10⁻¹
RFID software 1 5.48
RFID plate n ∗ rate 3.5
Embedded Camera m 8.22 × 10⁻²
Checkout Terminal m 8.22 × 10⁻¹
CV
Server (extra training) 1 1.37
CV software 1 10.96
a
T for dish types and n for total plate number.Cost of Dietary Data 5
2.2 Factors of Accuracy: Staff Operation and Sample Accumulation
From the information flow in Fig. 2, we concluded that the data accuracy mecha-
nism differed between the two systems. The RFID system contained three staff-
operated procedures and did not generate any false data when all three pro-
cedures were operated without any failure. Although the CV system required
sampling and marking procedures, the number of executions was much smaller
compared to the scale of the data to be collected. Meanwhile, the data was deter-
mined by the deduction results, which made the performance of the CV system
mainly dependent on the CV dish recognition model applied and the number of
samples in the training set.
man-hours was adopted as the measure of staff work in different procedures.
Moreover, we expanded the man-hour concept into equivalent man-hours (EMH)
which was defined to equivalently measure the extra cost invested to harvest di-
etary data across distinct procedures. With regards to the staff’s non-standard
operation and corresponding accuracy, based on our on-site knowledge, the fol-
lowing assumptions were raised:
– The accuracy of a key procedure carried out by staff once was proportionate
to the extra EMH that the staff was provided.
– The accuracy of a key procedure always reached one hundred percent with
sufficient extra EMH.
– As the provided extra EMH increased, the marginal accuracy growth con-
tinuously decreased toward the endpoint of accuracy.
– The pattern of the marginal accuracy growth variation differed per procedure
according to their attributes.
Since the power function is the simplest function fitting all these assumptions,
it was used to construct our EMH Accuracy (EMH-A) model:
h
Accuracy(h) = ( )α , 0 ≤ α ≤ 1 (5)
S
, where S is the standard EMH needed when accuracy reaches one hundred
percent, and alpha is the procedure distinction coefficient representing procedure
features’ effects on the marginal accuracy growth patterns. The specific S values
of inputting, setting, labeling and correction procedures are based on the average
time taken in a real canteen environment. In addition, the knowledge and skills
required by the procedures are also taken into account. The baseline values are
listed in Table.2
The value of α depended on procedure features. The staff-related procedures
in dietary data harvesting scenarios usually have three features: automation
degree, throughput pressure, and internal complexity. A procedure with more
automation is more accurate, and thus the value should be bigger. It is more
difficult for a pressured procedure to reach high accuracy, which leads to a small
value. Higher accuracy can be easier to achieve with lower EMH if the proce-
dure is comparatively simple, so the value should be small. A binding system
like RFID usually has high pressured labeling and correction procedures, a less6 Jiapeng Dong et al.
Table 2: Parameters of EMH Accuracy Model
Procedure S (hour) α
−1
Inputting 1.7 × 10 0.6
Setting 6.7 × 10⁻² 0.4
Labeling 1.39 × 10⁻³ 0.1
Correction 1.1 × 10 (1.1 × 10⁻³ )
−2
0.15
pressured but more complex and automatic setting procedure and a more com-
plex but less pressured inputting procedure. Therefore, using the values of α
shown in Table. 2, the curves of each procedure are drawn in Fig. 3, where the
EMH-axis offset of the correction procedure is determined by the fixed cost of
total price correction, which is crucial for normal billing.
Fig. 3: Accuracy by Unit EMH Cost of Four Procedures’ EMH-A Models
As in the previous discussion, the algorithm used in the CV model is the
major internal factor for data accuracy. The procedure of information inputting
including sample dish preparation, sampling (photo taking), and marking, with
time reserved for training, was also taken into consideration. The cost of this
procedure is very high, about 0.33 h of EMH. This forces the on-site manager
to minimize the sample number and to use the served dish for new samples
at checkout as much as possible. Based on the general characteristics of the CV
learning model, three assumptions were raised to model the relationship between
deduction accuracy and sample size used in training:
– The performance of deduction always has a less-than-one upper bound de-
cided by the algorithm the model applies.
– When the accuracy is low, the increment caused by sample number increase
is prominent.
– As the accuracy approximates its upper bound, its marginal growth drops
increasingly rapidly.Cost of Dietary Data 7
We chose the sigmoid function as our prototype to approximate the actual
learning process of the dish recognition model. The Sample Number Accuracy
(SNA) model is as follows:
Accuracy(nsample ) = U ∗ sigmoid(β ∗ nsample ) (6)
, where nsample represents the number of samples, U the upper bound, and β
is the transmission coefficient representing the algorithm’s feature extraction
efficiency. Based on the algorithm performance in [16] and actual deployment
situations, the value of U was set to 0.85.
3 Experiments
3.1 Data Sets and Baseline Parameters
Our data set was collected from thirteen canteens throughout mainland China.
The types of canteens included government departments, primary schools, col-
leges, private and state enterprises. The data content contained the SGC system
deployment profile of each canteen, menu update records of over four hundred
dish types and over a million dish transaction details over a time span of more
than half a year. The data set established a numerical foundation for our simu-
lations.
According to previous procedure and information flow analyses, four main
canteen features which have major impact on data acquisition cost were ex-
tracted. These four canteen parameters are listed in Table. 3, with their defini-
tions and units. The values here were based on the profile of our most familiar
canteen, and were used as the baseline in the experiments. In addition, the prod-
uct of T and N represents the canteen’s scale, i.e., the customer capacity, while
F and R show the canteen’s service quality.
Table 3: Canteen Feature Parameters
Parameter Definition Unit Value
T per meal dish types types / meal 20
N dish number of each type dishes / type 70
F frequency of adding new dish type types / meal 0.3
R rotation of old dish type types / meal 6
3.2 Basic System Characteristics and Experimental Settings
Here we briefly look into the basic characteristics of the two systems in order to
make preliminary settings for experiments.8 Jiapeng Dong et al.
Cost Allocation of RFID Systems RFID systems comprise of three sequen-
tial key procedures among which cost can be allocated in various proportions.
The function between a set of EMH costs, i.e., (Hinput , Hset , Hlabel ) and the cor-
responding accuracy, cannot be clearly depicted in graphs. After changing the
F of our canteen baseline to zero for simplification and better demonstration,
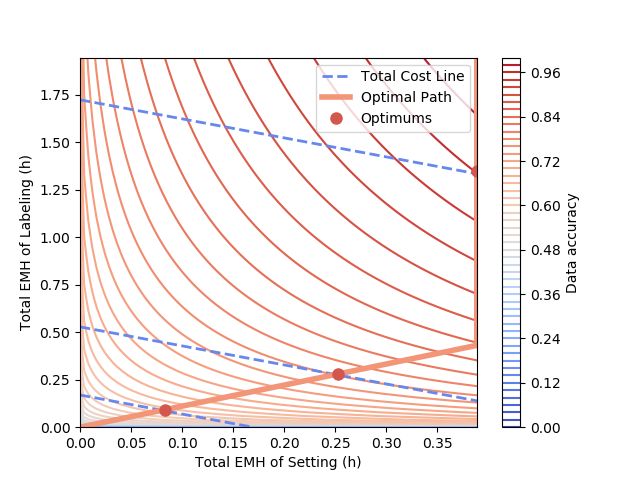
we were able to draw the accuracy contour by the summed EMH cost of setting
and labeling in Fig. 4a.
In this simplified condition, we can prove that for each convex accuracy
contour, there is a point where the total cost of the two procedures is optimal.
These points, as are shown in Fig.4a, form an optimal path joined first by the
tangent points of the auxiliary total cost line with the contour, and then by the
intersections of the line with the upper boundary of setting. The segmentation
of optimal path like this is common since the cost of labeling is major in most
conditions.
In summary, there is always an optimal path for EMH cost allocation and
the path can be approximated as a broken line with several fixed proportions.
Therefore, the path is adopted wherever relevant throughout this paper.
Cold Start Problem of CV Systems CV systems are stateful and their
accuracy depends on the size of the training set. Accuracy is attainable, but a
ramping-up process is necessary considering the high cost of sampling which the
canteen usually tends to skip or cut down. Thus, as demonstrated in Fig. 4b,
the cold start problem of CV systems results in the ramping-up period (RP)
of accuracy which zooms at the very beginning and ends when the differential
accuracy increment (3-meal-long window) drops below 1 × 10⁻⁵ . The rest part
is defined as the stable period (SP) because the accuracy only fluctuates in a
comparatively small range. The cost decreases sharply during the RP, especially
between the first two meals (about a hundredth), and in SP peaks in accordance
with the frequency of new dish addition, with an overall low average afterwards.
Extra EMH in RP, which can be multiple times that of SP, is essential and
requires preparation in advance. Fortunately, the cold start problem only hap-
pens when a great many types of new dishes need to be sampled, and in most
conditions only once. The infrequent occurrence of the problem and the large
EMH gap between the two periods make it possible and reasonable to ignore
the RP in a long term study. We will regard the EMH of the CV system to be
specialized in SP unless otherwise mentioned.
4 Results
In order to conduct a thorough study into the cost of dietary data harvesting
with RFID and CV systems, we started our baseline from the general cost and
its composition. Then we focused on the SORC dynamics of the two systems
under variable accuracy targets. After another set of experiments conductedCost of Dietary Data 9
(a) RFID Systems: Accuracy Contour and (b) CV Systems: Accuracy and Total EMH
Optimal Allocation Path of First Hundred Meals
Fig. 4: Basic Characteristics
under various canteen conditions, four typical canteens were specified and used
as examples for straightforward understanding.
4.1 General Cost Composition
Simulations were carried out with the two separate systems to evaluate the total
cost of dietary data harvesting of a single meal with target accuracy of 1 in the
baseline canteen. For a better comparison of NSORC in canteens of different
scales, another set of experiments on an enlarged canteen were also appended.
For experiment settings, NSORC items’ statistical prices and baseline values of
model parameters were adopted as listed in TABLE. 1. The enlarged canteen
was set with twice the customers (900 people) and more dish types (50 types).
Furthermore, the values of EMH were transformed into RMB by current average
hour wage level. In this way, we had four groups of total cost with composition
as shown in Fig. 5.
NSORC accounted for around 10% to 15%, much less than SORC does in
both systems and both canteens. The sum of NSORC of both systems in the
baseline canteen differs little (about 1% of total), but as the scale of the canteen
increases, the NSORC of RFID systems increases faster than CV systems, due
to its extra plate loss (about 1.9% of total) and RFID writing devices bonded to
dish type numbers (about 2.2% of total). Meantime, the impact on CV systems
from device addition appears minimal with barely a 0.7% increment of the total.
Compared to the insignificant increase of NSORC, SORC ascends synchronously
with the canteen scale both in sum and ratio. Based on the invariance and mi-
nority role played by NSORC in data accuracy, SORC is more worthy of further
study.10 Jiapeng Dong et al.
Fig. 5: Mealy Cost of 100% Target Accuracy by Cost Group, System and Canteen
Scale: SORC(left) and NSORC(right) for each system and canteen.
4.2 SORC by Target Accuracy
In this section we explore the relationship between the SORC and data accuracy,
in a specific baseline canteen scenario. As was illustrated above, RFID systems’
accuracy could be assigned arbitrarily between 0 and 1 while that of CV systems
was fixed at the average level of the stable period without manual data correc-
tion at checkouts. The higher accuracy of CV systems required manual data
correction at checkout. The same correction could also be available for RFID
systems but will be discussed later.
Experiments were performed conforming with the baseline canteen and with
three accuracy targets, as is shown in Fig. 6a. The diagram describes the dis-
tinction of the two systems in general: With base SP accuracy, the cost of the
labeling procedure accounts for about 33% of RFID systems, while in CV sys-
tems the sampling procedure dominates. When the target accuracy rises, despite
the correction cost decrement, the labeling procedure takes up almost the entire
cost increment (about 25.7% and 52.3% of total) while setting and inputting
procedures remain nearly the same. When it comes to CV systems, with the
invariant sampling cost, the correction cost increment is minor (about 3.1% of
total) when the accuracy grows to 90%, but it then increases to full accuracy.
Therefore, the target accuracy was expanded to the whole range. The results of
more detailed experiments are demonstrated in Fig. 6b. The cost curve when
data is manually harvested is also provided for comparison.
In the baseline scenario, the RFID system out-performed the CV system
only when accuracy was above 0.96. The curve of the RFID system in Fig. 6b
showed convexity to some degree, with a minimal cost around accuracy of 0.6,
because of the increased total price correction cost at low accuracy and the high
cost required for high accuracy. Without data correction, the accuracy of CV
systems stabilized at 0.84 and increased to 0.92. This efficiency was lost when
the power law of the correction cost dominated and the cost surpassed the level
of RFID systems (around 0.96).Cost of Dietary Data 11
(a) Cost Composition (b) Total Cost Comparison
Fig. 6: SORC by Target Accuracy
To summarize, compared to the manual means of data harvesting at checkout,
the SGC systems take the lead beginning from 0.63 accuracy by CV systems and
then after 0.95 accuracy by RFID systems. Deploying an SGC system can save
over 80% of the cost of dietary data harvesting with an accuracy greater than
0.8.
4.3 SORC by Canteen Features
To extend our analysis to more canteens in real circumstances, experiments were
designed to determine how the four features of canteens, i.e., T , N , F and R
as listed in TABLE. 3, influenced the accuracy of harvested data and the cost.
T and N were grouped together as were F and R. Since a dynamic analysis
was required and the effect of target accuracy has already been studied, we
concentrated on the average cost and accuracy of CV systems’ stable period
and the cost across five different target accuracies of RFID systems, that is,
0.6, 0.7, 0.8, 0.9, 1.
Dish Type Numbers and Dish Number of Each Type The canteen scale
is consistent with the product of a canteen’s dish type number (T ) and dish
number of each type (N ). The range of T and N are expanded in both directions
simultaneously from our baseline values. The results are shown in Fig. 7.
Similarities in the influence patterns of both parameters were apparent in
the diagrams. In RFID systems, both T and N increased with approximate
linearity as their value ascended,. The speed of increase was relatively small,
about 5.56 × 10⁻³ h/type and 2.78 × 10⁻³ h/dish, under low target accuracy
(0.8 and lower). When the target accuracy rose beyond 0.8, however, the speed
was intensified, up to 1 × 10⁻¹ h/type and 2.78 × 10⁻² h/dish at accuracy of
1. For CV systems, both influences on the cost fluctuated only slightly, without
recognizable patterns. The increment of the two features caused weak growth12 Jiapeng Dong et al.
(a) by T of RFID (b) by N of RFID (c) by T of CV (d) by N of CV
Fig. 7: SR Cost by T
of average accuracy (no more than 0.02). Furthermore, the accuracy deviation
reduction against boosting dish types was caused by the decreasing proportion
of fixed new dish frequency(F ).
New Dish Frequency The frequency of appending new dishes (F ) can differ
significantly among canteens, from only one new dish in weeks to several new
dishes every meal. Therefore, we used the logarithmic scale for the F value. The
results of both systems are shown in Fig. 8a and Fig. 8b.
(a) RFID Systems (b) CV Systems
Fig. 8: SR Cost by F
The results revealed the distinct effect of F on the costs of the two systems:
The range of F was segmented by 1 type/meal for RFID systems. The cost
grew slowly in logarithm when F was smaller than 1, i.e., new dishes were not
added at each meal. As F passed 1, the curve was computed to be approximately
linear and the cost grew much faster than that of a smaller-than-one F . With
accuracy of 1, the rate was about 2.08 × 10⁻¹ h/type∗meal. However, F ’s effect
on CV systems shows uniformity, i.e., linearity along the whole range (aboutCost of Dietary Data 13
1.67 h/type∗meal). Another significant point is the reverse impact on accuracy,
an approximately linear decrement with a ratio of about 0.011 /type∗meal.
The distinction proves the far bigger influence of F ’s value on CV systems
than on RFID systems.
Dish Rotation Number CV systems are free of the costs of dish rotation
because the features of the old dishes have been extracted and stored inside the
CV model. RFID systems, however, have no way to deal with the problem except
by updating the settings before or during the meal. Experiments were arranged
with expanded R range from the baseline, as is shown in Fig. 9.
Fig. 9: SR Cost by R of RFID Systems
The result illustrated that with different target accuracies, the cost of RFID
systems changed linearly against the value of R at an approximately marginal
rate, about 5.56 × 10⁻² h/type∗meal. The higher the target accuracy was, the
more sparsely the curves were distributed. This proved the R parameter affected
the cost independently of data accuracy.
Comprehensive analysis After four canteen features were studied, all the
results were organized into Table. 4 for comparison.
By analyzing the table, we could make the following conclusions. Firstly,
it was expensive for both systems to add new dish types, but the degree was
comparatively smaller for RFID systems at about one eighth of that of CV.
Secondly, the cost of CV systems was directly affected by F , along with collateral
damage to data accuracy. Finally, four features affect the cost of RFID systems
to similar degrees but when target accuracy escalates, the effect from T and N
multiplies and thus dominates.14 Jiapeng Dong et al.
Table 4: Marginal Cost (h) by Systems and Canteen Feature Effects
Parameter RFID-80% RFID-100% CV SR Cost CV Accuracy
−1 −3
T +1 × 10 +5.56 × 10 - +4 × 10⁻⁵ (T < 45)
N +2.78 × 10⁻² +2.78 × 10⁻³ - +4 × 10⁻⁵ (N < 80)
F +2.08 × 10⁻¹ +1.94 × 10⁻¹ +1.67 −1.1 × 10⁻²
R +5.56 × 10⁻² +6.39 × 10⁻² - -
4.4 Cost in Typical Canteen Scenarios
The values of the four features we studied have different distributions based on
our dataset from real canteen situations. Four major combinations of feature
values were extracted to construct four typical canteens as listed in Table. 5.
We noticed that the value of N was relatively stable in real circumstances and
the scale of the canteen was mainly indicated by T . Moreover, a canteen usually
tended to choose either a high F or R to ensure menu variation and reasonable
cost.
Table 5: Typical Canteens Based on Statistics
T N F R Customer number
TYPE I 20 70 0.3 6 450
TYPE II 20 70 3 12 450
TYPE III 50 70 0.75 15 1200
TYPE IV 50 70 7.5 30 1200
With these four canteens, we demonstrated the cost in a more specific way.
Apart from the general results explained, there were new insights as depicted
in Fig. 10: For a canteen with a high old dish rotation like types I and III, if
data accuracy was no more than 0.95, the CV system was recommended and
could save up to 50%-75% of costs. The bigger the canteen, the larger the cost
saving. As the accuracy increased, the cost difference declined and the RFID
system became better for ultimate accuracy (higher than 0.95). Meanwhile, for
a canteen with a high new dish frequency, like types II and IV, the RFID system
was always the better choice. Costs could be saved up to 50% for moderate,
and 70% for large scale canteens. The cost difference decreased a little as the
accuracy increased from 0.8 to 0.95.Cost of Dietary Data 15
(a) Type I (b) Type II (c) Type III (d) Type IV
Fig. 10: Total Cost by Typical Canteens
5 Discussions
This section discusses supplemental factors, including model parameter sensitiv-
ity, correction features and balancing, and standardization of dishes, in order to
generalize our research and facilitate applications.
5.1 Model Parameter Sensitivity: A Long Term Perspective
The values of parameters listed in the Model section are based on our dataset
and on-site measurements, which may have some deviations on a real occasion.
Moreover, the change of social labor prices and technology improvements in the
long term can also cause the variation of these values. To make our work more
practical, extra experiments were performed to identify the extent of the influ-
ences caused by these deviations. Experiments were conducted in the baseline
environment.
The S and α in EMH-A Models The EMH-Accuracy model was most
widely used throughout our research. The basic key procedures of RFID systems,
namely, inputting, setting and labeling, plus correction procedures contained in
both systems, all applied to this model to describe the corresponding relationship
between manpower cost and data accuracy. Thus, we selected labeling, as it was
found to be the dominant procedure in RFID systems, to experiment on the two
parameters’ value deviation effects on the total cost. The results are drawn in
Fig. 11.
Further calculation based on the diagrams showed that the variation degree
of total cost was proportionate to the deviation degree of S by 1 accuracy, 50% S
increment vs. 45% cost increment in Fig. 11a. The effect decreased as the target
accuracy dropped and became minor when the accuracy dropped beneath 0.8.
Since the cost of labeling was dominant, the effect of S deviation was smaller
when it came to other procedures like inputting, setting and correcting. This
also applied to S in the sampling procedure in CV systems. In terms of the
α deviation, it mainly affected the total cost in a range of accuracy between
0.7 to 0.93, about 50% α increment for 20% total cost increment. The effect
increased slowly as the α value decreased. In addition, the α decrement also led
to relatively more difficulty to achieve a higher accuracy.16 Jiapeng Dong et al.
(a) SR Cost by S (b) Unit EMH by S (c) SR Cost by α (d) Unit EMH by α
Fig. 11: SR Cost by S and α Deviation
The β in SNA Model For the SNA model in CV systems, it is predictable
that experimenting on the U parameter will not generate anything substantial,
because of its direct bond with SP accuracy. Hence, the transmission coefficient
β, also the expansion degree of our adopted sigmoid curve, was selected. Exper-
iments were carried out in a similar way to Section 5.1, with results as shown in
Fig. 12.
Fig. 12: SP Cost and Accuracy by β Deviation
The results showed that there was no obvious bond between the β value and
the total cost. However, the β value growth caused a small accuracy decrement
around 0.002 for 50% deviation.
Finally, the long term change is also worth mentioning. As a global trend,
the inevitable manpower price increases will cause S to increment and thus the
total cost will increase; The enhancement of systems’ degree of automation will
lead to a bigger α value which will make it more economical to pursue accurate
data; The development of the CV algorithm will trigger a smaller β and thereby
higher accuracy and lower cost for CV systems.Cost of Dietary Data 17
5.2 Correction Features: Balancing in Local Conditions
As stated in Section 4.2, data correction at checkout is the only measure for
CV systems to improve their data quality. Further, correction is optional for
RFID systems. The cost of correction is decided by the number of errors and
expected accuracy improvement. Since CV systems have firm requirements, we
experimented on canteens with different customer capacities which is propor-
tionate with the product of T and N , to explore its impact on correction cost.
The results are depicted in Fig. 13a, where the dotted line is located by points
with the same marginal cost growth right before the abrupt rise. Considering the
efficiency of the accuracy improvement by correction, there is a dynamic limit
for each canteen scale. In addition, the space for improvement lessens by about
0.022 as the canteen capacity grows from 190 to 700 customers.
(a) by Customer Capacity of CV Systems (b) by Improvement Degree of RFID Sys-
tems
Fig. 13: Correction Cost by Customer Capacity and Improvement Degree
For the RFID system, we constrained the accuracy improvement within 0.2
and activated the correction procedure. The results are illustrated in Fig. 13b.
The results proved that it costs much more to depend on correction when perfect
accuracy is demanded since humans are more apt to make mistakes especially
in a high-pressured condition like checkout. Correction can save the cost, about
10% maximum, when the target accuracy is between 0.7 and 0.97.
Overall, because of the elevated cost along improvement degree, correction
can only bring about small cost savings in a small accuracy range and thus
cannot be relied on. For CV systems, there is an efficient improvement limit
which is comparatively constant. The cost of accuracy above the limit multiplies
and is not economical.18 Jiapeng Dong et al.
5.3 Standardization of Dish Supply: An Inevitable Trend
The frequently changed menus and recipes in modern canteens have always been
the biggest liability to dietary data harvesting, and even more so for Chinese
foods. Except for the extra cost paid for information inputting and on-site set-
ting, the irregularity of the menus and the recipes also costs more in sections
outside the SGC systems. Inconsistent material ordering, temporary dish inter-
ference and other expenditures can be saved if a relatively unified menu and
recipes are coordinated. To determine the cost saving of dish standardization, a
complementary experiment was carried out and the results are drawn in Fig. 14.
Fig. 14: Cost in Standardized Canteen: Baseline canteen is used for comparison.
So, as is shown in Fig. 14, a canteen without dish addition and rotation can
lead to cost savings in dietary data harvesting of up to 46.7% for RFID systems
and 55.1% for CV systems. Against the background of emerging self-awareness of
health concerns and dietary management, it seems possible for customers to com-
promise their preferences if effective dietary management is provided. Moreover,
the dish standardization may be more economical where dietary management
is of greater urgency, for example in hospitals, rehab facilities and so on. We
believe that instead of passively waiting for technology developments, it would
be wiser to embrace the trend of dietary management and make self-adjustments
to our own habits.
Conclusions
In this paper, we conducted an in-depth analysis of the essential mechanisms
and the fundamental distinctions between RFID- and CV-based SGC systems.
We analyzed the manpower costs required for dietary data acquisition, which is
often overlooked. The tag binding of RFID systems leads to its long pipelined
manual operations and the upper bound of CV systems’ recognition models con-
strains system reliability, which results in unacceptable costs to maximum data
accuracy. Two models based on the characteristics of staff operation in specificCost of Dietary Data 19
procedures(the EMH-A model) and sample accumulation (the SNA model) were
proposed. Datasets collected from real canteens were used as input data.
In relation to the cost of dietary data acquisition, we have developed major
numerical conclusions as follows:
– In order for accurate dietary data acquisition, a large amount of extra costs
are required, of which staff operation related costs account for up to 90%.
– When deploying RFID systems, the cost of labeling procedures accounts for
80% of the staff related costs. The labeling procedure is also the bottleneck
to achieve perfect accuracy.
– The accuracy of CV systems can be improved by around 0.08 to 0.92 through
efficient checkout corrections, but it is unrealistic to go on forcing the accu-
racy to 1, since the total cost will multiply about 8 times.
– For both types of systems, the marginal costs continued to rise when higher
data accuracy was demanded. CV systems had a much higher rising rate,
making its total costs bypass those of RFID systems after 0.95 accuracy.
– It is expensive to continually introduce new dishes although RFID systems
were comparatively more suitable for a moderate-sized canteen with frequent
new dish additions.
– CV systems were vulnerable to new dish additions, which increased costs
by about 1.67 h / type and jeopardized the accuracy by about 0.01 / type,
while there were advantages for a large-scaled.
Based on our analysis, the current advantages of RFID systems will diminish
if no improvements on labeling procedures occur. CV systems can benefit from
improving recognition algorithms, and higher levels of automation in sampling.
They may also benefit from publicly available dietary datasets.
Acknowledgment
We acknowledge the support of the National Natural Science Foundation of
China under grant 61433009, and the National Key Research and Development
Project of China under grant 2019YFC1709800.
—- Bibliography —-
References
1. Peom Park, Kyongpil Min: Development of the Wellbeing Life Support System in
Ubiquitous. 2007 International Conference on Convergence Information Technol-
ogy (ICCIT 2007). Piscataway, New Jersey, US:IEEE ?2007o1108-1115.
2. Mark Hsiao, Ya-Fan Yeh, Pei-Yun (Sabrina) Hsueh and Selina Lee: Intelligent
Nutrition Service for Personalized Dietary Guidelines and Lifestyle Intervention.
2011 International Joint Conference on Service Sciences. 11-16.
3. Parisa Pouladzadeh, Shervin Shirmohammadi, Abdulsalam Yassine: Using Graph
Cut Segmentation for Food Calorie Measurement. 2014 IEEE.20 Jiapeng Dong et al.
4. Ganjar Alfian, Jongtae Rhee, Hyejung Ahn, Jaeho Lee, Umar Farooq, Muhammad
Fazal Ijaz, M. Alex Syaekhoni: Integration of RFID, wireless sensor networks, and
data mining in an e-pedigree food traceability system. Journal of Food Engineering,
Volume 212, 2017, Pages 65-75.
5. Yao Xiaochun?Jiang Yuhong: Canteen Consuming Management System Design
Based on CAN Bus and Radio Frequency Identification. Proceedings 2011 Inter-
national Conference on Transportation, Mechanical, and Electrical Engineering
(TMEE 2011). Piscataway, New Jersey, US:IEEE?2011o1169-1172.
6. Y. H. Liang, P. H. Chen, and J. J. Chang: Integrating RFID technology and dietary
management of electronic plate. Digital Life Science and Technology Symposium
2012, pp.245-250, Taiwan, Yunlin, Aug., 2012.
7. Pai-Hsun Chen, Ying-Hsin Liang, Tsung-Chi Lin: Using e-Plate to Implement a
Custom Dietary Management System. 2014 International Symposium on Com-
puter, Consumer and Control (IS3C 2014). Piscataway, New Jersey, US: IEEE,
2014. 978-981.
8. E. B. Kossonon and H. Y. Wang: IOT based smart restaurant system using RFID.
4th International Conference on Smart and Sustainable City (ICSSC 2017), Shang-
hai, 2017, pp. 1-6. doi: 10.1049/cp.2017.0123
9. Bossard L., Guillaumin M., Van Gool L. Food-101 C Mining Discriminative Com-
ponents with Random Forests. Fleet D. Computer Vision C ECCV 2014. Cham,
Switzerland: Springer, 2014. 446-461
10. Qiang Cai, Jing Li, Haisheng Li, Yunxuan Weng. BTBUFood-60: dataset for object
detection in food field. 2019 IEEE.
11. Guoyang Su, Dongxiao Li, Yifei Wang, Lianghao Wang, Ming Zhang. Chinese Dish
Segmentation Based on Local Variation Driven Superpixel Grouping and Region
Analysis. 2018 IEEE.
12. Sinem Aslan, Gianluigi Ciocca1, Raimondo Schettini1oSemantic Food Segmenta-
tion for Automatic Dietary Monitoring. 2018 IEEE 8th International Conference
on Consumer Electronics - Berlin (ICCE-Berlin).
13. Marc Bola?nos, Petia Radeva. Simultaneous Food Localization and Recognition.
2016 23rd International Conference on Pattern Recognition (ICPR) Canc2n Cen-
ter, Canc2n, M—xico, December 4-8, 2016. 3140-3145.
14. Yunan Wang, et al. Mixed Dish Recognition through Multi-Label Learning.
CEA?19, June 10, 2019, Ottawa, ON, Canada.
15. Gianluigi Ciocca, Paolo Napoletano, Raimondo Schettini. Food Recognition: A
New Dataset, Experiments, and Results. IIEEE JOURNAL OF BIOMEDICAL
AND HEALTH INFORMATICS, VOL. 21, NO. 3, MAY 2017. 588-598.
16. Eduardo Aguilar , Beatriz Remeseiro, Marc Bola?nos, Petia Radeva. Grab, Pay,
and Eat: Semantic Food Detection for Smart Restaurants. IEEE TRANSAC-
TIONS ON MULTIMEDIA, VOL. 20, NO. 12, DECEMBER 2018. 3266-3275.You can also read