Using Mobility for Electrical Load Forecasting During the COVID-19 Pandemic - arXiv
←
→
Page content transcription
If your browser does not render page correctly, please read the page content below
1

                                                  Using Mobility for Electrical Load Forecasting
                                                        During the COVID-19 Pandemic
                                                                                       Yize Chen, Weiwei Yang and Baosen Zhang

                                              Abstract—The novel coronavirus (COVID-19) pandemic has                  patterns. The overall electricity usage has fallen to a 16-year
                                           posed unprecedented challenges for the utilities and grid opera-           low in the US [2] with significant regional variations. Both
                                           tors around the world. In this work, we focus on the problem of            the PJM and NYISO experienced about 9% decreases in peak
                                           load forecasting. With strict social distancing restrictions, power
arXiv:2006.08826v1 [eess.SP] 15 Jun 2020

                                           consumption profiles around the world have shifted both in mag-            demand in March of 2020 [1], with New York City observing
                                           nitude and daily patterns. These changes have caused significant           decreases up to 21% in April of 2020 [3]. Similar shelter-in-
                                           difficulties in short-term load forecasting. Typically algorithms          place directives were effective in Europe, and Italy saw the
                                           use weather, timing information and previous consumption levels            biggest reductions of 25% of demand [4].
                                           as input variables, yet they cannot capture large and sudden
                                                                                                                         In addition to the changes in peak demand, the temporal
                                           changes in socioeconomic behavior during the pandemic.
                                              In this paper, we introduce mobility as a measure of economic           patterns in consumption have also shifted to unseen curves
                                           activities to complement existing building blocks of forecasting           as people started to stay at home. For example, Fig. 1 shows
                                           algorithms. Mobility data acts as good proxies for the population-         the year-to-year changes for days in February and March for
                                           level behaviors during the implementation and subsequent easing            the Boston metropolitan area [5] (Boston and the State of
                                           of social distancing measures. The major challenge with such               Massachusetts stated to enact stay-at-home orders on March
                                           dataset is that only limited mobility records are associated with
                                           the recent pandemic. To overcome this small data problem,                  15, 2020). The days are all weekdays with similar weather.
                                           we design a transfer learning scheme that enables knowledge                The load profiles for Feb 18th, 2019 and Feb 18th, 2020 are
                                           transfer between several different geographical regions. This              relatively similar. However, on March 20, 2019, there is a
                                           architecture leverages the diversity across these regions and the          pronounced double peak pattern, while the same day in 2020
                                           resulting aggregated model can boost the algorithm performance             shows a very different pattern with relatively flat load with a
                                           in each regions day-ahead forecast. Through simulations for
                                           regions in the US and Europe, we show our proposed algorithm               small peak in the early evening.
                                           can outperform conventional forecasting methods by more than
                                           three-folds. In addition, we demonstrate how the proposed model
                                           can be used to project how electricity consumption would recover
                                           based on different mobility scenarios.

                                                                   I. I NTRODUCTION
                                              The coronavirus disease 2019 (COVID-19) pandemic has
                                           impacted almost every aspect of our society and the electric grid
                                           is no exception. As many sectors continue to operate remotely
                                           through communication technologies, the grid is more than ever
                                           operating as the glue that holds the society together at these
                                           challenging times. As electric utilities and system operators
                                           strive to provide reliable power to communities when they need
                                           it the most, the pandemic has caused challenges ranging from               Fig. 1. Comparison of changing load patterns of Boston Metropolitan for
                                           the health and safety of frontline crews to the long term supply           February 18th and March 20th in 2019 and 2020. All four days are weekdays
                                                                                                                      and experienced similar weather conditions yet with varying load patterns.
                                           chains [1]. In this paper, we focus on a specific challenge: the
                                           unprecedented changes in electricity consumption patterns and                 These sudden and dramatic changes in the consumption pat-
                                           the need to provide better load forecasting algorithms.                    tern has caused difficulties in short-term load forecasting, since
                                              One of the most striking impacts of the pandemic on the                 no forecasting algorithm could have anticipated these levels of
                                           grid is the changes in load consumption patterns and the peak              changes in human behaviors. Forecast models are constructed
                                           demands. For example, in the United States, as stay-at-home                and validated on historical data, while the most important input
                                           orders were issued by the local and state governments and                  features for standard load forecasting algorithms are weather,
                                           social distancing were practiced to slow the outbreak of COVID-            timing information (day of the week, time of the day, seasonal,
                                           19, power consumptions shifted both in magnitude and daily                 etc.) and previous consumption data [6]. Using these inputs, it
                                                                                                                      is not difficult to construct models—e.g., by training a deep
                                             Y. Chen and B. Zhang are with the Department of Electrical and Com-      neural network—to achieve a day-ahead forecast error of less
                                           puter Engineering, University of Washington, Seattle, WA 98195; e-mails:
                                           {yizechen,zhangbao}@uw.edu. W. Yang is with Microsoft Research, Redmond,   than 2% for a city-scale utility [7]. In particular, daily forecasts
                                           WA 98052; e-mail: weiwya@microsoft.com                                     rely heavily on the assumption that similar days at similar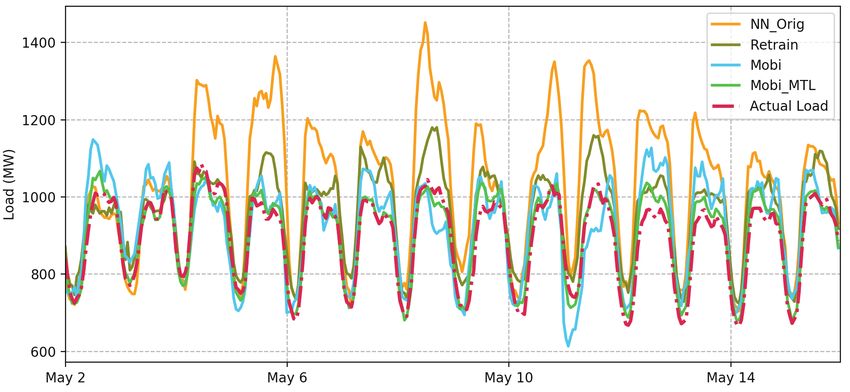
2

                                    April 2019   Germany      April 2020                    April 2019      CAISO         April 2020

               Error Distribution

Fig. 2. Comparisons of day-ahead load forecasts performance in April 2019 and April 2020 for Germany and California (CAISO), respectively. The upper row
shows the magnitudes of the forecasting error for days in April of 2019 and in April of 2020. The bottom row shows the forecast error distribution over April.
The errors are significantly larger for April of 2020, even after a month of staying-at-home and adjustment in the load forecasting process.

times of the year observe similar load patterns. The COVID-19 quantitative measure of the social and economic activities to be
crisis fundamentally changes this assumption, as there are no incorporated in forecasting algorithms, and the measurements
historically similar events ever since the construction of the should be readily available to help grid operators and utilities
current grid infrastructure. Therefore it is not surprising that with forecasting and understanding of the load patterns over
load forecasting algorithms used by operators have encountered time.
much larger forecasting errors since March of 2020.                  In this paper, we close the gap between on the forecasting
   Forecast errors can be partly mitigated by artificially setting performance before and during the pandemic by introducing
everyday as a weekend day, but this alone is far from sufficient mobility data as a measure of economic activities. The mobility
in closing the accuracy gaps [5]. Previous research also data is used as a complementary component of load forecast
investigated adaptive learning schemes where different regions model. Population-level mobility data, for instance, transit and
or seasons are considered [8], [9], yet no literature have shopping trends, show how people are changing their behaviors
considered the forecast tasks under an unexpected pandemic. once distancing mandates are implemented. Such data are
Figure 2 shows the published day-ahead forecast errors for readily available from third parties like Apple and Google [12],
Germany and CAISO on randomly selected days in April of [13], which is location specific and aggregated across the
2019 and April of 2020.1 There is significant over-forecasting population that enabled mobile services2 . Previous research also
in April 2020 compared to forecasts made in April 2019. Note indicated that mobility is highly correlated with the economic
that at this time Germans and Californians have largely stayed activities in a region [14], [15], therefore providing a good
at home for over a month and manual adjustment have been complementary input for forecasting algorithms.
made to the algorithms, but accurate load forecasting is still       However, there still exists practical implementation issues
a challenge for the system operator. In April 2019, Germany once user mobility is taken into account. We face a small-
reported an under-forecasting error of 3.51% compared to an data problem as most mobility data are only publicly available
over-forecasting error of 2.49% in April 2020, while the over- for parts of 2020. Therefore, we do not necessarily have a
forecasting errors in CAISO increased from 1.28% to 5.39%. lot of counterfactual information, since most of the mobility
   Since load forecasting is a fundamental step in power system would be at low levels compared to normal, but we do not
operations and is used as the basis of decision-making problems know the values of normal data. The key benefit of mobility
such as unit commitment, reserve management, economic data is that there is a lot of geographical diversity to offset
dispatch and maintenance scheduling [6]. Consequently, the the lack of temporal data. Different countries in the world,
accuracy of forecasted loads directly impact the cost and as well as regions in the United States are returning to work
reliability of system operations [10]. As shown in Fig. 2, in heterogeneous phases [16], [17]. Therefore we propose
even if customer behaviors stabilize somewhat, it is hard for to obtain enough training samples as well as diversity by
forecasting algorithms to adjust and catch up in a short amount combining data from different regions, and to investigate
of time. This challenge is compounded by the fact that as parts how small changes in mobility would drive changes power
of the world restart their economies in phased approaches, it consumption. To this end, we design a transfer learning
is likely that customer behaviors would again undergo rapid scheme that enables knowledge sharing between several regions,
fluctuations in the foreseeable future [11]. Therefore, we need
                                                                                  2 There are many other sources of mobility and traffic data, either through
  1 Data available from ENTSO-E at https://transparency.entsoe.eu; CAISO at     a company like INRIX or public transportation departments. These sources,
http://www.caiso.com.                                                           however, contain only data for specific routes or are privately owned.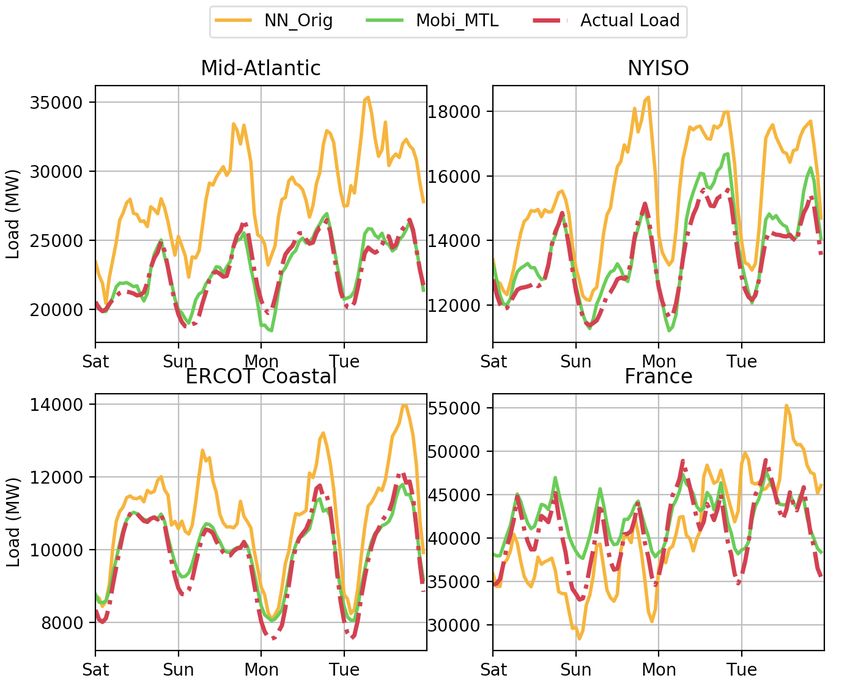
3

and the resulting aggregated model can boost the algorithm historical observations is available. The training or model fitting
performance in each region’s day-ahead forecast task [18].         process is to find a θ that minimizes the error on the training
   This study recognizes current difficulties in implementing dataset. During implementation, θ is fixed to predict the future
accurate and reliable load forecast algorithms, and illustrates load. We use fθ and f interchangeably when the dependence
the need to look at additional features reflecting the electricity on θ is clear.
usage behaviors during these uncertain times. We demonstrate          The input features Xt typically include weather, timing
that an accurate load forecasting, with results as good as information and historical load data [8], [22], [23]. The
those before the pandemic, is achievable by rethinking both weather features are normally considered as the most important
the forecasting models’ input and architecture. We make drivers of electricity demand, and we include temperature,
the simulation cases along with code publicly available3 . precipitation, cloud cover and air pressure in this paper. Note
Specifically, we make the following contributions in this work: that in forecasting, we make use of day-ahead, public-available
   1) We identify mobility data as an important complementary weather forecasts to construct the input vectors. For timing
      component for the forecast task during this global features, we include one-hot encoded variables (class variables)
      pandemic (Sec. II);                                          for hour of the day, month of the year, weekday/weekend
                                                                                                                         4
   2) We design a learning algorithm to learn and predict the distinction and holiday/non-holiday distinction. Since there
      electricity load by explicitly incorporating the mobility    are  plenty  of  historical  records  of  load  data   and weather
      patterns, and further adapt a transfer learning framework    measurements    and aggregate  load data exhibits  periodic  patterns
      to tackle data insufficiency issues (Sec. III);              well  explained  by the  input features, it is not difficult to train
   3) We perform extensive numerical simulations across            an  accurate forecasting  algorithm  for system   or regional  loads.
      various regions and countries to validate forecasting
      performances, showing they can be greatly enhanced
      by adopting proposed method. We also provide future
      projections of electricity demand using our proposed
      model (Sec. IV).

                       II. P ROBLEM S ETUP
   In this section, we first formulate the task of day-ahead
load forecasting. We then explain the inherent difficulties of
achieving accurate forecasts during periods affected by the
COVID-19 pandemic. We advocate that mobility data is a
viable candidate feature to satisfy the necessity of incorporating
social and economic behaviors in forecasting algorithms.

A. Day-Ahead Load Forecasting
   A host of models have been proposed to fulfill the task
of short-term load forecasts which include linear regression,
support vector regression, autoregressive models and neural
network models (e.g., see [7], [19], [20], [21] and the refer-
                                                                                        Feb 15    Feb 25   Mar 6     Mar 16     Mar 26        Apr 5          Apr 15
ences within). Most (deterministic) forecasting algorithms are
                                                                                                                              March 10: State of Emergency
constructed and fitted to find the mapping from a group of
specifically designed input features Xt at timestep t to future              Fig. 3. The changing pattern of load, mobility and daily temperatures for
loads Lt+k , where k is the forecasting horizon. In this paper, we           Boston area. Daily driving and transit data are from Apple Mobility Trends
focus on the task of day-ahead forecasting at hourly resolutions,            Reports and Google Community Mobility Reports respectively.
so k ∈ [1, 24]. Without loss of generality, we normalize the
loads such that Lt+k ∈ [0, 1] for all k.                                     B. Modeling the Effects of COVID-19
   Mathematically, forecasters are interested in finding an                     Because of economic disruptions and behavioral interven-
accurate model, parameterized by θ:                                          tions such as shelter-in-place orders, the forecasting perfor-
           fθ (Xt−H , ..., Xt ) = L̂t+k , k = 1, . . . , 24            (1)   mance using the standard set of features described in the
                                                                             previous section has degraded. This is not unexpected since
where H determines how much history of training data the                     these features cannot capture the rapid changes in social
operators want to take into consideration for forecasting.                   behaviors and ad hoc fixes such as treating all days like
Accuracy is normally judged based on the error between the                   Saturdays have had limited benefit. But inaccurate forecasts
forecasted load and the true load, for example, using the mean               could bring significant harm, especially at these times. For
squared error (MSE) or mean absolute error (MAE). We assume                  instance, overestimation of system loads may cause generators
that a training dataset Dtr = {(Xt−H , ..., Xt ); Lt+k }Tt=1 of              supplying excessive energy which cause higher grid operation
  3 https://github.com/chennnnnyize/Load-Forecasting-During-COVID-19           4 We   include the major national holidays with respect to each load region.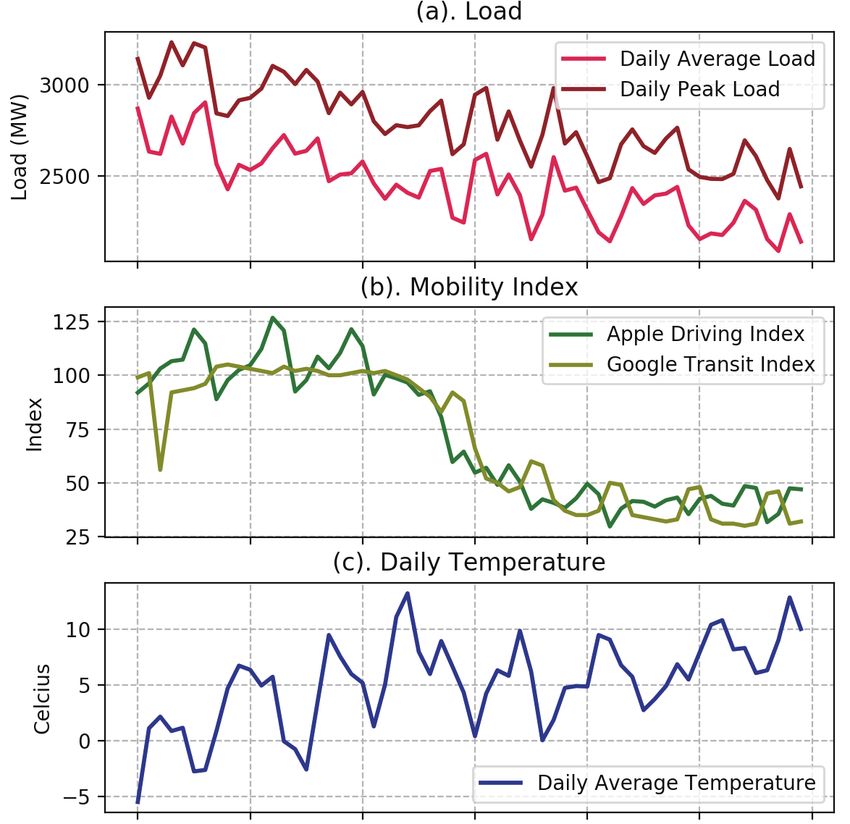
4

risks, while critical sectors such as hospitals are in need of        all available features as an input vector, and feed it into the
reliable electricity access.                                          input layer Y0 = [Xt−H , . . . , Xt ].
   In this paper, we address two fundamental challenges that             While day-ahead weather forecasts are widely available and
arise in forecasting during a pandemic:                               fairly accurate, there are no mobility forecasts (yet). Mobility
   1) New features: Are there other (easily accessible) features      data are often up to real-time observations, so we do a time
       that better represent the underlying shifts in social and      shift of the corresponding feature spaces to utilize all available
       behavioral patterns?                                           inputs at each time step. For instance, to do a day-ahead
   2) Small data: We only have months of data when the                forecast, we concatenate current day’s mobility data along with
       impact of COVID-19 has been evident and social patterns        day-ahead weather forecasts and other class variables as they
       continue to shift somewhat rapidly. How do we design           are all up to date information once the model is implemented.
       and train a good forecasting algorithm when there is              For the m-layer neural network, we parameterize each hidden
       relatively small amount of data?                               layer Yi , i = 1, . . . , m − 1 as a fully-connected layer:
   We find positive answers by introducing a mobility measure.                               Yi =σi (Wi Yi−1 + bi ) ,                        (2a)
Essentially, the forecast algorithm needs to incorporate features
                                                                                           L̂t+k =Wm Ym−1 + bm ;                            (2b)
that accurately describe how people are changing their behavior
in response to COVID-19 pandemic and social distancing                where Wi , bi are trainable weights and biases at layer i, and
policies. For instance, both the spatial and temporal load            σ applies elementwise to a vector. The nonlinear activation
patterns have changed once people started to work from home.          functions σi promote nonlinearity in the forecasting model and
In this paper, we find a structured and concise representation        common choices include ReLU and Sigmoid functions [26].
of mobility captures the strong correlation between load and          By collecting the actual load Lt+k , we use stochastic gradient
human behavior, and also serves as a valuable feature for             descent to minimize the mean absolute percentage error
subsequent model design. Moreover, with the ubiquitous                (MAPE) during the training process:
adoption of smartphones, estimates of mobility are updated
                                                                                                     1 X L̂t+k − Lt+k
                                                                                                        N
frequently and openly available from service providers such as
Google and Apple. Other data sources such as stay-at-home                               LM AP E =                     ,                          (3)
                                                                                                     N i=1   Lt+k
population, retail sector population and magnitude of night-time
light has been used, but they are more suitable for comparative       where N is the batch size for model updates. We show in
studies rather than features in a forecasting algorithm [24].         Section IV that the mobility-augmented input features help to
   Fig. 3 shows the load, mobility data and temperature for           achieve both smaller testing errors and better generalization in
the Boston metropolitan area from Feb 15th to April 15th,             comparison to conventional algorithms.
2020. In Fig. 3 (a), both the peak load and daily average                We note the model setup (2) and (3) are general formulations,
load have decreased over 25%, but this pattern is only weakly         which are flexible to the size of input mobility data, the model
correlated to increasing temperature (Fig. 3 (c)). In contrast,       layers (e.g., recurrent [25] or residual networks [22]), and
the load curves exhibits a synchronous decrease with two              the forecast objective (e.g., point forecasts or probabilistic
mobility indexes: the driving index from Apple [12] and transit       forecasts [27]).
index from Google [13]. This is an example of how mobility
measurements can be utilized to take the impacts of pandemic                 Single Task                         Multiple Tasks
into account to improve load forecasting during COVID-19.             Output                Output

                  III. F ORECASTING M ODEL                                                    Task
                                                                                             Specific
   In this section, we formally describe how we integrate                                     Layer
mobility as a socioeconomic feature vector into the forecasting
algorithm. We firstly present the architecture of proposed                        ...
                                                                      Hidden                 Weight
algorithm, followed by a practical implementation during               Layer                                           ...
                                                                                             Sharing
that achieves better performance and generalization by using                                  Layer
knowledge transfer between different forecasting tasks.

A. Mobility-Enabled Load Forecasts                                     Input                Input                                 ...
   As discussed in Sec. II-B, mobility data has the potential                                           Task 1       Task 2             Task T
to reflect the short-term socioeconomic trends, and we are
interested in designing models to flexibly integrate this auxiliary   Fig. 4. The forecast model architecture for normal forecast task (left) and
                                                                      our proposed model of multiple-task learning (right).
input. We adopt neural networks as the parameterized model
to represent fθ . Neural networks has achieved state-of-the-
art performances [7], [22], [25], and more importantly, they          B. Knowledge Transfer of Forecasting Tasks
provide a practical implementation pipeline. The queries of             With the incorporation of mobility features, the load forecast-
mobility data can be integrated into neural networks similar to       ing algorithm is expected to have a better handle on the impact
other features such as weather data. Specifically, we concatenate     of social distancing policies and individual behaviors. Yet
5
there are two challenges in using mobility for load forecasting sufficient to directly aggregate data from each region to train
during COVID-19 outbreaks. The first is that normal forecasting a single forecasting model, since there would be too much
models could use years-long training datasets, while there are averaging and the algorithm would perform poorly for almost
only limited electricity consumption and mobility observations all of the individual tasks. In contrast, the multi-task learning
since the onset of the pandemic (or the start of social distancing). framework is able to improve each single task’s performance,
The second is that mobility and load both dropped sharply as we show in the next section.
in the early stage of stay-at-home orders, but a practical
forecasting algorithm should also work when strict social IV. C ASE S TUDIES
distancing practices are relaxed. It is not obvious whether In this section, we conduct extensive simulations on the load
we would have enough diversity in the data. forecasting tasks to validate the proposed method can help
We propose to tackle two challenges with one model design, during the COVID-19 pandemic. In particular, we compare
namely, a multi-task learning framework [28]. This transfer the mobility and transfer learning enabled forecast model with
learning procedure is based on the intuition that for related benchmark models. We also provide a planning analysis by
tasks, features useful for one task might be useful for other ones. considering different social distancing scenarios.
In our context, consider training forecasting algorithms for two A. Dataset and Simulation Platforms
different cities. Normally, these algorithms are trained entirely 1) Mobility Data: We collect mobility data from Google
separately using different datasets. Instead, we explicitly treat COVID-19 Community Mobility Reports [13] and Apple Covid-
these tasks as related to construct the neural network. 19 Mobility Trends Reports [12]. Note that for most of case
We design the multi-task forecasting framework through studies considered in this work, these data starting from middle
feature sharing among several different load forecast tasks. of January, 2020 include periods both before and during the
Specifically, we co-train several neural networks collectively as stay-at-home restrictions due to COVID-19 pandemic.
illustrated in Fig. 4. For a set of forecasting tasks j = 1, . . . , P Google: The report includes 6 location-specific metrics: retail
(j)
with corresponding collected training datasets Dtr , the load & recreation, grocery & pharmacy, parks, transit stations,
forecasting models share the same weights of first l layers, workplaces, and residential. The baseline value is the median
while last l − m layers are mapping the embeddings Yl to during the 5-week period from January 3rd to February 6th,
(j)
distinct outputs L̂t+k . So we are constructing a neural network 2020. Google calculates these insights based on data from
of the following form: users who have opted-in to Location History for their Google
Account.
Yl =σl (Wl (σl−1 (· · · σ1 (W1 Y0 + b1 ) · · · )) + bl ), (4a) Apple: The mobility metrics include driving, walking and
(j) (j) (j) (j) (j) (j)
L̂t+k =Wm (σm−1 (· · · σl+1 (Wl+1 Yl + bl+1 ) · · · )) + b(j)
m . transit, and are a relative volume of directions requests by
(4b) mobile users per country/region, sub-region or city compared
to a baseline volume on January 13th, 2020.
To train the multi-task forecasting neural network (4), we 2) Electricity Demand Data: We collect and construct load
(j)
iteratively sample a batch of training samples from Dtr from datasets for various regions to evaluate the proposed load
each task j and update the weights for Wi , bi , i = 1, . . . , l and forecasting approach. Specifically, we use hourly electricity
(j) (j)
Wi , bi , i = l + 1, . . . , m. A final fine-tuning step is used consumption data for systems of different sizes: country-
to improve the model performance by only training on specific level data of European countries (United Kingdom, Germany
task j while fixing the trained weights Wi , i = 1, . . . , l. and France), ISO-level data (CAISO, NYISO), zonal data in
The setting of knowledge transfer is especially helpful to ERCOT (coastal, north central and south central areas) and
load forecasting during the COVID-19 pandemic, as mobility metropolitan-level data of US cities (Seattle, Chicago, Boston,
impacts electricity consumption in every region. However, the the Mid-Atlantic area). The European load data were collected
actual mobility patterns in each region is determined by a from ENTSO-E, while the US data are publicly available from
complex set of socioeconomic factors and can different widely. several ISO and participating utilities. All the collected datasets
This is a benefit to the forecasting algorithms, since we can are available along with our code repo for evaluation. We query
pool data from different regions to create a much larger and weather forecast API World Weather Online [29] and apply
more diverse training set. The regional differences in how much data normalization to pre-process each dataset. For larger load
electricity each end-use sector consumes and the varying effects regions such as CAISO and European countries, we concatenate
of COVID-19 mitigation efforts on the sectors are learned and several major cities’ weather and mobility data as the input
represented by the final task-independent layers. In addition, feature vectors.
since different countries and regions (states in the US) are We collect two training datasets to evaluate the proposed
in different stages of lifting the social distancing orders, the approach. The first dataset we consider excludes mobility
multi-task learning framework enables the knowledge transfer features, and it covers the time range between January 1st,
so that forecasting results can be accurate even when there is 2018 to May 15th, 2020. The second dataset makes use of
unseen training data for a particular location. available mobility data ranging from February 15th to May
The proposed data-driven knowledge transfer scheme enables 15th, 2020, which is a relatively small data for load forecasting.
efficient modeling and learning between different forecasting This range also spans the pre- and after-lockdown periods for
tasks, as there is no limitations on the number of tasks, neural most of the test cases, so it serves as a fair benchmark to
network architecture or training data size. Note that it is not evaluate proposed forecasting method.6
(a). Forecast Results
(b). Error Distribution
Fig. 5. Load forecast results on Seattle City Light dataset. By incorporating mobility data and using multi-task learning procedure, our model achieve lower
MAPE error on testing data, while the error distribution is more centered around 0 compared to normally constructed forecast models. The Mobi_MTL model
was collectively trained using data from Seattle, Boston, Chicago and Mid-Atlantic metro areas.
retrained when COVID-19 pandemic takes impact on electricity
loads. We train this model using data ranging from February
15th to April 30th, 2020.
Mobi: Using the techniques described in Sec.III-A, we include
the mobility feature vectors, and train this model using data
ranging from February 15th to April 30th, 2020.
Mobi_MTL: This model extends the Mobi model by using the
architecture described in Sec. III-B. We train four multi-task
learning neural networks based on a selection of similar tasks
with similar-sized load regions.
All four models are tested on the electricity load from May
1st to May 15th, 2020, and we report forecast MAPE calculated
by (3) on the testing dataset. As the underlying regions go
through different level of stay-at-home orders during the testing
period, we are interested in examining the model’s capabilities
to predict loads under different socioeconomic scenarios.
The simulation platform used in this paper is a laptop with
i5-8259U CPU @ 2.30 GHz. The environment used is Python
Fig. 6. Load forecast performance comparisons on testing samples from 3.6 with Tensorflow as machine learning package. To make a
different load regions. fair comparison, we construct load forecasting neural networks
with 5 layers for all tasks along with Dropout regularization,
3) Evaluation Methodology: The following forecasting and the first layer has the most number of neurons of 512. We
algorithms are used: construct Mobi_MTL by sharing the weights of first 3 layers
NN_Orig: This is a standard neural network for day-ahead across tasks. The dimension of the largest input feature vector
load forecasting trained on the data from January 1st, 2018 to in Mobi_MTL and Mobi for CAISO is 60. For all settings
December 31st, 2019 without mobility data. It acts as a proxy and models, we use 50 epochs for training. We also note that
for the actual forecasting model implemented in practice. for the Mobi_MTL model, even several models are trained
Retrain: Using the same model architectures as NN_Orig, together iteratively, the overall training time is less than 20%
this model simulates the case that model is updated and of training a single model on the whole dataset which is the7
Model Seattle Chicago Boston Mid- ERCOT ERCOT ERCOT NYISO CAISO UK Germany France
Atlantic Coast NCENT SCENT
NN_Orig 15.01 14.44 6.55 14.60 7.38 8.48 8.16 12.91 8.51 10.11 7.73 22.71
Retrain 7.55 17.92 15.26 17.27 7.17 9.60 7.73 15.55 7.77 13.78 7.77 8.31
Mobi 6.51 4.08 4.38 7.08 1.85 2.70 5.18 6.25 5.97 8.74 6.24 5.93
Mobi_MTL 2.28 2.33 2.91 2.61 1.80 1.59 2.71 5.24 3.15 4.46 4.52 4.1
TABLE I
S IMULATION RESULTS FOR DAY- AHEAD LOAD FORECASTS OF 12 REGIONS WITH 4 GROUPS OF MULTI - TASK LEARNING . M O B I _MTL IS ON AVERAGE 3.98
TIMES BETTER THAN BASELINE NN_O R I G MODEL IN TERMS OF MAPE ACROSS ALL TASK BENCHMARKS .
case of NN_Orig model. partly because such forecasting tasks only consider smaller
load regions, while cities exhibit similar shifts of commercial
B. Evaluation Results and residential load once stay-at-home orders were in effect.
1) Performance on Day-Ahead Load Forecasts: Forecasted In Fig. 6, we visualize the forecast results on various testing
values for the Seattle City Light service region along with the cases (one region from each group of multi-task learning) for
distribution of forecast errors are shown in Fig. 5 for two weeks’ both weekends and weekdays. It further validates that mobility-
data from May 2nd to May 15th (Seattle’s shelter-in-place enabled forecasting algorithm can capture the intrinsic interplay
order were in effect that this time). The multi-task learning between human activities and electricity consumption.
model is trained using training sets from Boston, Chicago and It is interesting to observe that both Retrain and Mobi
Mid-Atlantic areas. The Mobi and Mobi_MTL significantly model exhibit overfitting to the small training dataset, as the
outperform the other two methods as shown in Table I. It first testing week’s error is much smaller than the second
can be seen that by integrating mobility data, the trained week. This may challenge the practical implementation of such
neural network can better predict the electricity consumption algorithms, as the trained model can not generalize to the
behaviors during this period. The Mobi_MTL model achieves future instances. On the other hand, Mobi_MTL model outputs
the smallest forecast error, validating our conjecture that cross- accurate forecasts throughout the testing period.
task forecasting knowledge can be helpful when large training We also validate the model performance via the distribution
datasets are not available. of forecasts deviation compared to actual load. Without consid-
Table I compares MAPE on testing datasets are listed for ering the recent trends of mobility, NN_Orig and Retrain
various regions. Each sub-column represents a group of tasks model consistently predict greater load values compared to
for the multi-task learning setting, while other models are actual loads. On the contrary, the error distributions of Mobi
trained separately for each task. The baseline NN_Orig model and Mobi_MTL are more centered around 0, indicating that
results in errors of over 10% MAPE in many cases, much mobility features serve as significant inputs.
larger than the typical error of 2-4% before the pandemic. This 2) Projections on Reopening Scenarios: As the objective of
baseline model is more accurate on weekends than weekdays, research is to provide a fast response to the global pandemic
indicating that the main changes in load pattern are occurring and to prepare the grid for future load changes, we do a
during workdays. As expected, the original forecast model future projection analysis based on different mobility patterns
does not have any knowledge of such drastic socioeconomic by utilizing the proposed load forecasting methodology. The
changes with the outbreak of COVID-19. The Retrain model results are illustrated in Fig. 7 for possible load scenarios of
can partly redress the overcasting by NN_Orig, yet since the Seattle area in July 2020 and January 2021. We plot the two
training dataset for the pandemic period is relatively small, weeks’ load curves as representative cases for typical summer
while the mobility patterns are changing frequently during the and winter load.
testing period, such retraining process are still not satisfactory. According to Washington state’s four-phase reopening
Across all forecasting tasks, the inclusion of mobility data plan [30], the earliest expected date to enter Phase 4 (removal of
can boost the prediction accuracy. The resulting forecast results mandated social distancing orders) is July 13th, 2020. Of course,
during COVID-19 pandemic from our Mobi_MTL model are there are high degrees of uncertainty in both governmental
comparable to ISO’s published results before the pandemic. policies and behaviors of people. We analyze two possible
This shows that mobility data are effective proxies for social and future cases based on mobility data. The first case we consider
economic behaviors. Regional differences are also notable in is a recovery of 90% normal mobility. In the second case, we
the forecasting results. Forecasts on ERCOT regions achieve the assume there may be extended duration of pandemic impacts,
best performance, partly due to the fact that Texas has relatively and the mobility pattern stays at the current level. Both the
loose restrictions during April and May compared to other US normal mobility and current mobility are estimated using the
areas under investigation [1]. On the contrary, forecasting loads weekly average values. We concatenate such estimated mobility
for larger geographical regions (ISO level and country level) are features along with weather data from the same weeks in
generally harder than the smaller counterparts, as the mobility July 2019 and January 2020 to construct the input vectors
data and weather data we consider in the simulation do not for the Mobi_MTL model. The 95% confidence interval of
encompass every possible fine-grained regions. US metropolitan mobility data is calculated based on the Gaussian assumption
areas testing group sees the largest model improvement by of the estimated mobility indexes, while shaded areas in the
using multi-task learning model compared to other models, figure represent such mobility variations. The model output8
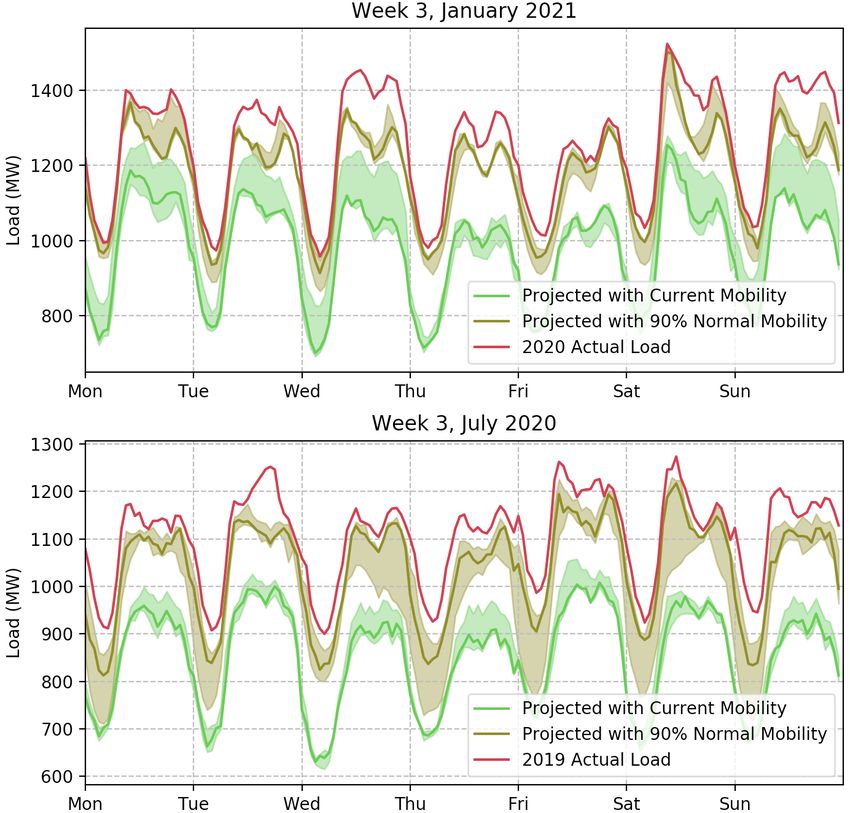
qualitatively shows the relationship between reduced mobility [4] IEA, “Covid-19 impact on electricity,” 2020. [Online]. Available:
and reduced load. We can see the decreases of mobility https://www.iea.org/reports/covid-19-impact-on-electricity
[5] I. N. E. O. Forecast, “Estimated impacts of covid-19 on iso new england
indexes poses more reductions of winter load, with a peak demand,” ISO Newswire, 2020.
load reduction of over 300M W if current mobility patterns [6] G. Gross and F. D. Galiana, “Short-term load forecasting,” Proceedings
persist. We hope by incorporating the projections of mobility, of the IEEE, vol. 75, no. 12, pp. 1558–1573, 1987.
[7] D. C. Park, M. El-Sharkawi, R. Marks, L. Atlas, and M. Damborg,
our proposed model can be served as a tool to inform electric “Electric load forecasting using an artificial neural network,” IEEE
grid operators about possible load realizations, and can help transactions on Power Systems, vol. 6, no. 2, pp. 442–449, 1991.
system planning in the reopening periods. [8] J.-B. Fiot and F. Dinuzzo, “Electricity demand forecasting by multi-task
learning,” IEEE Transactions on Smart Grid, vol. 9, no. 2, pp. 544–551,
2016.
[9] W. Grady, L. Groce, T. Huebner, Q. Lu, and M. Crawford, “Enhance-
ment, implementation, and performance of an adaptive short-term load
forecasting algorithm,” IEEE transactions on power systems, vol. 6, no. 4,
pp. 1404–1410, 1991.
[10] B. F. Hobbs, S. Jitprapaikulsarn, S. Konda, V. Chankong, K. A. Loparo,
and D. J. Maratukulam, “Analysis of the value for unit commitment of
improved load forecasts,” IEEE Transactions on Power Systems, vol. 14,
no. 4, pp. 1342–1348, 1999.
[11] T. Barker, A. Dagoumas, and J. Rubin, “The macroeconomic rebound
effect and the world economy,” Energy efficiency, vol. 2, no. 4, p. 411,
2009.
[12] Apple, Inc., “Mobility Data,” 2020. [Online]. Available: https:
//www.apple.com/covid19/mobility
[13] Google, Inc., “COVID-19 Community Mobility Reports,” 2020. [Online].
Available: https://www.google.com/covid19/mobility/
[14] C. Le Quéré, R. B. Jackson, M. W. Jones, A. J. Smith, S. Abernethy,
R. M. Andrew, A. J. De-Gol, D. R. Willis, Y. Shan, J. G. Canadell et al.,
“Temporary reduction in daily global co 2 emissions during the covid-19
forced confinement,” Nature Climate Change, pp. 1–7, 2020.
[15] L. Ecola and M. Wachs, “Exploring the relationship between travel
demand and economic growth,” The RAND Corporation, 2012.
[16] D. M. Studdert and M. A. Hall, “Disease control, civil liberties, and
mass testingcalibrating restrictions during the covid-19 pandemic,” New
England Journal of Medicine, 2020.
[17] I. Nakamoto, W. Zhuang, S. Wang, and Y. Guo, “On the heterogeneity
of infections, containment measures and the preliminary forecast of
Fig. 7. Load projections for January 2021 and July 2020 based on Seattle
covid-19 epidemic,” medRxiv, 2020.
weather profiles from the previous year considering scenarios of mobility
[18] S. J. Pan and Q. Yang, “A survey on transfer learning,” IEEE Transactions
patterns from Week 2, 2020 or from before pandemic dates. Shaded areas plot
on knowledge and data engineering, vol. 22, no. 10, pp. 1345–1359,
the load projections based on 95% confidence interval of the mobility data.
2009.
V. D ISCUSSION AND C ONCLUSION [19] H. K. Alfares and M. Nazeeruddin, “Electric load forecasting: literature
survey and classification of methods,” International journal of systems
In this paper, we developed a novel load forecasting method science, vol. 33, no. 1, pp. 23–34, 2002.
as a timely response to the challenges in load forecasting during [20] R. Weron, Modeling and forecasting electricity loads and prices: A
statistical approach. John Wiley & Sons, 2007, vol. 403.
the sudden and global COVID-19 pandemic. We discussed [21] T. Hong and S. Fan, “Probabilistic electric load forecasting: A tutorial
approaches to identify the load changes brought by fast- review,” International Journal of Forecasting, vol. 32, no. 3, pp. 914–938,
changing socioeconomic behaviors and stay-at-home orders. 2016.
[22] K. Chen, K. Chen, Q. Wang, Z. He, J. Hu, and J. He, “Short-term load
By explicitly incorporating mobility patterns, our approach can forecasting with deep residual networks,” IEEE Transactions on Smart
greatly reduce the error between forecasts and actual loads. Grid, vol. 10, no. 4, pp. 3943–3952, 2018.
We evaluated the proposed approach on load forecasting tasks [23] T. Hong, M. Gui, M. E. Baran, and H. L. Willis, “Modeling and
forecasting hourly electric load by multiple linear regression with
across a large set of heterogeneous regions globally, and the interactions,” in IEEE PES General Meeting. IEEE, 2010, pp. 1–8.
algorithm not only achieved 3.98 times smaller errors than [24] G. Ruan, D. Wu, X. Zheng, S. Sivaranjani, L. Xie, H. Zhong, and
standard forecasting methods, but also generalized well into C. Kang, “Tracking and analyzing the short-run impact of covid-19 on
the u.s. electricity sector,” 2020.
varying dates after the outbreak of COVID-19. As the global [25] J. Zheng, C. Xu, Z. Zhang, and X. Li, “Electric load forecasting in smart
pandemic may still pose impacts to the power grids in the future, grids using long-short-term-memory based recurrent neural network,”
we think techniques developed in the paper could inform grid in 2017 51st Annual Conference on Information Sciences and Systems
(CISS). IEEE, 2017, pp. 1–6.
operators possible future load patterns. [26] V. Nair and G. E. Hinton, “Rectified linear units improve restricted
R EFERENCES boltzmann machines,” in Proceedings of the 27th international conference
on machine learning (ICML-10), 2010, pp. 807–814.
[1] A. Paaso, S. Bahramirad, J. B. E. Bernabeu, B. Chiu, B. Enayati, [27] Y. Wang, N. Zhang, Y. Tan, T. Hong, D. S. Kirschen, and C. Kang,
B. Hederman, L. Jones, Y. Jun, H. Koch, J. C. Montero, N. Nair, “Combining probabilistic load forecasts,” IEEE Transactions on Smart
D. Novosel, T. Pierpoint, F. Rahmatian, J. R. Aguero, C. Root, D. Sharafi, Grid, vol. 10, no. 4, pp. 3664–3674, 2018.
E. Tejera, and V. Vittal, “Sharing knowledge on electrical energy [28] R. Caruana, “Multitask learning,” Machine learning, vol. 28, no. 1, pp.
industry’s first response to COVID-19,” 2020. 41–75, 1997.
[2] W. E. Forum, “COVID-19: America hasn’t used this little energy in [29] WorldWeatherOnline, “World weather online,” 2020. [Online]. Available:
16 years,” 2020. [Online]. Available: https://www.weforum.org/agenda/ http://www.worldweatheronline.com
2020/04/united-states-eneregy-electricity-power-coronavirus-covid19/ [30] S. of Washington Office of Governor, “Safe Start Washington: A
[3] NYISO, “COVID-19 and the Electric Grid: Load Shifts as New Yorkers Phased Approach to Recovery,” 2020. [Online]. Available: https:
Respond to Crisis,” 2020. [Online]. Available: https://www.nyiso.com/-/ //www.governor.wa.gov/sites/default/files/SafeStartWA 4May20.pdf
covid-19-and-the-electric-grid-load-shifts-as-new-yorkers-respond-to-crisisYou can also read