White paper: The Role of e-scooters - and Light Electric Vehicles in Decarbonizing Cities - E-Scooter and Cities decarbonization
←
→
Page content transcription
If your browser does not render page correctly, please read the page content below
White paper: The Role of e-scooters
                and Light Electric Vehicles
                   in Decarbonizing Cities

               Study report by Carbone 4 for Bird
                        September 2019

        Aurélien Schuller                  Maxime Aboukrat
aurelien.schuller@carbone4.com      maxime.aboukrat@carbone4.com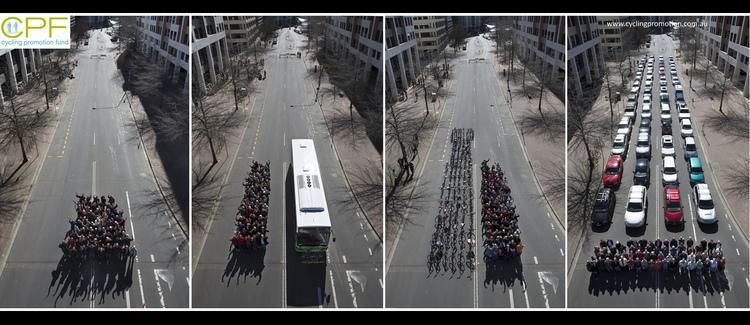
Table of contents

Executive Summary                                                                     3

Decarbonizing urban transport                                                         4

Long-term scenarios for sustainable mobility: what is the role of shared dockless micro-

modes, and what are the climate impacts?                                              8

Pre-conditions of sustainability for shared mobility solutions                       15

Conclusion                                                                           22

                                                                                       2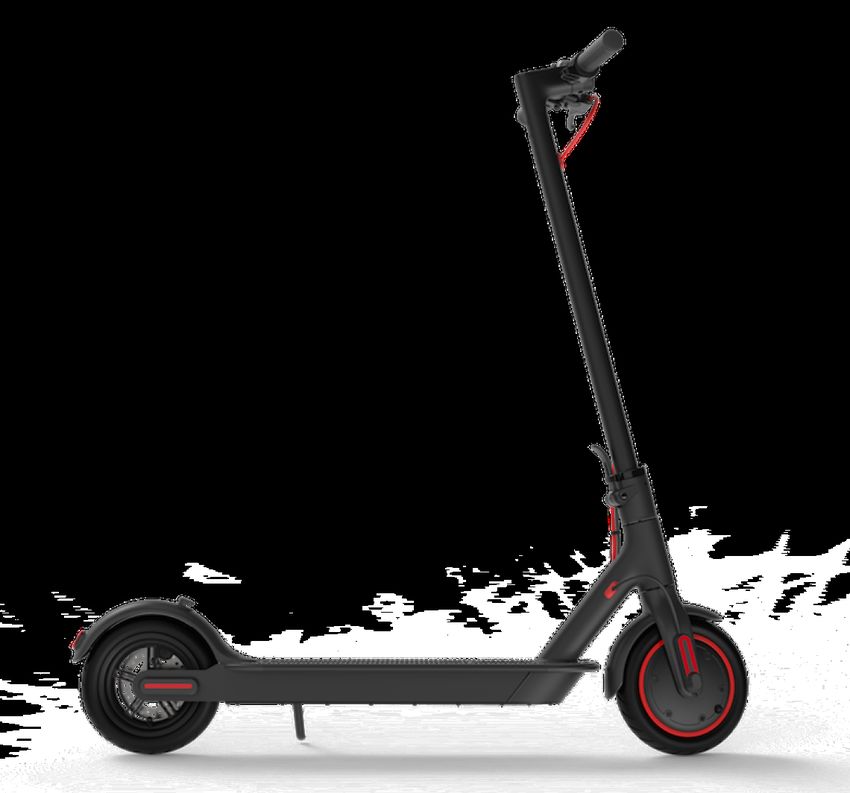
Executive Summary
This white paper examines the role that shared light electric vehicles (LEVs) such as e-scooters can play in
decarbonizing cities and presents a framework for the roles and responsibilities of operators and cities in
bringing about a low-carbon urban transport future. It finds the following:

   1. Dockless e-scooters show popularity as a lightweight and energy-efficient transport mode for quick
      urban trips, along with biking. Bicycle ridership has been increasing in cities across Europe, but
      dockless e-scooters are being adopted at a pace that has never been seen before: for instance,
      after less than one year in operation, e-scooters have reached a modal share of between 0.8 to 2.2%
      in Paris according to a recent study by the research consultancy 6t, that is twice as fast as the
      growth of the Velib’ system in the first year of operations.

   2. Light electric vehicles can help cities meet decarbonization goals. Based on the current mode split in
      Paris, Carbone 4 examined three exploratory scenarios to determine the potential for dockless LEVs,
      and e-scooters especially, to meet future mobility needs and mitigate carbon emissions in the long-
      term, around 2030. By this time, there would be significant energy efficiency gains for all transport
      modes that would lead to reduction of emissions from energy consumption of 40%, all other things
      being equal. However, higher mitigation potential could be reached with structural changes in the
      mobility system to reduce the use of cars, along with fostering alternate mobility solutions. The
      analysis found that biking and LEVs could feasibly account for around 21% of all trips in Paris,
      supporting an overall reduction of emissions from energy consumption of 68%.

   3. Long vehicle lifespan is critical to ensuring LEVs are sustainable on a lifecycle basis. Durability,
      maintenance, and vehicle retention in the fleet are the most important factors for long lifespan.
      Based on the data from the fleet Bird operates, the company has assessed that the consumer
      models lasted 3-4 months, while Bird’s current custom designed scooters would last 18 months.

   4. Trip replacement or “modeshift” away from cars is another essential condition for sustainability.
      Electric scooters are currently attracting riders from cars, public transport, walking, and biking, as well
      as providing mobility for trips that would not have otherwise been taken. To be compatible with the
      climate goals, LEVs must help to reduce car trips in an overall shift of urban mobility. For this to
      happen at scale, the vehicle must be attractive for former car users, and the streets they operate on
      must have bikelanes that offer safe and convenient places to ride.

   5. Cities focused on sustainability should select companies with vehicles that last at least one year and
      provide quality service to riders. We provide several recommendations for operators and cities to
      ensure vehicle longevity of at least one year, and maximal modeshift from cars. For example, on
      longevity, companies should monitor carbon emissions throughout a vehicle’s lifecycle and adopt
      plans to reduce impacts, and cities should implement anti-vandalism policies. To maximize
      modeshift, companies should continue improving convenience and user experience, and pricing
      should be competitive with other modes.

   6. Cities should also invest in infrastructure and adopt policies that support the modeshift from cars to
      light mobility. Cities and companies must work hand in hand to organize and optimize new forms of
      micro-mobility, for example, working together to allow for connection to transit. Cities must also invest
      in bike lanes, which support greater transition to micromodes and thus, a reduction in carbon
      emissions.

                                                                                                               3
Decarbonizing urban transport
1. Facing climate change, air quality, and urban congestion challenges, urban mobility
must shift toward more efficient forms of transport
To address climate change, air quality, and urban congestion, cities and states around the world are
advancing initiatives to reduce car usage. This has been pursued through committing to a target year for
banning fossil-fuel vehicles. In Europe, several national bans have been announced including in Norway (by
2025); Ireland, Denmark, the Netherlands and Sweden (by 2030); and France (by 2040). In addition,
municipalities such as Amsterdam, London, Milan, and Paris have adopted plans to prohibit or limit the use
of fossil-fuel cars in parts of their cities. For example, London is implementing its Ultra Low Emission Zone (ULEZ)
program, which results in drivers paying an extra charge to drive in certain neighborhoods throughout the
city, if the car does not meet the emissions standards of this scheme.
Paris has taken several steps to reduce car dominance and move people to more sustainable modes. The
Paris Climate Plan sets a goal of prohibiting the use of diesel and gasoline fueled cars in city limits by 2024
and 2030, respectively. To compensate and support this reduction in car traffic, Paris intends to promote
active and low carbon mobility by extending the bikeway network to make Paris 100% cyclable by 2020 and
limiting traffic speed to 30 km/h on all roads (except for major arterials). In addition, the city is taking steps to
support multimodal trips, including establishing an all-in-one mobility card that merges buses, metros,
tramways, RER (commuter train), Velib’ and Autolib’ (shared station-based bikes and cars). Further, the City
is implementing “Paris Respire” (Paris is breathing), enforcing car free zones in every district, each Sunday
and on Public Holidays.
Public space used for cars can be put to better use. Surface space is highly valuable in dense cities, yet
roughly ¾ of public streets are dedicated to car movement and personal car storage when car trips only
represent 14% of trips. This prioritizes the needs of the least efficient mode and leaves other mobility solutions
to fight for slivers of remaining public spaces. This issue is particularly acute in Paris, the densest European
capital, with around 20,000 inhabitants per square kilometer.
Mass and space per person for cars, buses, e-scooters and bikes1
1,000 kg & 8 m2 430 kg & 1.4 m2 15 kg & 0.8 m2 10 kg & 1 m2
per person per person per person per person
Indeed, cars are highly inefficient and unnecessary for most urban trips. Cars are best designed for long-
range trips, at high speed, or where it is necessary to carry heavy loads or multiple people. Cars have an
optimum energy yield at 70 to 90 km/hour and are not appropriately sized for most of urban mobility needs:
the engine capacity needed to propel a 2-ton vehicle carrying only one passenger weighing 80 kg and
travelling at a speed of less than 30 km/hour is extremely wasteful.
1 Source, for car, bus and bike: based on data collected and analyzed by Nicolas Meilhan, energy and transport
expert.
4Space needed to move 69 people using public transports, bicycles and cars2
As shown in the figure below, cars produce twice as much CO2e as buses or motorcycles. In Paris, road
traffic (including cars, vans and heavy-duty vehicles) is responsible for 60% of NOx emissions, 50% of
particulate matter, and 30% of greenhouse gases emissions. In addition, road traffic, and especially the
internal combustion engines, is a main source of noise pollution.
Greenhouse gases emissions from energy consumption for different transport modes in French cities
gCO2e per passenger and per km
~210 gCO2e
~110 gCO2e
~100 gCO2e
~5 gCO2e ~1 gCO2e
If using a thermal engine: Subway e-scooters
Car Bus Motorcycles Tramway e-bikes
and the like
Sources: Carbone 4 analysis based on data from ADEME, IFPEN, and energy consumption estimations for e-scooters and e-bikes.
On a per passenger basis, lightweight electric vehicles allow to drastically reduce greenhouse gases emissions
from energy consumption.
Caveat: only emissions from energy consumption are shown on this chart. Emissions on a lifecycle basis might differ, due
to the manufacturing of the vehicle itself, and of its battery in the case of electric vehicles.
Electric and light vehicle solutions such as e-scooters and e-bikes are well aligned with the political
ambition to provide mobility without harmful emissions. These modes are extremely lightweight, requiring less
energy to move, and highly efficient, since the yields of electric motors are much better than internal
2 Source: https://www.cyclingpromotion.org/
5combustion engines. There are no tailpipe emissions, and France’s low carbon grid supplies the energy. As
with electric vehicles, there may be some emissions from wear of tires, road friction, and brakes, but these
too are minimal. Thus, shared light electric vehicles offer an ideal solution for supporting cities to
decarbonize.
2. Investment in bike infrastructure has increased cycling in European cities, and helped
set the stage for LEVs
Over the past decade, biking has become a more popular mobility option in Europe, spurred by effective
policies and infrastructure investments. Amsterdam and Copenhagen in particular have steadily increased
cycling rates across all ages and demographics and in all seasons. Copenhagen achieved a bicycle mode
share of 29% through investment in high quality bikeway networks, the pillar of the development of any
sustainable transport policy. For the case of Amsterdam, which has bicycle mode share of 27%, investment
in traffic calming and cycling infrastructure was driven through political protest over road safety that began
in the early 1970s, with particular concerns over children.
More recently, cities have shown how to rapidly increase cycling with investment in connected and
protected cycle networks. The case of Seville, Spain is particularly impressive, where 80 kilometers of
bikeways were built in only 18 months, resulting in biking mode share increasing from 5% in 2007 to 9% in
20113. In France, the number of bike trips doubled between 2001 and 2010 according to the National Study
on Transport (EGT) and French cities are among the most bicycle-friendly in Europe, with Strasbourg,
Bordeaux and Paris being ranked 5th, 6th and 8th in the “Copenhagenize Index 2019”4.
Because of their popularity, bicycles factor heavily in European decarbonization strategies. For instance,
Copenhagen’s ambition is to increase the mode share of bikes to 38% by 2025 and the Paris Climate Plan
aims to triple mode share up to 15% by 2030. Electric scooters and e-bikes have fit seamlessly into this
movement, while diversifying mobility options. The speed and weight of the e-scooters allows them to ride in
the same lanes as bikes, and the ride experience is quite similar to cycling.
3. Shared, dockless LEVs expand mobility options, and attract even more riders to two
wheels
Urban mobility has diversified in recent years with the arrival of new shared mobility services, such as e-
scooters. First appearing in the United States, these self-service, dockless modes (commonly known as free-
floating) have multiplied across France since the arrival of the first operators in Paris in the summer of 2018.
E-scooters and other shared LEV solutions are popular, and enjoyed for their convenience. Users of free-
floating e-scooter and non-electric bike services in France are depicted in two recent studies by the
research consultancy 6t5. The studies found average user age is 36 years old, and the users chose e-scooters
because of the enjoyment of this mode, the time savings they allow, and the convenience provided by a
door-to-door trip. Convenience is increased thanks to the ubiquity of the smartphone, and increased
familiarity of accessing services with it. Further, the flexibility provided by dockless seems to contribute to
uptake: for instance dock-based bikeshare has largely been replaced by dockless forms in North American
cities.
Shared e-scooters and other LEVs could play an important role in the future low-carbon mobility landscape
in Europe. E-scooters have been rapidly adopted in the mobility landscape: with cautious assumptions, 6t
3 Available at https://www.witpress.com/Secure/elibrary/papers/SC14/SC14065FU1.pdf.
4 The "Copenhagenize Index” is, according to the company that releases it, “the most comprehensive and holistic
ranking of bicycle-friendly cities on planet earth”. It is produced by Copenhagenize Design Co., an urban design
consultancy based in Copenhagen, Brussels and Montréal.
5 Available at https://6-t.co/trottinettes-freefloating/ and https://6-t.co/etude-ademe-vff/
6found that e-scooters have reached a modal share of between 0.8 to 2.2% in Paris after less than one year in
operation, twice as fast as the Velib’ system6.
After 9 months of service, weekly trips from e-scooters are 1.3 to 3 times larger than for Velib’ after the same
period, based on assumptions and data derived from the 6t study. Possible reasons for the rapid growth
might include that users prefer the mode (preference for electric motor and/or prefer the comfort of a
scooter), increased comfort with mobility-as-a-service solutions, improvements in user experience, and
preference for the flexibility of dockless since users can use a smartphone to locate available scooters and
leave them in a convenient location after use, without having to search for an empty Velib’ dock.
A continuation of uptake of e-scooters and light electric vehicles is expected due to several factors:
● Improvements to the service: technology advancements including GPS and in-app features will
continue to improve the rider experience.
● Improvements to the vehicles: as vehicle design improves, the ride becomes more comfortable and
enjoyable. Introduction of new vehicle types is also expected; it will make them accessible to a
wider range of ages and abilities.
● Investments in safe infrastructure: as the case of bicycle modeshift has shown, investment in
connected and protected cycle infrastructure will increase ridership.
● Increasing intermodality: e-scooters can be further integrated in the mobility landscape since small
electric modes could allow designing highly efficient feeder traffic to connect to mass transit. It is
worth noting that at the moment in Paris 23% of e-scooter trips are already intermodal (of these, 66%
are connecting to mass transit, and 19 % to walking).
● Changes in weather brought by climate change: On a somewhat different note, one can observe
that heat waves, which are expected to be more and more frequent in Paris, can also contribute to
the development of these new mobility forms, as they are more adapted than public transport.
Travelling in the open air directly from point to point can provide a more comfortable experience for
riders than other modes in such circumstances.
6It is worth noting that for this mode share only residents are considered. Shared light electric vehicles are also being
commonly enjoyed by tourists to the city: there are 58% residents, and then 42% tourists, among which 33% from abroad
and 9% from France.
7Long-term scenarios for sustainable mobility: what is the role of
shared dockless micro-modes, and what are the climate impacts?
It is likely that an increasing portion of car trips will be replaced by dockless LEV mobility, since they provide a
convenient option for riders and align with emerging environmental regulations to address air quality,
greenhouse gases, noise pollution, and congestion. But what proportion of car and other existing modes are
likely to be replaced by dockless LEV mobility, and what will be the environmental impact?
Let us have a look first at current mobility in Paris. For the purpose of this scenario analysis, the scope is
limited to trips that occur within the borders of the city (i.e., going from a location in Paris to another one
within the city limits) and trips that connect to Paris (i.e., trips that begin or end in Paris). Transit trips are not
taken into account in the scope of this study: crossing Paris in a single trip to go from a suburban area to
another by car or heavy rail is not addressable by light mobility solutions. In addition, data for non-resident
transport is lacking, so the focus will be on daily trips for residents of the Paris area (Île-de-France region).
Current modesplit in Paris
For a customary weekday, and only for mobility of residents in the Paris area
5 million trips 5 million trips
for a usual weekday
Mobility
from or to
Paris
Mainly bikes at the
1.7 million trips moment, but fast
development of
Mobility new lightweight
inside Paris electric vehicles
500k trips
~130k trips
Public transport Walking Car Motorcycles Others
and the like
Sources: Carbone 4 analysis based on data from “Plan Climat“ 2018 of Paris, “Observatoire des déplacements à Paris” 2016 and
2017, and “Enquête globale transport en Île-de-France”, 2010.
There are ~8 million trips daily in Paris, and 4.3 from or to Paris, mainly made by public transport and walking
that constitute nearly 80% of all trips. Car represent ~14% of all trips.
Presently, the modal share of walking is 40% of all trips within the bounds of the study. This modal share is
similar to that of public transport, with the combination of incoming / outgoing trips and internal trips. Cars
have a modal share of around 14%, but if transit trips were to be taken into account, there would be at least
two times more trips: for each car trip within the bounds of the study, there are two other car trips inside
Paris, but these trips cross Paris to go from suburb to suburb. The proportion of biking and shared dockless
micro-modes are currently very small, representing around 1% of daily trips, or around 130,000 trips daily. But
this portion is rapidly increasing and shows promise for development.
8To determine the climate potential for dockless mobility, and especially e-scooters, it is valuable to examine
what mobility needs it is currently addressing. In the 6t study, we find that the primary trip type is commuting
to and from work, other professional errands, and leisure-related trips. Trips last on average 19 minutes, and
travel a distance of 4.6 km. This average hides a wide heterogeneity since the median duration is 11 min for
a distance of 2.75 km. To date, e-scooters substitute public transport, walking, and car trips, but also include
trips that would have not otherwise been taken.
Given the pace of uptake, in the long-term, as service and availability improve, restrictions are placed on
car use, and investment is made in bike lane infrastructure, we should expect that e-scooters will
increasingly link to transit modes, and that they will substitute for additional car trips. Current studies cannot
be seen as indicative of what would happen in the long term since the sector is rapidly evolving. Individual
transport decisions are made based on convenience and price, and the changes described above will
create an environment that is increasingly supportive to shared LEV.
The table below summarizes the trend, and influential factors of existing mobility in Paris, and considers the
potential for modeshift towards dockless mobility (either e-scooters or e-bikes), on the basis of the demand it
can address.
Current Average Main growth Modeshift potentials
modal share trip length outlook Influential factors towards dockless mobility
Restrictive policies /
aligned with political
Car 14% 6 km Large modeshift: passengers might
ambition to reduce car turn to light electric vehicles for
modal share short trips, and public transport for
longer trips
Alternate options may /
Public transport 41% 9 km ~ replace some public
transport for short trips
Medium modeshift: public transport,
especially the subway, will remain
an efficient and cost-effective way
to travel fast
Incentives and better /
Walking 40% 400 m ~ urban conditions for
walking
Small modeshift: e-scooters and
e-bikes might substitute to long
walking trips
Growing demand and
e-scooters
< 1% 2 - 5 km favorable regulatory n.a.
e-bikes
framework
Sources: Carbone 4 analysis based on data from “Plan Climat“ 2018 of Paris, “Observatoire des déplacements à Paris” 2016 and
2017, and “Enquête globale transport en Île-de-France”, 2010.
To assess modeshift potential, this analysis considered the range of current trips that e-scooters and e-bikes
are likely to capture, setting a feasible range of trips that are longer than 1 km but shorter than 15 km. For
each transport mode the distribution is calculated in five different range segments as shown in the chart
below. Each one of these segments corresponds to a maximum technical potential for LEVs in terms of
modeshift. The average maximum technical potential is calculated by the combination between range
distribution and maximum technical potentials per range segment.
9Distribution of ranges per transport mode in the current mobility in the Paris region
For a customary weekday, and only for mobility of residents in the Paris area
Cars Public transport Walking Motocycles Biking
91%
51%
43%42% 43%
40%
24% 23%
21%
17% 18%
13% 12% 11%
8% 8% 10% 10%
4% 6%
1% 1%
Less than Less than Less than Less than More than
1 km 5 km 10 km 15 km 15 km
Sources: Carbone 4 analysis based on data from “Enquête globale transport en Île-de-France”, 2010.
Corresponding maximum technical potential for light electric vehicles:
Sources: assumptions by Carbone 4.
Light electric vehicles are likely to attract short range trips, until a range of 15 km. Technical modeshift capacity
is set for each different range intervals, in order to assess the overall modeshift potential based on distance.
For instance the technical modeshift potential is 75% for trips that range from 1 to 5 km.
The methodology takes into account that not all trips for a given mode could be converted to e-scooters or
e-bikes due to trip type factors affecting modal choice. These factors include cost of the transport mode,
reason for the trip, need to carry heavy goods or transport children to school or other activities, as well as the
personal preference for a given mode. For all these reasons, modeshift potential shown in the table above
are derived from maximum technical potential after applying a discount factor capturing socio-economic
effects in a simplistic way: a discount of 20% when there is a high likeliness to meet the technical potential
(for instance for the modeshift from cars), a discount of 50% for a medium effect (for public transport), and a
discount of 80% when there are important socio-economic barriers (for instance for walking when the time
savings are not worth the price from the perspective of the walker).
With no surprise, walking is concentrated on very short trips, with around 70% of trips under the range of
500 m, and 90% under 1 km. On trips of less than 500 m, e-scooters or e-bikes have a low technical potential
since the trips might be more convenient and faster on foot. But for longer trips that are walked today, the
potential is more substantial, especially for trips around 1 km. Therefore, the maximum technical potential for
modeshift is around 50% of total walking trips. But since the willingness to pay might not be enough for the
low time savings, the actual potential taken into account is a modeshift of 7 to 10% of total walking trips.
Public transport trips have a higher average trip length, and therefore potential modeshift is limited. In
addition, the fare for buses or subways are inexpensive (for the end-user since public transport is subsidized
10by local authorities and employers’ contribution), and a lot of people already have the annual or monthly
subscription. The actual modeshift taken into account vary from 20% to 25%.
Cars trips are surprisingly short, and potential modeshift is therefore higher, from 30% to 40% in the long term.
This corresponds to a large portion of car trips that are less than 5 km.
This information informed modeling of three long-term scenarios to explore plausible futures for Paris mobility
in 2030.
Current and projected modal share of mobility in Paris or in connection with Paris
Motorcycles
& biking 1%
4% 10%
15% Biking &
4% 21% Light Electric
4% Vehicles
Walking 40% 4% Motorcycles
38%
38%
38% Walking
Public transport 41%
34%
33%
32% Public transport
Cars 14% 14% 10%
5% Cars
Today Long-term perspectives, around 2030
situation Low uptake Medium High
of lightweight uptake uptake
electric vehicles
Sources: Carbone 4 analysis and assumptions based on data from “Plan Climat“ 2018 of Paris, “Observatoire des déplacements à
Paris” 2016 and 2017, and “Enquête globale transport en Île-de-France”, 2010.
The low, medium, and high scenarios vary based on quality of light electric vehicle service, successful
implementation of policies that restrict cars, and quality of bike lane infrastructure.
● Low uptake assumes a rather constant share of cars, with no additional efforts in limiting the
environmental impacts of road traffic. In this scenario, the uptake of electrified light vehicles is
driven by the growing demand for these emerging mobility solutions that substitute partially with
public transport and walking, with the lower end of the potential modeshift: almost 20% for public
transport, and 5% for walking;
● Medium uptake assumes high quality of service and policies and infrastructure investments take
place to promote lightweight and electrified forms of mobility while restricting use of cars. In this
scenario, car trips are primarily replaced by LEVs;
● High uptake assumes high quality of service and highest ambition among the three scenarios for
limiting car traffic, with coordinated policies and investments to fundamentally change the mobility
landscape of the city. The higher end of potential modeshift is used, combined with waterfall effects
from the reduction of the car modal share. For example, public transport replaces long car trips, but
connectivity is improved with LEVs and modeshift towards light vehicles is stronger. As a whole the
modal share of public transport decreases from 41% currently to 32% in the high uptake scenario.
11To assess the potential greenhouse gases emissions under each scenario, Carbone 4 derived the carbon
intensity of mobility in the present situation and for future mobility among the scenarios. As stated above in
this report, the scope for greenhouse gases emissions covers emissions from energy production and use (and
not greenhouse gases emissions on a lifecycle basis), and additionally the mobility in scope only covers daily
trips from residents of the Paris region, for trips within Paris or trips ingoing / outgoing Paris. Transit trips, trips on
weekends or trips of tourists are not taken into account under this approach. There is a rather high
confidence, however, that the results (proportion of reduction of carbon emission per km) would be similar if
the scope in terms of mobility were broader.
Current and prospective greenhouse gases emissions from energy consumption
for different transport modes in French cities
gCO2e per passenger and per km
Current Prospective, around 2030
-40%
210
-40%
130 -60%
110
100
70
40 -20%
Very low
5 4 carbon
intensity
Car Bus Motorcycles Subway e-scooters
and the like Tramway e-bikes
Sources, for prospective values: Carbone 4 analysis and assumptions based on the French “Stratégie Nationale Bas Carbone”.
In the long run, carbon intensity of all modes are likely to significantly decrease in scenarios with high climate
ambition, especially for vehicles that are not currently electrified and that can therefore benefit from the low-
carbon electricity in France.
Prospective emission factors for each transport mode were estimated based on policy targets for the
transport sector and electricity sectors in France. Due to increasingly stringent requirements, carbon intensity
of energy consumption is likely to decrease for all vehicle types due to energy efficiency improvements,
reduced carbon content per energy vector (e.g., renewable vs. fossil fuel electricity), and conversion of
road vehicles towards alternate energies such as electricity, biogas, or hydrogen.
12By combining emission factors for transport modes with the modal mix of mobility, and with the assumption
of a stable volume of trips, Carbone 4 estimated the carbon intensity both for the status quo and the
prospective scenarios, as shown below.
Current and prospective greenhouse gases emissions from energy consumption of mobility
for different uptakes of lightweight electric vehicles in the future
gCO2e per passenger and per km | For mobility in Paris or in connection with Paris
44 gCO2e
Motorcycles 4 -42% -53% -68%
Public transport 11
25 gCO2e
2
20 gCO2e
6
2
14 gCO2e Light Electric
6 Vehicles
Cars 29
2 Motorcycles
18 6 Public transport
13
6 Cars
Today Long-term perspectives, around 2030
situation Low uptake Medium High
of lightweight uptake uptake
electric vehicles
Sources: Carbone 4 analysis and assumptions.
In all scenarios the emissions from energy consumption are significantly lower than today, with a decrease in
a range of 40% to 70%. The scenario with low uptake of LEVs reflects the mitigation potential derived from
energy efficiency gains in all transport modes, with little structural change in the mobility mix. Structural
effects allow higher emission reductions. The lower the modal share of cars, the lower the greenhouse gases
emissions of the scenario. Even though it has not been assessed in quantitative terms, air quality in the long-
term scenarios would also be much better, especially in the case with a high share of electrified light
vehicles: the decrease of greenhouse gases emissions is likely to be at the lower end of the reduction in
local pollutants emissions. There is also the potential for light electric vehicles to substitute from motorcycles,
though this has not been explicitly modeled.
The key message here is valid for sustainable mobility projections in any high-density city: a range of low-
carbon intensity modes can collectively displace cars while maintaining access to mobility. Car trips within
the cities and ingoing or outgoing cities must be transferred to lighter forms of mobility. The case of transit
trips by cars must be handled with caution, since the modeshift potentials are much smaller due to the
longer trips and the high-speed necessity for this type of mobility.
The results of the scenarios are well aligned with the political ambition of Paris in terms of CO2 emissions,
especially the scenarios with medium or high uptake of LEVs. Paris has pledged to reduce Intramuros
13emissions (inside Paris) by a factor of two for all sectors from 2004 to 2030 in its climate neutrality roadmap7.
Since transport accounts for a quarter of Intramuros emissions of Paris, it is critical to have more than a 50%
decrease of emissions from this sector. In particular, in the original study8 that the climate neutrality roadmap
of Paris is based on, the greenhouse gases emissions from short-distance mobility decrease by 2/3 from 2015
to 2030. This reduction agrees with the level of reduction that is achieved in the high LEV uptake scenario
modeled here.
7“Plan climat de Paris”, Mairie de Paris, May 2018.
8“Paris change d'ère | Vers la neutralité carbone en 2050”, study by Elioth, Egis Conseil Bâtiments, Quattrolibri and
Mana, Nov. 2016.
14Pre-conditions of sustainability for shared mobility solutions
As seen in the previous section, ensuring a high level of shared LEV uptake by shifting people out of cars
supports Paris’ climate neutrality goal, while also improving air quality, reducing noise pollution and
alleviating congestion. Beyond tailpipe emissions, peripheral questions have been raised about lifecycle
impact, vehicle durability, and the importance of street design in supporting convenience and safety that
will support car trip replacement. In order to maximize modeshift and ensure sustainability of LEV options,
these vehicles must:
1. Shared mobility solutions must have a low carbon footprint
2. Shared mobility must replace car trips
Both cities and mobility companies have a role to play in realizing a low-carbon transport future. This section
outlines the characteristics, roles, and responsibilities for achieving it.
What must be achieved for shared
mobility solutions to be sustainable?
They must have They must be convenient,
a low carbon footprint safe, and comfortable
in a lifecycle perspective for consumers to use
i.e. vehicles need to last in order to replace car trips
Both the cities and Cities are primarily
Companies are companies are responsible for
responsible for responsible for better availability: allowing
retention of the integration in the scooters to be in the
vehicles in the fleet mobility landscape, city, with appropriate
and durability of with enhanced regulations and
vehicles and parts multimodality for infrastructure
instance investments
151. Shared mobility solutions must have a low carbon footprint, when considering a lifecycle
perspective
In order to decarbonize the transport sector, shared LEVs must have low lifecycle emissions. Full accounting
of sustainability impact requires comparing modes based on environmental impact throughout the lifecycle
of the vehicle, including manufacture, shipping, use, and end-of-life. In the transportation sector, emissions
associated with manufacturing and use of a vehicle are the most important factors for comparison. End-of-
life of the vehicle is less important for assessing the carbon footprint, but should be considered for other
environmental reasons.
According to initial analyses, for shared e-scooters and e-bikes, the largest emissions are in the
manufacturing phase. In the use phase, emissions come from energy consumption, charging, and
maintenance processes. The carbon footprint of the use phase is low given the energy efficiency of the
vehicles and the low-carbon content of electricity in France. There may be some impact associated with
charging and rebalancing, but this can be mitigated through the use of low-to-zero emission vehicles and
other improvements in operational efficiency.
This means that the most important factor for ensuring a low-emissions profile is to achieve a long lifespan of
the vehicle. The importance of lifespan has been stressed recently in the media, based on research of early
model vehicles, which estimates lifespan of one to three months, a figure that has been disputed by e-
scooter providers.
The “28 day study”:
An article on free-floating e-scooters published in Quartz in February 2019 reported an average vehicle
lifespan of 28 days, which would lead to profitability challenges and a high environmental impact.
According to Bird, this information is erroneous: the analysis was based on data that tracked average
number of days scooters are in service in a given location, not the number of days that a scooter is
operational. The analysis did not account for scooters that may be moved to different markets,
hibernated to meet fleet cap requirements set by cities, or otherwise taken off the streets due to
weather, ride demand, and vehicle maintenance needs. Bird’s analysis suggests that lifespan for
consumer models in the field on those dates was closer to 3-4 months, and that lifespan for proprietary
models such as the Bird Zero is significantly higher than that.
The environmental impacts related to the production of a vehicle are amortized through its utilization
lifespan. The longevity of a shared mobility solution is thus especially important, since the pooling of
utilization, with less vehicles needed for a given use, allows for a major amortization of the production. But
there is an opposite effect due to the harsh operating conditions that can accelerate vehicle attrition and
thus fleet turnover. Shared micro-modes face pressures of frequent use, exposure to the external elements,
theft, and occasional tampering. To ensure a long lifespan, e-scooter operators must have sufficient
sophistication to achieve two things:
• Retain the vehicles in the fleet, and protect them from theft, tampering, and other losses
• Ensure durability and maintenance of the vehicle, and that it is designed to withstand frequent use
We estimate that vehicles must last at least 12 months to achieve a substantially low carbon intensity of the
manufacturing phase. Indeed, the carbon footprint of manufacturing is likely to be around a hundred
kilograms of CO2e, and the annual mileage is likely to be 3,000 to 5,000 kilometers. Based on Carbone4’s
expert judgement, scooter manufacturing emissions must be an order of magnitude lower than a typical
car’s carbon footprint (around 200 gCO2e / km for the use phase only) to be a low carbon intensity in the
16manufacturing phase. Thus, scooters must last at least 12 months to have manufacturing emissions around
20 to 30 gCO2e / km.
Proprietary designs fare much better than consumer models in terms of retention and durability. Consumer
models are unfit for frequent use, and companies who have invested in R&D are seeing significantly longer
lifespans than these early models. For instance, the very first vehicles Bird put in service, consumer models
such as the M365, were targets for theft as they were capable of being hacked or sold for parts: as a result
50% of the fleet would be lost in less than 4 months as shown in the figure below. Internally developed
vehicles, such as the Bird Zero, have been designed to prevent theft and have a much higher retention rate:
after 5 months, more than 75% of the fleet is retained. This retention, if trends were to last, would lead to an
average lifespan of approximately 1.5 years according to Bird, which would be adequate in terms of
longevity for e-scooters, in order to provide a low carbon intensity of the manufacturing phase.
Fleet retention: internally developed vehicles vs. consumer models
% of fleet retained after deployment | 2019 cohort
Consumer model M365 Consumer model ES Bird Zero
100%
80%
60%
40%
20%
0%
M+1 M+2 M+3 M+4 M+5 M+6 M+7 M+8 M+9 M+10 M+11
Sources: data from Bird.
Global Bird Zero fleet retention is greatly higher than retention for consumer models:
after 5 months for instance, ~75% of the Bird Zero fleet is retained, against ~30% for consumer models.
New models, such as Bird One, are expected to last even longer.
Thus, innovation around custom designs and regular maintenance, along with appropriate retention
processes, increase lifespan and significantly lower the climate impact of this mobility solution. To that
extent, the Bird Two model has just unveiled in August 2019, featuring hardware innovations for a better
durability and retention of vehicles, such as a longer-lasting battery, self-reporting damage sensors, anti-
tipping kickstand, anti-theft encryption, puncture-proof tires, absence of exposed screws. Practical
examples of these best practices are detailed in the Bird case study below.
17Consumer model M365 (left) compared to Bird Two model (right)
Cities also have a role to play in supporting long lifespan and sustainability of shared LEVs. Cities should
require operators to have durable vehicles and a sustainability strategy to reduce lifecycle emissions. Cities
should also allocate appropriate street space, including parking spaces and bike lanes, as well as
implement anti-vandalism policies.
To summarize, the following actions can be undertaken to improve lifecycle sustainability:
Stakeholder Sustainability recommendations
Monitor the carbon footprint in a lifecycle perspective:
q Manufacturing of vehicles
q Manufacturing of spare parts
q Processes of maintenance and operational logistic
(deployments, picking for charging or servicing, on-site maintenance)
Companies
Improve the products and processes:
q Continue design progresses on longevity of vehicles and components
q Keep on optimizing processes for even longer lifespan and higher retention
q Optimize reuse and recycling programs
q Require sustainability plans from operators
q Coordinate deployments with operators to avoid vandalism due to particular events
(strikes, sport events)
Cities
q Create dedicated parking spots to avoid friction with pedestrians and other mobility
solutions
q Implement anti-vandal policies
q Require fleet average lifespan of 1 year
18Extending vehicle and fleet lifespan: Bird case study
Scooters need to withstand frequent use, occasionally harsh weather conditions, and prevent tampering.
Bird, the first company to offer shared electric scooters, has taken a number of steps to improve fleet
durability and retention.
DURABILITY: CUSTOM DESIGN AND REGULAR MAINTENANCE
Bird invested in R&D to internally design its own e-scooters (Bird Zero, Bird One, and Bird Two) to improve
on the consumer models used in earlier operations. The improvements included:
Custom battery with battery management system;
A frame more adapted to a shared used, with reinforced parts;
Long-lasting tires with flat protection;
Tamper-resistant components (i.e., no exposed cables);
A regenerative front brake and a rear drum brake with no electronic failure vulnerability.
Regular maintenance also contributes to a longer usable life. Investment in local service centers and
streamlined maintenance processes allowed for a reduction in the proportion of Bird Zero fleet damaged
from 40% to 12%. Key features that contributed to this improvement include:
Staff presence on street, in-app reporting, and sensors that alert to maintenance needs;
Regular maintenance performed by in-house mechanics;
A stock of spare parts in service centers, with part reuse from retired vehicles;
Weather analytics to remove scooters in case of extreme weather.
VEHICLE RETENTION
The proprietary design in itself prevents risks from hacking and resale for parts. In addition, specific design
developments are made to enhance retention: for instance installation of a superior GPS system, sensors,
and algorithms that detect suspicious movement have improved retention of the Bird fleet to close to
90% retention after 6 months.
In the future, retention is expected to increase even more as the Bird proprietary models are becoming
more numerous in the fleet: between September 2018 and July 2019, the proportion of consumer models
went from 98% to 25% of the worldwide fleet, the fleet being now composed of 57% of Bird Zero, 19% of
Bird One, and Bird Twos beginning to be deployed in Summer 2019.
There is wide variation among providers. Establishing an e-scooter business that is sustainable
requires investment in vehicle R&D, technology, and personnel. It can be assumed that providers
who have not made these investments have an environmental impact that is moderately to
significantly higher than those companies who have.
192. Shared mobility solutions must replace car trips
In order to fulfill their positive environmental potential, LEVs must replace emission intensive modes. This
requires action on the part of companies as well as local officials. Some recommendations at different levels
are presented here. Combined with the actions on durability of vehicles and retention of the fleet, they
would allow fostering the full sustainability benefits of LEVs, in the perspective of climate neutrality roadmaps
of mobility.
For micro-mobility companies, the main challenge is to pursue the growth of mode share: pushing up the
use of scooters while enhancing substitution of car trips. This can be done by attracting new customers for
the present service, by convincing customers to use their services more often and by proposing new
solutions that answer another demand, such as transports with loads. Advancements that ensure frictionless
service, including accurate location and ease of unlock, is also important. It is thus recommended to
continuously improve the hardware (comfort) as well as the operational intelligence ensuring the optimum
convenience of the service, while making sure that the price will be competitive to the other modes.
But efforts from scooters operating companies alone are not sufficient. They must be combined with
appropriate support from cities to develop better integration of LEVs in the mobility landscape. Supportive
policies to encourage modeshift are essential, with first and foremost an appropriate infrastructure
investment: a connected and protected bikeway network. This would benefit all light modes and it is the
most mentioned factor that would influence the use of light vehicles, as widely shown in studies on urban
mobility. However, these supportive policies have to be implemented along with regulation to users and
operators to ensure the safety of all light vehicles users and pedestrians, and the order of public spaces.
Inside the given regulatory framework that discourages the use of cars (e.g., speed limits, zero-emission
zones), the local authorities should ensure the development of multiple alternate options to cars, in order to
reduce transport insecurity of inhabitants (the fear of not finding a transport mode).
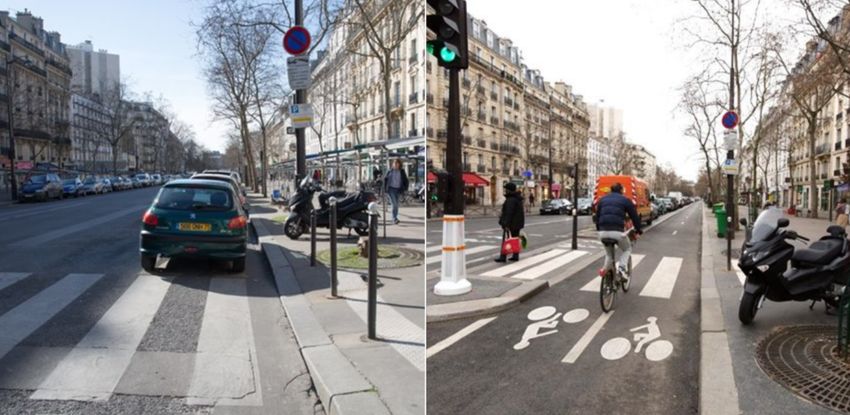
A street in Paris 12 for cars only (left) retrofitted with greenlanes (right). Cities investment in infrastructure
supports modeshift toward more sustainable options.
Cities and companies must work hand in hand to organize and optimize these new forms of micro-mobility.
First to allow for an enhanced multimodality (easy connection with other modes) and to solve the nuisance
problems related to incivilities (badly parked on sidewalk, accidents with pedestrians, etc.), but also to plan
a smart deployment of vehicles (especially for large events and touristic places) through the limitation of the
number of companies allowed to operate.
20Finally, over the long-term, it is critical to re-design public spaces to prioritize efficient modes. Public
infrastructure is currently organized around the use of personal cars. To meet climate neutrality goals, there
must be a transition from car-based designs towards streets that allocate connected and protected
greenlanes, which would be more adapted to LEVs, pedestrians, bikes and public transport.
To summarize, the following actions can be undertaken to ensure a maximal modeshift from cars:
Stakeholder Main recommandations
q Enhance ride comfort: safe/reliable/robust vehicles
q Ensure competitiveness: explore subscription model and affordability
Companies
q Expand range of vehicles: availability, frictionless experience, geographical scope
q Extend services to answer other demands, such as transport with loads (cargo bikes)
q Invest in infrastructure: connected and protected greenlanes and designated parking
Cities
q Adopt supportive policies: zero-emission zones, speed limited to 30 km/h to all modes
q Match supply and demand to enhance multimodality: ensure vehicles are reliably available
Companies at key hubs of the mobility network, in order to foster efficient transit connections
& Cities together
q Maximize economies of scale: limit the number of operators
21Conclusion
Dramatic changes in policy and urban form are needed to transition from the current mobility system in
which a majority of street space is given to cars, toward a more sustainable transport network wherein
walking and more efficient transport modes such as transit, bikes, and light electric vehicles (LEVs) are
prioritized.
Over the past decade, bicycle modeshare has dramatically increased thanks to changes in lifestyles,
supportive policies, and infrastructure investment. Many cities have expanded bikelanes and integrated
bikes in their mobility strategy, which has helped to set the stage for growth across new micro-mobility forms,
especially shared free-floating LEVs, including e-scooters and e-bikes.
These lighter forms of mobility are popular and show promise for helping cities achieve carbon neutrality,
provided they are fully integrated in a sustainable mobility landscape. At the moment e-scooters are
attracting riders from all types of modes, including some that would have walked or used public transport.
They are also replacing car trips, and to be compatible with the climate goals, this modeshift should be high
enough. In scenarios modeled for this report, LEVs play a role in the mobility package needed to achieve
reduction in greenhouse gases: LEVs are part of the solution that can help Paris to reduce total transport
related greenhouse gas emissions by up to 70% in an exploratory scenario with significant reduction in the
use of cars, which is aligned with the political ambition of the climate neutrality roadmap of Paris.
In order to achieve the sustainability benefits of LEVs, there are two conditions to be met, and they require
collaboration between mobility companies and local authorities: to ensure low lifecycle footprint of vehicles
though design and operational sustainability, and a coordinated approach to encourage modeshift from
cars. Vehicle longevity (through design and maintenance) is most important for lifecycle sustainability, and
the presence of safe and convenient infrastructure is important for supporting modeshift.
But not all operators are equipped to provide long-lasting vehicles and operate sustainably, and cities
should consider their track record and capacity on that aspect. It is a key focus area for Bird as seen in the
case study presented. Custom design and regular maintenance, along with appropriate retention
processes, are among the best practices to make vehicles last longer.
More broadly, cities and companies must work hand in hand to organize and optimize new forms of micro-
mobility. We note there may be transition costs as operators learn-by-doing, but these new forms of mobility
already show an impressive adoption by city inhabitants and tourists, a trend that is expected to continue
and should be considered by anyone committed to a low-carbon urban future.
22You can also read