ACSM AMERICAN FITNESS INDEX - 2021 SUMMARY REPORT Actively Moving America to Better Health
←
→
Page content transcription
If your browser does not render page correctly, please read the page content below

2021 SUMMARY REPORT

ACSM AMERICAN
FITNESS INDEX®
Actively Moving America to Better Health

ACTIVELY MOVING AMERICA TO BETTER HEALTH   1

"
      Physical activity is essential to
      human health. It is imperative
      that policymakers, educators,
      health care providers, and public
      health officials communicate the
      importance of physical activity and
      provide direction on methods to
      safely be physically active.

      – NiCole R. Keith, Ph.D., FACSM, 64th President of the American
      College of Sports Medicine (2020-2021)

ACTIVELY MOVING AMERICA TO BETTER HEALTH                                2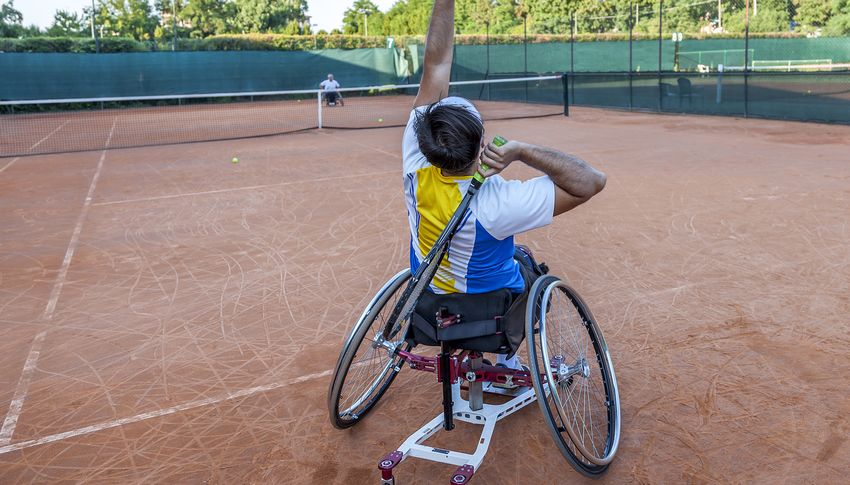
ACKNOWLEDGEMENTS

The ACSM American Fitness Index is generously supported by a grant from the Anthem
Foundation. Statements in this report are those of the authors and do not necessarily
reflect the views of the Anthem Foundation unless explicitly noted.

REPORT AUTHORS
Gretchen S. Patch, M.P.H., CPH, Director, Strategic Health Programs, American College
of Sports Medicine
Jessica M. Coffing, M.P.H., Principal, J. Coffing and Associates, LLC
Terrell W. Zollinger, Dr.P.H., Professor Emeritus, Indiana University Richard M. Fairbanks
School of Public Health; Associate, J. Coffing and Associates, LLC
Derek A. Zollinger, M.S., Data Analyst, J. Coffing and Associates, LLC
Stella L. Volpe, Ph.D., R.D.N., ACSM-CEP, FACSM, Virginia Polytechnic Institute and State
University

ADVISORY BOARD
ACSM greatly appreciates the contributions of Fitness Index Advisory Board members:
Chair: Stella Volpe, Ph.D., R.D.N., ACSM-CEP, FACSM, Virginia Polytechnic Institute and
State University
Carlos Crespo, Dr.P.H., FACSM, Portland State University
Jessie Fudge, M.D., FACSM, Kaiser Permanente
Jammie Hopkins, Dr.P.H., Morehouse School of Medicine
NiCole Keith, Ph.D., FACSM, Indiana University, Regenstrief Institute, Inc.
Alvin Morton, III, M.S., University of Tennessee, Knoxville
Amanda Paluch, Ph.D., University of Massachusetts Amherst
Allison Schroeder, M.D., Mayo Clinic
Walter Thompson, Ph.D., FACSM, Georgia State University
Carol Torgan, Ph.D., FACSM, National Institute of Arthritis and Musculoskeletal and Skin
Diseases, NIH
Kathleen Watson, Ph.D., U.S. Centers for Disease Control and Prevention

Questions and comments on the ACSM American Fitness Index or this report should be
directed to the American College of Sports Medicine at afi@acsm.org.

ACTIVELY MOVING AMERICA TO BETTER HEALTH                                                     3

July 13, 2021

Dear Partner in Promoting Fitness and Health:

One year ago, our country faced a health care crisis not seen since the last century. For those
who suffered the most and lost loved ones, we extend our deepest sympathies. While some
challenges remain, we’re hopeful that the worst of the coronavirus pandemic is behind us, and
we have great confidence for the future.

We learned many lessons as we battled the pandemic, not the least of which is how much
we value — and often take for granted — our health and our communities. Many questions
surfaced. How can I protect myself and others? What are sensible public health precautions?
How can I stay healthy? Those important questions existed before the pandemic, and the
answers became critical given the harsh realities of the past year. As the pandemic swept
across the country, it also amplified the disparities that exist in our communities and the
opportunities we have to improve health equity and address health-related social needs, such
as access to healthy food.

In light of this renewed focus on health and wellness, the ACSM American Fitness Index® has
never been more important. Funded by the Anthem Foundation and published by the American
College of Sports Medicine, the Fitness Index has become one of the most credible and reliable
assessments of individual and community fitness in the country. The research-backed Fitness
Index assesses the fitness of communities and provides the actionable data and resources cities
need to make improvements that lead to better health and disease prevention.

The 2021 Fitness Index evaluated America’s 100 largest cities using 34 indicators representing
health behaviors, health outcomes, built environment, recreational facilities and policy/funding.
Two new indicators were added this year because of their influence on overall health: food
security and sleep. We congratulate Arlington, Virginia, for being named America’s Fittest City
for the fourth consecutive year. Coming in at number one in the main categories of personal
and community health, Arlington also ranked first in eight separate indicators. Arlington’s
longstanding commitment to being a fit city serves as a model for all communities in the U.S.

Since its inception 14 years ago, Anthem Foundation has been proud to sponsor the ACSM
American Fitness Index. We encourage you to review the full report, study your city’s results
and then partner with us by using the report to help improve the health of your community and
its residents. To learn more, please visit AmericanFitnessIndex.org.

Sincerely,

Shantanu Agrawal, M.D., Chief Health Officer
Anthem, Inc.

ACTIVELY MOVING AMERICA TO BETTER HEALTH                                                      4

NEED FOR ACTION

Many of our largest cities were unhealthy
before the novel coronavirus (COVID-19)
pandemic. According to the 2021 American
Fitness Index, on average almost a third of
residents in the 100 largest U.S. cities have
obesity, 14% smoke, and 25% reported no
exercise in the previous month. And all of
this was before the pandemic. Preliminary
studies have indicated that during 2020, the
COVID-19 pandemic reduced physical activity
and healthy food intake, as well as increased
obesity rates and stress.1

While we will not know the full impact of
COVID-19 for years to come, preventing and
managing chronic diseases has never been
more important to our collective health and
economic well-being. Chronic conditions like
high blood pressure, diabetes, and cancer
account for 90% of the country’s annual $3.8
trillion health care costs.2-3 Heart disease,
stroke, and other cardiovascular diseases
cost $214 billion a year in health care and
$138 billion in lost productivity as a result of
premature death.4

Traditional chronic disease prevention focuses on a single disease at a time, potentially limiting
the possible impacts on improving overall health. Regular physical activity is an efficient way to
reduce the burden of multiple chronic illnesses, improve mental health, and lower overall health
care costs. Increasing physical activity through individual interventions alone is insufficient
for population level improvements. A supportive built environment is also required to improve
activity levels; however, many cities are not designed to help residents get or stay active. The
pandemic further amplified differences between neighborhoods across the country and the
resulting health inequities. Nearly 100 million Americans do not live within a 10-minute walk
to a public park.5 Neighborhoods without parks, connected sidewalks, or safe streets make it
difficult for residents to be active safely.

Physical activity is not only good for personal health, it is also good for a city’s bottom line.
There is strong evidence of significant economic benefits from local policies and planning that
support physical activity, walkability, and bikeability. Well-designed cities experience increased
home values, retail activity, and business and job growth.6-8 City officials must pass, fund, and
implement policies that support physical activity programming and infrastructure, specifically
investing in community assets in neighborhoods with low resource allocations.

                                                                                                5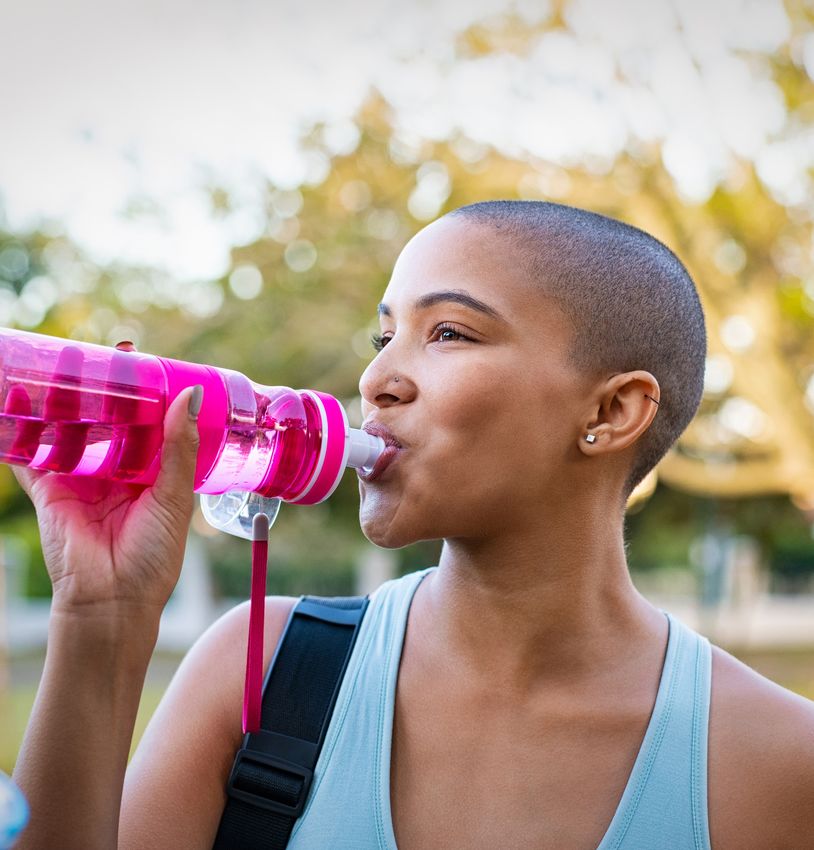
OUR APPROACH

“The ACSM American Fitness Index highlights the health and health habits of
 communities across the United States. It provides us with a snapshot of how we
 are doing, and identifies what more we can do to make our cities healthier. This
 past year, as we all know, was a very different year, with the COVID-19 pandemic.
 Nonetheless, the Fitness Index continues to help identify how communities can
 ensure that we have a healthy nation.”
 —STELLA L. VOLPE, PH.D., R.D.N., ACSM-CEP, FACSM, Virginia Polytechnic Institute and State University, chair of the ACSM American
 Fitness Index Advisory Board

The mission of the ACSM American Fitness Index (Fitness Index) is to increase awareness of how
cities are performing across a range of health and community measures to spark meaningful
discussion and advance action to make their residents stronger, fitter, and healthier. The Fitness
Index celebrates healthy, active lifestyles and encourages city leaders to enact policies and make
system changes to promote these behaviors. We focus on three strategies to support this effort:

1.   INFORM: Demonstrate the health, social, and economic benefits of physical activity as well as
     the policies and infrastructure that promote healthy behaviors.
     The Fitness Index, in partnership with the Anthem Foundation, ranks the 100 largest cities
     in the U.S. on a composite of health behaviors, chronic diseases, and city infrastructure.
     These rankings give city leaders the necessary information to improve their residents’ health
     through local policies and system changes.

2.   ENGAGE: Inspire city leaders and residents to recognize and celebrate the factors that
     contribute to their city’s culture of health and fitness.
     The Fitness Index has a strong history of widely sharing the annual rankings, as well as
     success stories from cities making healthy changes through strategic dissemination and
     communication. Using traditional and social media, it is estimated that the Fitness Index
     reaches 355 million people in the U.S and elsewhere annually to recognize achievements and
     stimulate local action and advocacy based on the most recent scientific data available.

3.   BUILD: Expand local capacity and partnerships to implement policy and infrastructure
     changes to enable physically active lifestyles for all residents.
     The Fitness Index is more than an annual ranking of cities. Since 2011, the Fitness Index has
     provided direct assistance and support to cities needing help to improve their residents’
     health. This tailored support helps city leaders identify opportunities for improvement and
     create plans for implementing changes.
     City leaders can access Fitness Index infographics and resources like the Community Action
     Guide. These tools allow any city, regardless of whether it is in the Fitness Index rankings, to
     assess its local health and fitness to develop and implement plans for improvement.

The Fitness Index approach aligns with the American College of Sports Medicine’s work to
address health and fitness through research and education. After all, the journey to a healthier
future begins where we live, learn, work, and play. The Fitness Index indicators address social
and physical environments that promote good health for all.19

ACTIVELY MOVING AMERICA TO BETTER HEALTH                                                                                        6
2021 RANKINGS

The 2021 ACSM American Fitness Index ranked Arlington, VA as the fittest city in America.
Cities with the highest scores are considered to have strong community fitness, a concept
analogous to individuals having strong personal fitness. Cities that rank near the top of
the Fitness Index have more strengths and resources that support healthy living and fewer
challenges that hinder it. The opposite is true for cities near the bottom of the rankings.
Explore the city comparison tool to access all the rankings, scores, and data and learn what your
city can do to help residents lead a healthy, active lifestyle: www.americanfitnessindex.org.

ACTIVELY MOVING AMERICA TO BETTER HEALTH                                                       7

2021 RANKINGS

                                                             ENVIRONMENT RANK

                                                                                                                                           ENVIRONMENT RANK
                                           PERSONAL HEALTH

                                                                                                                         PERSONAL HEALTH
                                                             COMMUNITY +

                                                                                                                                           COMMUNITY +
2020-2021

                                                                                2020-2021
TREND

                                                                                TREND
                                           RANK

                                                                                                                         RANK
                 OVERALL RANK                                                                OVERALL RANK

    ]        1        Arlington, VA          1                       1                      31    Durham, NC               11                      73

             2        Minneapolis, MN        3                       2                      32    Santa Ana, CA            10                      74

             3        Seattle, WA            5                       11                     33    Long Beach, CA           31                      41

             4        Denver, CO             2                       26                     34    Chula Vista, CA          16                      64

             5        Madison, WI            4                       21                     35    Fremont, CA              17                      61

    ]        6        Washington, D.C.       13                      4                      36    Tucson, AZ               41                      34

             7        St. Paul, MN           23                      3                      37    Hialeah, FL              30                      47

             8        Irvine, CA             6                       24                     38    Aurora, CO               21                      68

             9        Portland, OR           18                      16                     39    Los Angeles, CA          26                      57

             10       Atlanta, GA            14                      22                     40    Newark, NJ               45                      38

             11       Oakland, CA            9                       31                     41    St. Petersburg, FL       62                      17

             12       Boston, MA             33                      9.5                    42    Anaheim, CA              15                      89

             13       San Francisco, CA      27                      19                     43    Milwaukee, WI            70                      12

             14       Chicago, IL            36                      8                      44    Anchorage, AK            28                      70

             15       San Diego, CA          8                       39                     45    Plano, TX                48                      40

             16       Buffalo, NY            39                      13                     46    Omaha, NE                68                      23

             17       Boise, ID              35                      20                     47    Laredo, TX               44                      60

             18       Sacramento, CA         32                      29                     48    Glendale, AZ             49                      45

             19       Austin, TX             7                       55                     49    Stockton, CA             42                      69

             20       San Jose, CA           12                      53                     50    Richmond, VA             67                      30

    ]        21       New York, NY           29                      35                     51    Colorado Springs, CO     43                      71

             22       Lincoln, NE            37.5                    27                     52    Reno, NV                 47                      62

             23       Honolulu, HI           34                      32                     53    Cincinnati, OH           80                      18

             24       Pittsburgh, PA         56                      5                      54    Charlotte, NC            24                      93

             25       Miami, FL              22                      42                     55    Cleveland, OH            85                      7

             26       Virginia Beach, VA     19                      49                     56    New Orleans, LA          74                      28

             27       Albuquerque, NM        46                      25                     57    Tampa, FL                64                      37

             28       Norfolk, VA            60                      9.5                    58    Houston, TX              40                      87

             29       Jersey City, NJ        25                      46                     59    Nashville, TN            37.5                    88

             30       Raleigh, NC            20                      51                     60    Jacksonville, FL         52                      56

            ACTIVELY MOVING AMERICA TO BETTER HEALTH                                                                                                          8
2021 RANKINGS

                                                              ENVIRONMENT RANK

                                                                                                                                           ENVIRONMENT RANK
                                            PERSONAL HEALTH

                                                                                                                         PERSONAL HEALTH
                                                              COMMUNITY +

                                                                                                                                           COMMUNITY +
2020-2021

                                                                                 2020-2021
TREND

                                                                                 TREND
                                            RANK

                                                                                                                         RANK
                OVERALL RANK                                                                  OVERALL RANK

             61     Dallas, TX                59                      54                     81    Baton Rouge, LA         90                      43
             62     El Paso, TX               55                      63                     82    Irving, TX              78                      81

    ]        63     Chandler, AZ              57                      67                     83    Detroit, MI             88                      52

    ]        64     Scottsdale, AZ            50                      80                     84    Gilbert, AZ             58                      99
             65     Orlando, FL               79                      36                     85    San Antonio, TX         73                      91
             66     St. Louis, MO             95                      14                     86    Henderson, NV           83                      59
             67     Baltimore, MD             92                      15                     87    Corpus Christi, TX      93                      50

    ]        68     Mesa, AZ                  51                      85             ]       88    Las Vegas, NV           86                      66
             69     Philadelphia, PA          97                      6                      89    Arlington, TX           71.5                    97
             70     Phoenix, AZ               54                      83             ]       90    Fort Worth, TX          75                      96
             71     Greensboro, NC            66                      58                     91    Toledo, OH              99                      33
             72     Winston-Salem, NC         65                      72                     92    Memphis, TN             84                      82
             73     Riverside, CA             63                      84                     93    Bakersfield, CA         77                      95
             74     Fresno, CA                53                      92                     94    Louisville, KY          94                      65
             75     Garland, TX               61                      90                     95    Chesapeake, VA          91                      79
             76     Kansas City, MO           81                      48                     96    Indianapolis, IN        82                      94
             77     Lubbock, TX               71.5                    75                     97    Wichita, KS             96                      77
             78     Fort Wayne, IN            69                      86             ]       98    North Las Vegas, NV     87                      98
             79     Columbus, OH              89                      44                     99    Tulsa, OK               100                     78
             80     Lexington, KY             76                      76             ]       100   Oklahoma City, OK       98                      100

            *Due to the nature of data collection and reporting by public agencies, the data presented in the
            2021 Fitness Index were collected prior to the onset of the COVID-19 pandemic. However, these data
            describe the health and environmental conditions in the 100 largest U.S. cities not long before the
            pandemic started.

            K KEY
                                    IST QUARTILE                                                     3RD QUARTILE

                                    2ND QUARTILE                                                     4TH QUARTILE

            ]       CHANGE IN OVERALL RANK COMPARED TO 2020

            ACTIVELY MOVING AMERICA TO BETTER HEALTH                                                                                                          9
SUMMARY OF FINDINGS

For more than a decade the ACSM American Fitness Index has provided an annual snapshot of
community fitness for some of the largest cities and metros in the U.S. We congratulate Arlington,
VA for earning the #1 overall ranking in the 2021 ACSM American Fitness Index with a score of
86.1 out of a possible 100. Arlington continues to set a high standard and performed well against
the top competitors in Minneapolis, MN and Seattle, WA, ranked #2 and #3 overall respectively.
Arlington also ranked #1 in the personal health and community/environment sub-scores. At the
individual indicator level, Arlington ranked among the top 10 cities for 18 of the 34 indicators in the
Fitness Index, with eight indicators ranked #1.

ACTIVELY MOVING AMERICA TO BETTER HEALTH                                                              10
SUMMARY OF FINDINGS

                         ARLINGTON, VA RANKED #1 IN EIGHT INDICATORS
                            ARLINGTON, VA VS. LOWEST RANKED CITY

0.3     6.9 % WITH ANGINA OR CORONARY HEART DISEASE

  3.5                      25.1 % SMOKING

               15.2                        45.7 % WITH HIGH BLOOD PRESSURE

        6.7              18.2 % WITH FOOD INSECURITY

      4.2              21.8 % WITH DIABETES

                         24.1               45 % WITH POOR PHYSICAL HEALTH IN THE PREVIOUS MONTH

                        23.7                                   66.9 % IN EXCELLENT OR VERY GOOD HEALTH

                        % EXERCISING IN THE PREVIOUS MONTH 64.2                          85.7

      NEW IN 2021
      The Fitness Index Advisory Board added two indicators, food insecurity and sleep, that reflect
      the importance of a holistic perspective when considering personal and community fitness. The
      Advisory Board also removed farmers markets as an indicator to focus more broadly on the full
      range of food accessibility.

              WHAT IS FOOD SECURITY?                         ...AND FOOD INSECURITY?
              “Food security for a household means           “Food insecurity is the limited or
              access by all members at all times to          uncertain availability of nutritionally
              enough food for an active, healthy life.       adequate and safe foods, or limited or
              Food security includes at a minimum:           uncertain ability to acquire acceptable
              • The ready availability of nutritionally      foods in socially acceptable ways.”9-10
                adequate and safe foods.                     “…hunger is an individual-level
              • Assured ability to acquire                   physiological condition that may result
                acceptable foods in socially                 from food insecurity.”10
                acceptable ways (that is, without
                resorting to emergency food
                supplies, scavenging, stealing, or
                other coping strategies).”

      ACTIVELY MOVING AMERICA TO BETTER HEALTH                                                         11
SUMMARY OF FINDINGS
CITIES WITH HIGHEST
Food insecurity and overall health are directly
FOOD INSECURITY
linked. Challenges accessing healthy foods put
people at risk for developing hypertension and
diabetes and make managing these conditions OVERALL RANK
even more complex. Feeding America estimates
one in six people, approximately 50.4 million
people total, faced food insecurity in 2020 as a 1. St. Louis, MO 18.2%
result of the COVID-19 pandemic and high rates
2. New Orleans, LA & 18.0%
of unemployment and poverty, about 15.4 million
more than originally projected.11 Baltimore, MD (tied)
Food insecurity disproportionately affects 4. Detroit, MI 17.3%
racial/ethnic and low-income groups due to
neighborhood conditions that may limit access 5. Philadelphia, PA 16.3%
to food. Historical redlining and ongoing
6. Laredo, TX 16.1%
disinvestment resulted in neighborhoods with
few grocery stores resulting in food deserts 7. Toledo & 15.9%
served largely by convenience stores.12-13 Food Cleveland, OH (tied)
insecurity for many living in food deserts is
further compounded by limited transportation 9. Richmond, VA 15.8%
options available to reach full-service
supermarkets. 10. Lubbock, TX & 15.3%
Indianapolis, IN (tied)
ACTIVELY MOVING AMERICA TO BETTER HEALTH 12SUMMARY OF FINDINGS
SLEEP
Getting adequate sleep is one of five health behaviors
identified as key for preventing chronic diseases.14 With
the addition of the sleep indicator, the Fitness Index now
reports data on four of these health behaviors:
• Not smoking
• Regular physical activity
• Maintaining a healthy weight
• Getting 7+ hours of sleep
• Moderate or no alcohol consumption (not included in
the Fitness Index)
On average, less than 65% of residents in Fitness Index cities reported getting adequate amounts
of sleep. Inadequate sleep, less than 7 hours per day for adults, is a risk factor for diabetes,
cardiovascular disease, stroke, obesity, depression, and all-cause mortality. It also contributes to
motor vehicle crashes and machinery-related injuries.15
TOP 10 CITIES GETTING 7+ HOURS OF SLEEP
OVERALL RANK
4 OF THE 10
1. Lubbock, TX 77.8% cities getting the
most sleep are
2. Richmond, VA 73.6% located in Texas
3. Minneapolis, MN 72.8%
4. Arlington, TX 72.4%
5. Seattle, WA 71.2%
6. Fort Worth, TX 70.9%
7. Corpus Christi, TX 70.7%
8. Arlington, VA 70.5%
9. Aurora, CO 70.0%
10. Chula Vista & 69.5%
San Diego, CA (tied)
ACTIVELY MOVING AMERICA TO BETTER HEALTH 13SUMMARY OF FINDINGS The 2021 Fitness Index also resumed sharing demographic data for each city. These data are not included in the analysis to score and rank cities; rather, they are provided to add context to better understand the unique attributes of each city. DEEPER DIVE Beyond the overall rankings, the sub-scores and individual indicator data tell a more complete story for each city. Two cities, Arlington, VA and Minneapolis, MN, rank among the top 10 cities overall, as well as in both personal health and community/environment sub-scores. PERSONAL HEALTH RANK COMMUNITY/ ENVIRONMENT & SCORE RANK & SCORE OVERALL RANK OVERALL RANK 1 Arlington, VA 89.1 1 Arlington, VA 81.7 2 Denver, CO 81.9 2 Minneapolis, MN 80.0 3 Minneapolis, MN 81.0 3 St. Paul, MN 79.8 4 Madison, WI 79.4 4 Washington, D.C. 79.5 5 Seattle, WA 78.3 5 Pittsburgh, PA 78.6 6 Irvine, CA 72.1 6 Philadelphia, PA 78.5 7 Austin, TX 71.7 7 Cleveland, OH 78.3 8 San Diego, CA 71.4 8 Chicago, IL 77.8 9 Oakland, CA 71.0* 9 Boston, MA 77.0* 10 Santa Ana, CA 71.0* 10 Norfolk, VA 77.0* *Scores have been rounded to the nearest tenth of a point resulting in some apparent ties; however, the rankings are based on the full calculated score values that were not equal in those cases. ACTIVELY MOVING AMERICA TO BETTER HEALTH 14
SUMMARY OF FINDINGS

CHRONIC DISEASES AND PHYSICAL ACTIVITY
Physical inactivity and unhealthy diets have contributed to the rise in chronic diseases and
pose a clear threat to our health and health care systems, our cities, and our future. On average,
30.5% of adults in the Fitness Index cities had high blood pressure, 29.3% had obesity, and
10.2% had diabetes.

30%

15%

                      High Blood             Obesity                 Diabetes
                       Pressure
0%
      *100 city averages

High rates of obesity, chronic diseases, and smoking put some people at higher risk of severe
COVID-19 infections which resulted, in some cases, in hospitalization and death. These existing
health conditions combined with disparities in health care access, education, and economic equality
resulted in disproportionately higher rates of infection and deaths among racial/ethnic groups and
disabled populations.16-19
Despite the overwhelming evidence of the benefits of physical activity to prevent and manage
chronic diseases, improve mental health and cognitive function, and strengthen the immune system,
most adults are still not moving enough. On average, 75.7% of adults in the Fitness Index cities
reported any exercise in the previous month, but only 50.8% met the aerobic activity guidelines and
23.7% met the guidelines for both aerobic and strength activities.
ACSM and CDC recommend at least 150 minutes per week of moderate-intensity aerobic activity,
75 minutes of vigorous aerobic activity, or a combination of both for adults. They also recommend
muscle strengthening activity twice a week.

          75.7%                             50.8%                            23.7%

 OF ADULTS REPORTED                  OF ADULTS MET AEROBIC          OF ADULTS MET AEROBIC
  EXERCISING IN THE                   ACTIVITY GUIDELINES           AND STRENGTH ACTIVITY
   PREVIOUS MONTH                                                        GUIDELINES

ACTIVELY MOVING AMERICA TO BETTER HEALTH                                                            15
SUMMARY OF FINDINGS
Arlington, VA residents reported the most physical activity with 85.7% exercising in the previous
month. St. Petersburg, FL topped the charts for aerobic activity with 65.4% of residents reporting
that they met the guidelines. Anaheim, Irvine, and Santa Ana, CA tied with 31.0% of residents
meeting both aerobic and strengthening activity guidelines. Across all U.S. cities there is room for
residents to move more and sit less.
EXERCISING IN MEETING AEROBIC MEETING AEROBIC &
THE PREVIOUS ACTIVITY GUIDELINES STRENGTH ACTIVITY
MONTH GUIDELINES
OVERALL RANK OVERALL RANK OVERALL RANK
1. Arlington, VA 1. St. Petersburg, FL 1. Anaheim, Irvine,
and Santa Ana, CA
2. Madison, WI 2. St. Paul, MN
(tied)
3. Minneapolis, MN 3. Minneapolis, MN
3. Hialeah &
4. Fremont & 4. San Francisco, CA Miami, FL (tied)
Oakland, CA (tied)
5. Madison, WI 4. Madison, WI
6. St. Petersburg, FL
6. Portland, OR 5. Minneapolis, MN
7. Seattle, WA
7. Seattle, WA 6. Tucson, AZ
8. Denver, CO
8. Tucson, AZ 7. Atlanta, GA
9. St. Paul, MN
9. Chula Vista & San 8. Albuquerque, NM
10. Virginia Beach, VA Diego, CA (tied)
ACTIVELY MOVING AMERICA TO BETTER HEALTH 16SUMMARY OF FINDINGS
PUTTING IT INTO PRACTICE
Over time our national priorities have drifted away from
funding prevention to focus on curative care. City officials
are in a unique position to change this narrative by increasing
the investment in pedestrian-friendly built environments
and community resources that support physical activity. The
Fitness Index encourages local officials to implement policies,
such as Complete Streets, that improve the built environment
for all residents. This includes the availability, maintenance,
and improvement of infrastructure like connected sidewalks,
bike lanes, trails, parks, recreational centers, and ball fields
and courts. This infrastructure provides opportunities
for better health and social outcomes as a result of play,
recreation, exercise, and active transportation such as walking
or biking to school, work, and for daily errands.
Taking action at the city level is not a one-size-fits-all
approach, but there are shifts to policy, land use and
development, transportation, and codes that support
economic development AND physical activity and access to
healthy foods. Best-practice solutions include a combination
of activity-friendly routes that connect to everyday
destinations.20 This approach increases the number of people walking and biking while raising
property values and increasing economic activity in the area. Additionally, vibrant, walkable, and
transit-connected neighborhoods address the unmet market demands for urban living.
• Use current data on health behaviors and outcomes as well as community input to
understand neighborhood challenges and opportunities, specifically as it relates to land use,
design, and development. Changes to the built environment must center the voices of those
impacted throughout the lifecycle of the project, not just at one-off community meetings.
• Adopt codes, policies, and guidelines that facilitate physical and mental health for people
of all ages, abilities, and incomes. This includes but is not limited to fully implementing strong
Complete Streets policies, mixed land-use zoning, and increasing residential density.
• Build relationships across local government sectors by including public health,
transportation, parks and recreation, city planning, and economic development at the table.
Planners often think of walking and biking in terms of improving air quality, livability, and
congestion rather than promoting physical activity. Public health professionals offer a unique
perspective on impact of the built environment on chronic diseases.
• Maximize federal and state projects and funding whenever possible. Piggy back on
their projects to achieve local goals. For example, state highway projects may offer the
opportunity to address sidewalk connectivity in nearby neighborhoods.
• Leverage public-private relationships and funding opportunities to stretch scarce
resources. Public investment in community assets can draw local philanthropists to match the
government’s financing.
ACTIVELY MOVING AMERICA TO BETTER HEALTH 17SUMMARY OF FINDINGS
On a final note, many cities find themselves in lean economic times due to the pandemic. This
comes at a time when lost revenues collide with skyrocketing costs for providing city services and
expenditures for the COVID-19 response. Federal funding available as part of the COVID-19 relief
efforts may provide support for smart growth projects and the direct benefits of these projects to
the local economy and job creation are not insignificant. Walking and biking infrastructure is less
expensive and creates more jobs per mile than any other type of transportation.21
Pedestrian infrastructure, built environment improvements, and parks and recreation may not
seem like high priorities in downturns. However, there are real economic benefits to neighborhood
investments, especially those focused on increasing local walkability and bikeability. Rails to Trails
Conservancy estimates connected walking and biking infrastructure could have an annual return on
investment as high as $73 billion nationally.21
Regardless of their ranking in the 2021 Fitness Index, officials in all 100 of the largest U.S.
cities have a significant opportunity to drive economic growth and create jobs through built
environment improvements that support physical activity and healthy lifestyles. After all, the first
step to attracting new residents and jobs is offering a higher quality of life, in which city and local
governments are highly invested in the well-being of all of their residents.
18INTERPRETING THE RANKINGS It is important to consider both the score and the rank for each city when using the Fitness Index. While the rankings list the cities from the highest score to the lowest score, the scores for many cities are very similar, indicating there may be relatively little real difference among their fitness levels. For example, Stockton, CA scored 51.3 overall and ranked #49 while New Orleans, LA scored 50.3 overall and ranked #56. While Stockton ranked seven positions higher than New Orleans in the 2021 Fitness Index, these two cities are actually very similar across most of the indicators as evidenced by the close scores (1.0 point difference in scores); thus, there is little real difference in the community fitness levels of the two cities. Also, while one city ranks #1 and another ranks #100, this does not necessarily mean that the highest ranked city has excellent values across all indicators and the lowest ranked city has the lowest values across all indicators. The ranking merely indicates that, relative to each other, some cities scored better than others. Visit www.americanfitnessindex.org/rankings to compare city indicators and sub-scores using the interactive city comparison tool. It is important to remember that a majority of the indicators do not change rapidly, and it will take time for the impact of new initiatives to result in changes to health indicators. While improvements in community and built environment indicators are important investments, a notable change in the health of residents is expected to slowly but surely follow. Additionally, some indicator-level changes may be due to sample size or sampling variation. Cities with the best scores, and even those with scores close to the best, are commended for their efforts to improve and maintain the health and fitness of their residents. These cities demonstrated the ability to support healthy lifestyles; thus, their approaches may serve as examples to cities working to improve similar indicators. The Fitness Index celebrates the tremendous efforts that all cities put into improving the health and well-being of their residents as we all move toward a healthier future for America. ACTIVELY MOVING AMERICA TO BETTER HEALTH 19
APPENDIX: METHODOLOGY

The Fitness Index’s annual assessment of the 100 largest cities in the U.S. provides city
officials with much needed data at the local level. Due to the nature of data collection and
reporting, much of the data used in the 2021 Fitness Index rankings were collected prior to
the COVID-19 pandemic. The effects of the pandemic on personal health behaviors and health
outcomes will not be fully understood for several years.
The Fitness Index was calculated using 34 indicators from reliable, publicly accessible, and
regularly updated sources. Indicators were combined to create sub-scores for personal health
and community and environment indicators. Individual indicators were weighted relative to their
assessed impact on community fitness, converted to ranks, and combined using a mathematical
formula described in the methodology section on the website. A weighted average of the two
sub-scores formed the total score, which was then ranked to show how the cities’ fitness levels
compared to each other.
The analysis included city-level data when available. All other indicator data were analyzed
for the county(ies) where the city proper was located. Groups of counties were used when
the city limits extend across county lines. For example, the City of Denver, CO is located only
in Denver County; however, New York, NY is located in the five counties of Bronx, Kings, New
York, Queens, and Richmond.

                             9 HEALTH
                            BEHAVIORS
                                                  PERSONAL
                                                    HEALTH
                                                  SUBSCORE
                            10 HEALTH
                            OUTCOMES

                                                                   TOTAL
                             6 BUILT                               SCORE
                          ENVIRONMENT

                                                 COMMUNITY/
                         6 RECREATIONAL
                                                 ENVIRONMENT
                            FACILITIES
                                                  SUB-SCORE

                             3 POLICY/
                             FUNDING

ACTIVELY MOVING AMERICA TO BETTER HEALTH                                                          20
APPENDIX: METHODOLOGY
The Fitness Index Advisory Board reviewed and updated the
indicators used to calculate the 2021 scores and rankings. + ADDED
Two indicators were added: food insecurity and sleep. These
indicators reflect the importance of a holistic perspective % sleeping 7+ hours/
when considering personal and community fitness.
day
The Advisory Board uses a variety of considerations when
removing indicators. Farmers markets were removed as % with food
an indicator to focus more broadly on neighborhood food insecurity
access.
Due to an insufficient number of 2019 BRFSS survey * REMOVED
respondents, responses from 2018 were used for Jersey City
and Newark, NJ and responses from 2018 and 2019 were farmers markets/ 1M
used for Laredo, TX. Parks and recreation facilities data were
collected by the Fitness Index staff for Arlington, VA, Fort
Wayne, IN, Fort Worth, TX, Gilbert, AZ, Greensboro, NC,
Indianapolis, IN, Miami, FL, Norfolk, VA, Richmond, VA, and
Tampa, FL.
Due to updates to the indicators, comparisons of overall rank, score, and sub-scores from
previous years should be avoided. Individual indicators that have not changed can be
compared to data from 2018 to 2021.
For more information on the development of the Fitness Index, please visit:
www.americanfitnessindex.org/methodology.
ACTIVELY MOVING AMERICA TO BETTER HEALTH 21APPENDIX: METHODOLOGY PERSONAL HEALTH INDICATORS Health Behaviors Data Range 100 City Average % exercising in the previous month 64.2 85.7 75.7 % meeting aerobic activity guidelines 34.2 65.4 50.8 % meeting aerobic & strength activity guidelines 15.7 31.0 23.7 % bicycling or walking to work 0.5 19.3 4.5 % using public transportation to work 0.3 55.6 7.0 % consuming 2+ fruits/ day 21.3 41.7 31.0 % consuming 3+ vegetables/ day 8.8 20.9 14.5 % sleeping 7+ hours/ day 53.3 77.8 64.8 % smoking 3.5 25.1 13.8 Health Outcomes % in excellent or very good health 23.7 66.9 49.9 % with poor physical health in the previous month 24.1 45.0 36.6 % with poor mental health in the previous month 27.3 51.7 39.5 % with obesity 8.6 41.3 29.3 % with asthma 4.6 16.8 8.8 % with high blood pressure 15.2 45.7 30.5 % with angina or coronary heart disease 0.3 6.9 3.2 % with stroke 0.1 7.3 3.2 % with diabetes 4.2 21.8 10.2 Pedestrian fatality rate/ 100,000 residents 0.0 7.5 2.6 ACTIVELY MOVING AMERICA TO BETTER HEALTH 22
APPENDIX: METHODOLOGY

COMMUNITY/ ENVIRONMENT INDICATORS

Built Environment                          Data Range          100 City Average
Air quality index                          18.1         98.1   64.5

Bike Score                                 29.2         83.5   54.1

% with food insecurity                     6.7          18.2   12.2

Parks/ 10,000 residents                    1.3          10.9   4.0

% within a 10-minute walk to a park        31.0         100    70.8

Walk Score                                 21.0         88.3   48.0

Recreational Facilities
Ball diamonds/ 10,000 residents            0.0          5.2    1.7

Basketball hoops/ 10,000 residents         0.7          16.2   3.4

Playgrounds/ 10,000 residents              0.8          6.9    2.4

Recreational centers/ 20,000 residents     0.1          2.9    0.9

Swimming pools/ 100,000 residents          0.0          10.8   2.3

Tennis courts/ 10,000 residents            0.0          5.9    1.8

Policy & Funding Rank
Local Complete Streets policy              0.0          2.0    1.0

Park expenditure/ resident                 $14          $309   $102

Physical education requirement             0.8          3.0    2.8

ACTIVELY MOVING AMERICA TO BETTER HEALTH                                          23
APPENDIX: DATA SOURCES

The Fitness Index uses a variety of data sources to calculate the annual scores and rankings.
• 2019 American Community Survey - U.S. Census
• 2018 & 2019 Behavioral Risk Factor Surveillance System, County Data - CDC
• 2019 Environmental Protection Agency
• 2020 Map the Meal Gap - Feeding America
• 2017 National Association of State Boards of Education
• 2019 National Highway Traffic Safety Administration
• 2020 Smart Growth America/ National Complete Streets Coalition
• 2020 Trust for Public Land - City Park Facts
• 2020 Walk Score and Bike Score

ACTIVELY MOVING AMERICA TO BETTER HEALTH                                                        24
APPENDIX: REFERENCES

1.   Ruiz MC, Devonport TJ, Chen-Wilson CJ, et al. A cross-cultural exploratory study of health
     behaviors and wellbeing during COVID-19. Front Psychol. 2021;11:608216.

2.   Buttorff C, Ruder T, Bauman M. Multiple Chronic Conditions in the United States. Santa
     Monica, CA: Rand Corp. 2017 [cited 2021 March 16]. Available from: https://www.rand.org/
     pubs/tools/TL221.html.

3.   Martin AB, Hartman M, Lassman D, Catlin A; National Health Expenditure Accounts Team.
     National health care spending in 2019: steady growth for the fourth consecutive year.
     Health Aff. 2021;40(1):14-24.

4. U.S. Centers for Disease Control and Prevention. 2020, October 7. Factsheets and At a
   Glances: Heart Disease and Stroke. [cited 2021 March 16]. Available from: https://www.cdc.
   gov/chronicdisease/resources/publications/factsheets/heart-disease-stroke.htm.

5.   The Trust for Public Land. The Trust for Public Land ParkScore® Index. San Francisco, CA:
     2020 [cited 2021 March 16]. Available from: https://www.tpl.org/parkscore.

6.   Sallis JF, Spoon C, Cavill N, et al. Co-benefits of designing communities for active living: an
     exploration of literature. Int J Behav Nutr Phys Act. 2015;12(30).

7.   Guo JY, Gandavarapu S. An economic evaluation of health-promotive built environment
     changes. Prev Med. 2010;50:44-49.

8.   U.S. Environmental Protection Agency. 2012, December. Smart Growth and Economic
     Success: Benefits for Real Estate Developers, Investors, Business, and Local Governments.
     [cited 2021 March 16]. Available from: https://www.epa.gov/smartgrowth/smart-growth-
     and-economic-success-benefits-real-estate-developers-investors-business-and

9.   Life Sciences Research Office, Andersen SA, ed. Core indicators of nutritional state for
     difficult to sample populations. J Nutr. 1990;120 Suppl 11:1559-600.

10. U.S. Department of Agriculture. 2020, September 09. Food Security in the US:
    Measurement. [cited 2021 March 16]. Available from: https://www.ers.usda.gov/topics/
    food-nutrition-assistance/food-security-in-the-us/measurement/#insecurity.

11. Feeding America. The Impact of the Coronavirus on Food Insecurity in 2020. Chicago, IL:
    2020 [cited 2021 March 16]. Available from: https://www.feedingamerica.org/sites/default/
    files/2020-10/Brief_Local%20Impact_10.2020_0.pdf

12. Powell LM, Slater S, Mirtcheva D, Bao Y, Chaloupka FJ. Food store availability and
    neighborhood characteristics in the United States. Prev Med. 2007;44(3):189-195.

13. Beaulac J, Kristjansson E, Cummins S. A systematic review of food deserts, 1966-2007.
    Prev Chron Dis. 2009;6(3):A105.

14. Liu Y, Croft JB, Wheaton AG, et al. Clustering of five health-related behaviors for chronic
    disease prevention among adults, United States, 2013. Prev Chronic Dis. 2016;13:E70.

ACTIVELY MOVING AMERICA TO BETTER HEALTH                                                          25
APPENDIX: REFERENCES
15. Institute of Medicine. Sleep Disorders and Sleep Deprivation: An Unmet Public Health
Problem. Washington, DC: The National Academies Press; 2006.
16. Hatcher SM, Agnew-Brune C, Anderson M, et al. COVID-19 Among American Indian and
Alaska Native Persons - 23 States, January 31-July 3, 2020. MMWR Morb Mortal Wkly Rep.
2020;69(34):1166-1169.
17. Stokes EK, Zambrano LD, Anderson KN, et al. Coronavirus Disease 2019 Case
Surveillance - United States, January 22-May 30, 2020. MMWR Morb Mortal Wkly Rep.
2020;69(24):759-765.
18. Landes SD, Stevens D, Turk MA. COVID-19 and Pneumonia: Increased Risk for Individuals
with Intellectual and Developmental Disabilities During the Pandemic. Syracuse University
Lerner Center for Public Health Promotion Research Brief. 2020. [cited 2021 March
16]. Available from: https://lernercenter.syr.edu/2020/04/27/covid-19-and-pneumonia-
increased-risk-for-individuals-with-intellectual-and-developmental-disabilities-during-the-
pandemic/.
19. U.S. Centers for Disease Control and Prevention Covid Response Team. Geographic
Differences in COVID-19 Cases, Deaths, and Incidence - United States, February 12-April 7,
2020. MMWR Morb Mortal Wkly Rep. 2020;69(15):465-471.
20. U.S. Centers for Disease Control and Prevention. 2019, June 28. Designing Activity-Friendly
Communities. [cited 2021 March 16]. Available from: https://www.cdc.gov/nccdphp/dnpao/
features/walk-friendly-communities/index.html.
21. Rails to Trails Conservancy. Active Transportation Transforms America: The Case for
Increased Public Investment in Walking and Biking Connectivity. Washington, D.C.:
2019 [cited 2021 March 16]. Available from: https://www.railstotrails.org/media/847675/
activetransport_2019-report_finalreduced.pdf?utm_source=attareport&utm_
medium=web&utm_campaign=trailstransform.
ACTIVELY MOVING AMERICA TO BETTER HEALTH 26ABOUT US
The American College of Sports Medicine is the largest sports medicine and exercise
science organization in the world. More than 50,000 international, national and regional
members are dedicated to advancing and integrating scientific research to provide
educational and practical applications of exercise science and sports medicine. More
details can be found at www.acsm.org.
ACSM is a global leader in promoting the benefits of physical activity and advocates
for legislation that helps government and the health community make it a priority.
ACSM encourages Congress to support continued funding of parks, trails, and safe
routes to school, as well as the need for all Americans to meet the physical activity
recommendations included in the National Physical Activity Guidelines, and the
need for the guidelines to be regularly updated every 10 years.
The Anthem Foundation is the philanthropic arm of Anthem, Inc. and through
charitable contributions and programs, the Foundation promotes the inherent
commitment of Anthem, Inc. to enhance the health and well-being of individuals
and families in communities that Anthem, Inc. and its affiliated health plans serve.
The Foundation focuses its funding on strategic initiatives that make up its Healthy
Generations Program, a multigenerational initiative that targets: maternal health,
diabetes prevention, cancer prevention, heart health and healthy, active lifestyles,
behavioral health efforts and programs that benefit people with disabilities.
The Foundation also coordinates the company’s year-round Dollars for Dollars
program which provides a 100 percent match of associates’ donations, as well as
its Volunteer Time Off and Dollars for Doers community service programs. To learn
more about the Anthem Foundation, please visit http://www.anthem.foundation
and its blog at https://medium.com/anthemfoundation.
ACTIVELY MOVING AMERICA TO BETTER HEALTH 27ACSM AMERICAN FITNESS INDEX IS AVAILABLE IN ITS
ENTIRETY AT WWW.AMERICANFITNESSINDEX.ORG. VISIT
THE WEBSITE TO COMPARE CITY RANKINGS, DOWNLOAD
RESOURCES, AND REQUEST ASSISTANCE FOR YOUR CITY.
JULY 2021You can also read