Can We Vacuum Our Air Pollution Problem Using Smog Towers? - MDPI
←
→
Page content transcription
If your browser does not render page correctly, please read the page content below
atmosphere
Communication
Can We Vacuum Our Air Pollution Problem Using
Smog Towers?
Sarath Guttikunda *          and Puja Jawahar
 Urban Emissions, New Delhi 110019, India; puja@urbanemissions.info
 * Correspondence: sguttikunda@urbanemissions.info

 Received: 29 July 2020; Accepted: 28 August 2020; Published: 29 August 2020

 Abstract: In November 2019, the Supreme Court of India issued a notification to all the states in the
 National Capital Region of Delhi to install smog towers for clean air and allocated INR 36 crores
 (~USD 5.2 million) for a pilot. Can we vacuum our air pollution problem using smog towers?
 The short answer is “no”. Atmospheric science defines the air pollution problem as (a) a dynamic
 situation where the air is moving at various speeds with no boundaries and (b) a complex mixture
 of chemical compounds constantly forming and transforming into other compounds. With no
 boundaries, it is unscientific to assume that one can trap air, clean it, and release into the same
 atmosphere simultaneously. In this paper, we outline the basics of atmospheric science to describe
 why the idea of vacuuming outdoor air pollution is unrealistic, and the long view on air quality
 management in Indian cities.

 Keywords: India; Delhi; air quality; controls; smog towers; filtration systems

1. Introduction
      Air pollution is a major health risk worldwide—outdoor PM2.5 (particulate matter) and
Ozone pollution accounted for an estimated 3 million and 0.5 million premature deaths,
respectively, and household (indoor) air pollution for an additional 1.6 million premature deaths [1].
Corresponding numbers for India are 680,000 for outdoor PM2.5 , 145,000 for outdoor ozone, and 480,000
for household pollution. Similar estimates were presented by researchers and scientists from the Indian
institutes [2–6]. In all the studies, the very young and the old are particularly vulnerable.
      The year 2020 is an aberration in the pollution trends, with the COVID-19 lockdowns and a range
of restrictions for all the sectors [7]. Across India, ambient air pollution levels improved as much as 50%
compared to the annual trends for the same period in the previous year [8]. A summary of the data
from all the cities with at least one continuous air monitoring station is included in the Supplementary
Materials. Following the pandemic, epidemiological work on COVID-19 patients suggests that the risk
of mortality is higher among the population exposed to chronic PM2.5 and NO2 pollution [9,10].
      One key lesson from the COVID-19 lockdowns worldwide, is that air pollution can be reduced
locally and globally by reducing the emissions at the sources. This was witnessed in the data from
the ground-based monitors worldwide and satellite retrievals over India, China, Italy, and the United
States [11–13]. The measures enacted during the lockdowns are unprecedented, but the results are
evidence that we eventually need to control the emissions at the sources for “clean air”.
      While the messages are clear that high air pollution is the leading cause of health impacts and
“clean air” is only possible by addressing the emissions at the sources, in November 2019, the Supreme
Court of India issued a notification to all the states in the National Capital Region of Delhi (NCR) to
install smog towers. These giant filtering systems are being pursued as a control mechanism only in the
absence of real action to control the emissions at the sources and the continuing incidence of high air
pollution levels in Delhi and other major cities. Examples discussed in the notification for replication

Atmosphere 2020, 11, 922; doi:10.3390/atmos11090922                            www.mdpi.com/journal/atmosphere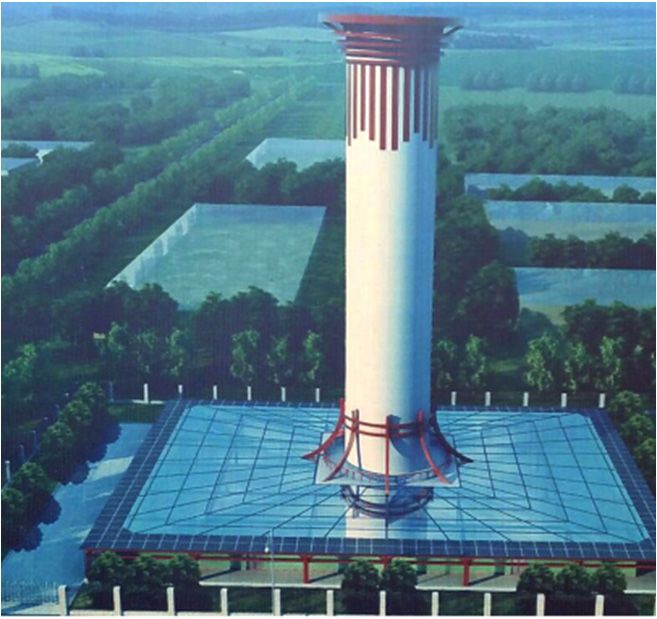
While the messages are clear that high air pollution is the leading cause of health impacts and
“clean air” is only possible by addressing the emissions at the sources, in November 2019, the
Supreme Court of India issued a notification to all the states in the National Capital Region of Delhi
(NCR) to install smog towers. These giant filtering systems are being pursued as a control mechanism
only in the
Atmosphere   absence
           2020, 11, 922 of real action to control the emissions at the sources and the continuing incidence
                                                                                                       2 of 11
of high air pollution levels in Delhi and other major cities. Examples discussed in the notification for
replication are (a) a 100 m high purification tower in Xi’an, China [14] and (b) experimental large
are (a) a 100 m high purification tower in Xi’an, China [14] and (b) experimental large vacuum cleaners
vacuum cleaners called Wind Augmentation and Air Purifying Units (WAYU) were deployed in the
called Wind Augmentation and Air Purifying Units (WAYU) were deployed in the cities of Delhi,
cities of Delhi, Mumbai, and Bengaluru, with no operational details, and (c) a smaller version of the
Mumbai, and Bengaluru, with no operational details, and (c) a smaller version of the Xi’an smog tower
Xi’an smog tower in Delhi (Figure 1). The latter designs also include “mist makers” to initiate
in Delhi (Figure 1). The latter designs also include “mist makers” to initiate coagulation and induce wet
coagulation and induce wet scavenging of the particles. The units installed in Delhi and Mumbai
scavenging of the particles. The units installed in Delhi and Mumbai were designed by the National
were designed by the National Environmental Engineering Research Institute (NEERI) and Indian
Environmental Engineering Research Institute (NEERI) and Indian Institute of Technology (Mumbai)
Institute of Technology (Mumbai) and inaugurated by the then Minister of Environment [15].
and inaugurated by the then Minister of Environment [15].

                      (a)                                            (b)                                     (c)

      Figure 1. Examples of ambient filtering systems: (a) a smog tower from Xi’an, China, (Image edited
      Figure 1. Examples of ambient filtering systems: (a) a smog tower from Xi’an, China, (Image edited
      from South China Morning Post), (b) a Wind Augmentation and Air Purifying Unit (WAYU) in Delhi,
      from South China Morning Post), (b) a Wind Augmentation and Air Purifying Unit (WAYU) in Delhi,
      and (c) a smaller version of Xi’an’s filtering system in Delhi.
      and (c) a smaller version of Xi’an’s filtering system in Delhi.
      A fundamental question remains, “can we vacuum our air pollution problem using smog towers
      A fundamental
and mist    makers”? question
                           The shortremains,
                                        answer“can       we vacuum
                                                   is “no”.   The idea ourofair  pollutionwhat
                                                                              removing      problem      using smog
                                                                                                    is already   in thetowers
                                                                                                                          air is
and   mist  makers”?      The   short   answer     is “no”.  The   idea  of   removing     what
unrealistic, given the dynamic nature of air pollution, which moves and transforms simultaneously. is  already   in  the  air is
unrealistic,   given   the  dynamic     nature   of  air pollution,  which     moves   and  transforms
In this paper, we outline the basics of atmospheric science to describe why the idea of vacuuming            simultaneously.
In this paper,
outdoor            we outline
           air pollution         the basics of
                             is unscientific,   andatmospheric
                                                      the long viewscience   to describe
                                                                        on air             why the ideainofIndian
                                                                                 quality management               vacuuming
                                                                                                                          cities.
outdoor    air  pollution   is unscientific,   and   the long  view   on air  quality  management
In India, PM2.5 is considered the main criteria pollutant for environmental compliance and public         in  Indian  cities.  In
India,  PM  2.5 is considered the main criteria pollutant for environmental compliance and public health,
health, and all of the discussion in this paper is about PM.
and all of the discussion in this paper is about PM.
2. The Sciences
2. The Sciences
      The definition of atmospheric science can be explained via the three basic sciences—Mathematics,
      Theand
Physics,     definition
                 Chemistry. of atmospheric science can be explained via the three basic sciences—
Mathematics, Physics, and Chemistry.
2.1. Mathematics
2.1. Mathematics
      Mathematics relates to the “quantification” of the problem. In a box model version of a city
      Mathematics
(Figure  2), the size relates    to the
                        of the city   and“quantification”
                                           the height of theofinversion
                                                                   the problem.layer In  a determine
                                                                                      will box modelthe     version
                                                                                                                amountof aofcity
                                                                                                                             air
(Figure 2),
present       the size
          at any    givenofinstance.
                             the city and
                                        Thethe   height of
                                             inversion       the is
                                                          layer   inversion    layerlayer
                                                                    an invisible      will of
                                                                                           determine
                                                                                               air, which  thedetermines
                                                                                                                amount ofthe  air
present
total     at any
      volume     of given   instance.
                    air available   for The  inversion
                                        horizontal    andlayer   is an
                                                           vertical     invisible
                                                                     mixing.    Thislayer  of isair,
                                                                                      height         which determines
                                                                                                  determined     by prevalentthe
total volume
surface            of air air
         temperature,      available    for horizontal
                               temperature     at the groundandandvertical
                                                                      uppermixing.      This height
                                                                               layers, humidity           is determined
                                                                                                     levels,   and land cover,by
prevalent
all varyingsurface
              in timetemperature,
                        and space. Thereair temperature
                                              is seasonalityatassociated
                                                               the groundwith  andtheupper  layers,layer—highest
                                                                                       inversion       humidity levels,     and
                                                                                                                        during
landsummer
the   cover, all    varying
                months    andinlowest
                                 time and    space.
                                        during         There is
                                                  the winter     seasonality
                                                              months.    This is associated   with the
                                                                                   a typical trend         inversion
                                                                                                      for most   of thelayer—
                                                                                                                        inland
cities in India [16]. The coastal cities like Chennai and Mumbai experience lesser variation across the
seasons due to the constant presence of land–sea breeze.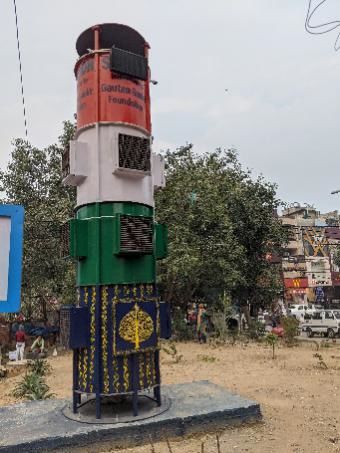
Atmosphere 2020, 11, x FOR PEER REVIEW 3 of 13
highest during the summer months and lowest during the winter months. This is a typical trend for
most of the inland cities in India [16]. The coastal cities like Chennai and Mumbai experience lesser
Atmosphere
variation2020, 11, 922
across the seasons due to the constant presence of land–sea breeze. 3 of 11
(a) (b)
Figure 2. Depiction of a box model pollution calculation with varying inversion heights (a) for summer
Figure 2. Depiction of a box model pollution calculation with varying inversion heights (a) for
months and (b) for winter months.
summer months and (b) for winter months.
Pollution (in the units of µg/m3 ) is defined as mass over volume, where mass is the emission load
Pollution
and volume (in amount
is the the unitsofof airμg/m
3) is defined as mass over volume, where mass is the emission
present. In the summer months, a higher volume of air means more
load and
room volume
for lateral andis the amount
vertical of airand
mixing, present. In thefor
vice versa summer months,
the winter a higher
months. volume
For the sameofamount
air meansof
emissions in all the months, concentrations are bound to be higher in the winter months andamount
more room for lateral and vertical mixing, and vice versa for the winter months. For the same lower
ofthe
in emissions
summer in months.
all the months, concentrations
For “clean air” and lowerare bound to be higherthe
concentrations, in requirement
the winter months andhigher
is either lower
in the summer months. For “clean air” and lower concentrations, the
inversion layer height or lower emissions. It is next to impossible to alter meteorology; however,requirement is either higher
inversionemissions
reducing layer height or lower
should emissions.
be relatively easy.It is next to impossible to alter meteorology; however,
reducing
In theemissions
box model, should be relatively
we assumed thateasy.
emissions remain constant over months. This is not true.
Emissions
In the box model, we assumed that case
are also seasonal, which in the of India
emissions are higher
remain in the
constant over winter months
months. This from
is notspace
true.
heating
Emissions needs
are [17]
alsoalong withwhich
seasonal, a lowering
in the in mixing
case height,
of India furtherincompounding
are higher the winter months the airfrompollution
space
problem. A hypothetical
heating needs [17] along case withisa illustrated
lowering ininmixing
Table 1height,
for what couldcompounding
further be the changes theinair
thepollution
overall
pollution when the city size expands, emissions halve or double, or for changes
problem. A hypothetical case is illustrated in Table 1 for what could be the changes in the overall in the meteorological
conditions.
pollution when All the
thecalculations assumeemissions
city size expands, a steady state
halvecondition.
or double,The worst-case
or for changes in scenario is when the
the meteorological
emissions double and the mixing height drops to a quarter of the norm,
conditions. All the calculations assume a steady state condition. The worst-case scenario is resulting in a 700% increase
when thein
the overall double
emissions pollution.andDuring
the mixingthe winter
height haze
dropsepisodes,
to a quarter areasof between
the norm,Punjab, Haryana,
resulting in a 700% and Delhi
increase
experience these conditions [18,19]—emissions nearly double compared to
in the overall pollution. During the winter haze episodes, areas between Punjab, Haryana, and Delhi summer months with the
addition of agricultural residue burning and the onset of winter season
experience these conditions [18,19]—emissions nearly double compared to summer months with the requiring more biomass and
coal combustion
addition to support
of agricultural space burning
residue heating, with a simultaneous
and the onset of winter dropseason
in the surface
requiringandmore
air temperatures.
biomass and
Typical
coal combustion to support space heating, with a simultaneous drop in the surface mand
day-time mixing layer heights are 1000–2000 m in the summer months and 100–200 in the
air
winter months. Typical night-time heights are half of this.
temperatures. Typical day-time mixing layer heights are 1000–2000 m in the summer months and
100–200 m in the winter months. Typical night-time heights are half of this.
Table 1. A hypothetical pollution calculation for a city using a steady state box model method.
W = width of the city; L = length of the city; H = mixing height; E = emissions.
Table 1. A hypothetical pollution calculation for a city using a steady state box model method. W =
width of Study
the city;
andL =Institution
length of the city; H = mixing
W height;
L E = emissions.
H E Pollution %Change
Study
Base case, and
all asInstitution
usual 1.0 W
1.0 L 1.0 H 1.0E Pollution
1.0 %Change
0%
City size doubles in width and length and no
Base 2.0 2.0 1.0 1.0 1.0 1.0 0.25 −75%
change in case, all as usual
the emissions 1.0 1.0 1.0 0%
Emission doubles,
City size doubleseverything
in widthelse
andis length
the same 1.0
and no 1.0 1.0 2.0 2.0 +100%
2.0 2.0 1.0 1.0 0.25 −75%
change
Mixing height in the
doubles, emissions
everything else is
1.0 1.0 2.0 1.0 0.5 −50%
the same
Emission doubles, everything else is the same 1.0 1.0 1.0 2.0 2.0 +100%
Mixing height halves, everything else is
1.0 1.0 0.5 1.0 2.0 +100%
the same
Mixing height doubles, everything else is the same 1.0 1.0 2.0 1.0 0.5 −50%
Emission doubles and mixing height halves 1.0 1.0 0.5 2.0 4.0 +300%
Mixing height
Emission halves,
doubles andeverything elseisis the same
mixing height 1.0 1.0 0.5 1.0 2.0 +100%
1.0 1.0 0.25 2.0 8.0 +700%
one quarter
Emission halves and everything else is
1.0 1.0 1.0 0.5 0.5 −50%
the same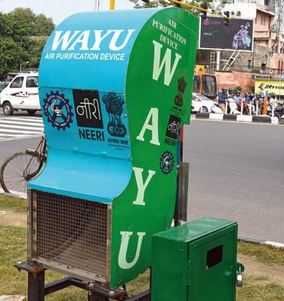
Atmosphere 2020, 11, 922                                                                                                4 of 11

     Mathematically, for a given set of seasonal patterns in meteorology, especially over the
Indo-Gangetic plain, the best option is to cut the emissions at the sources and disperse the emissions to
 Atmosphere 2020, 11, x FOR PEER REVIEW                                                             5 of 13
farther distances via better urban planning.
 2.2. Physics
2.2. Physics
       Physics relates to the “movement” of the problem. A popular saying is that “pollution knows no
      Physics relates to the “movement” of the problem. A popular saying is that “pollution knows
 boundaries”. The box model assuming closed walls in Figure 2 and Table 1 is good to illustrate the
no boundaries”. The box model assuming closed walls in Figure 2 and Table 1 is good to illustrate
 point that emissions are key for any increase and decrease in pollution levels. Simultaneously,
the point that emissions are key for any increase and decrease in pollution levels. Simultaneously,
 meteorology plays an important role in determining how much of those emissions stay in the box,
meteorology plays an important role in determining how much of those emissions stay in the box,
 determined by the horizontal wind components (U and V), or how much of those emissions will stay
determined by the horizontal wind components (U and V), or how much of those emissions will stay
 close to the surface, determined by the vertical wind component (W) (Figure 3).
close to the surface, determined by the vertical wind component (W) (Figure 3).

                               Figure 3. Three-dimensional motion of air through a city.
                               Figure 3. Three-dimensional motion of air through a city.
       This adds two new dimensions to the air pollution problem: (a) the air is not static over the
       This adds two new dimensions to the air pollution problem: (a) the air is not static over the city—
city—between wind speeds of 1 m/s and 2 m/s, the latter is pushing twice the amount of air through the
 between wind speeds of 1 m/s and 2 m/s, the latter is pushing twice the amount of air through the
city boundaries; (b) the air from outside the boundary carries outside emissions, which add to the total
 city boundaries; (b) the air from outside the boundary carries outside emissions, which add to the
emissions inside the city. Similarly, emissions from inside the city will be carried to a city downwind.
 total emissions inside the city. Similarly, emissions from inside the city will be carried to a city
This is called “long-range transport” of pollution—sometimes this is an exchange of pollution between
 downwind. This is called “long-range transport” of pollution—sometimes this is an exchange of
the cities and sometimes between the states. For example, a city like Delhi is surrounded by satellite
 pollution between the cities and sometimes between the states. For example, a city like Delhi is
cities Gurugram (from the state of Haryana) in the West and Noida (from the state of Uttar Pradesh)
 surrounded by satellite cities Gurugram (from the state of Haryana) in the West and Noida (from the
in the East. There is constant movement of vehicles between these cities and in a map of urban
 state of Uttar Pradesh) in the East. There is constant movement of vehicles between these cities and
built-up area, it is difficult to draw a closed box [20]. In this case, depending on the wind direction,
 in a map of urban built-up area, it is difficult to draw a closed box [20]. In this case, depending on the
emissions from each of these cities are affecting the others downwind.
 wind direction, emissions from each of these cities are affecting the others downwind.
       The effect of long-range transport is also prominent during the seasonal dust storms (May–June)
originating    from
       The effect   ofthe   Middle transport
                        long-range     East or the is Thar   desert in the
                                                      also prominent           statethe
                                                                           during      of seasonal
                                                                                          Rajasthan    [21],
                                                                                                     dust    and agricultural
                                                                                                          storms    (May–June)
residue   burning
 originating    from(April–May
                        the Middleand     October–November)
                                        East or the Thar desertoriginating
                                                                        in the statemostly     from the[21],
                                                                                        of Rajasthan     states of agricultural
                                                                                                              and   Punjab and
Haryana
 residue burning (April–May and October–November) originating mostly from the states emissions
           [22].   In  both  cases,  seasonal   wind    speeds    are  high  enough     to pick   up  and push   the  of Punjab
into
 and the   higher[22].
       Haryana       altitudes,
                          In bothsupport     inter-state
                                     cases, seasonal         transport,
                                                          wind    speeds and      affectenough
                                                                            are high      the pollution
                                                                                                    to picklevels
                                                                                                             up and downwind.
                                                                                                                       push the
The   overall into
 emissions    known   thehorizontal    advectionsupport
                           higher altitudes,        and vertical    mixingtransport,
                                                              inter-state     schemes are   andmore  complex
                                                                                                  affect       than described
                                                                                                         the pollution    levels
in  this paper.
 downwind. The overall known horizontal advection and vertical mixing schemes are more complex
 thanGuttikunda
        described in  etthis
                         al. (2019)
                              paper.[16] presents an analysis for 20 Indian cities, documenting contributions of
emissions inside and outside the city airsheds. On average, 30% of the pollution observed in these cities
       Guttikunda
originates   outsideetthe al. city
                              (2019)   [16] presents
                                   limits.  For citiesan in analysis
                                                            North India for 20  Indian
                                                                             like        cities, Amritsar,
                                                                                   Ludhiana,     documenting andcontributions
                                                                                                                  Chandigarh,
 of  emissions   inside   and    outside  the  city  airsheds.    On   average,
the long-range transport contribution is more than 50% on an annual basis.         30%   of the  pollution   observed   in these
 citiesThe
         originates     outside    the  city  limits.   For   cities   in  North    India    like
            movement of the pollution also includes scavenging—dry deposition when the pollutants  Ludhiana,    Amritsar,   and
 Chandigarh,      the  long-range     transport   contribution      is  more   than   50%   on
are in contact with a surface and wet deposition during the rains. The dry deposition rates for an  annual   basis.
variousThepollutants
            movement     areofdetermined
                                the pollutionby also
                                                 the surface
                                                       includes  roughness,
                                                                   scavenging—drysoil moisture    content,
                                                                                           deposition       andthe
                                                                                                         when     wind  speeds.
                                                                                                                     pollutants
are in contact with a surface and wet deposition during the rains. The dry deposition rates for various
pollutants are determined by the surface roughness, soil moisture content, and wind speeds. Under
windy conditions and over dry surfaces, we have lesser deposition of the particulates, and vice versa
on the trees with enough moisture on the leaves.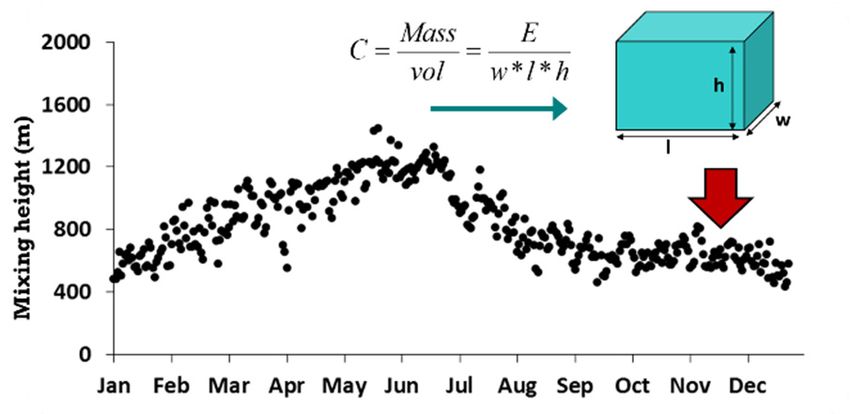
Atmosphere 2020, 11, 922 5 of 11
Under windy conditions and over dry surfaces, we have lesser deposition of the particulates, and vice
Atmosphere 2020, 11, x FOR PEER REVIEW 6 of 13
versa on the trees with enough moisture on the leaves.
2.3. Chemistry
2.3. Chemistry
Chemistry relates to the “composition” of the problem—the critical one of the three sciences, as
Chemistry relates to the “composition” of the problem—the critical one of the three sciences,
it links PM2.5, PM10, SO2, NO2, CO and ozone directly to all known health impacts. Of the six
as it links PM2.5 , PM10 , SO2 , NO2 , CO and ozone directly to all known health impacts. Of the six
pollutants, the most critical is PM2.5, and its chemical composition is different in space and time
pollutants, the most critical is PM2.5 , and its chemical composition is different in space and time [23,24].
[23,24]. While the first five pollutants are part of direct emissions, ozone is a secondary compound
While the first five pollutants are part of direct emissions, ozone is a secondary compound formed in
formed in the atmosphere in the presence of NOx and hydrocarbons.
the atmosphere in the presence of NOx and hydrocarbons.
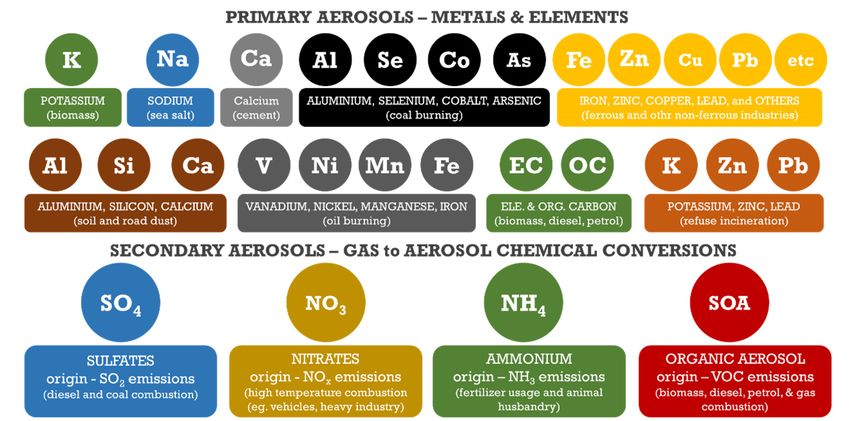
AA sample
sampleof ofPMPM2.52.5can
canprovide
provide information
information not
not only
only ononhowhowmuchmuch pollution
pollution there
there is, but
is, but alsoalso
on
on the fuel origins of the mass on the filter. Figure 4 presents a summary
the fuel origins of the mass on the filter. Figure 4 presents a summary of the key marker metals, of the key marker metals,
elements, and
elements, and compounds
compounds associated
associated with with major
major sources.
sources. There
There areare overlaps
overlaps between
between the the sources
sources
and the ratio of the markers also vary significantly, which allows for statistically
and the ratio of the markers also vary significantly, which allows for statistically apportioning source apportioning source
contributions. These markers range from metals from direct combustion of
contributions. These markers range from metals from direct combustion of fuels, like coal and diesel,fuels, like coal and diesel,
to contributions
to contributionsfrom fromother gases,
other likelike
gases, SO2 SOforming sulphate
2 forming aerosols
sulphate (in a series
aerosols (in aofseries
reactions
of involving
reactions
ozone and some intermediate radicals),
involving ozone and some intermediate radicals), NO x forming nitrate aerosols and hydrocarbons
NOx forming nitrate aerosols and hydrocarbons forming
secondary
forming organic aerosols
secondary (via 500+
organic aerosols known
(via reactions
500+ known with ozone
reactions withandozoneintermediate radicals)
and intermediate [25,26].
radicals)
Ozone is a by-product of these 500+ reactions. Most of the chemical transformation
[25,26]. Ozone is a by-product of these 500+ reactions. Most of the chemical transformation between between gases
and aerosols takes place during the long-range transport—in other words,
gases and aerosols takes place during the long-range transport—in other words, a significant portion a significant portion of
thethe
of PM PM2.52.5samples
samplescollected
collectedininthe thecity
cityare
arethere
therebecause
because ofof the
the emissions
emissions originating outside the
originating outside the
city [16]. The secondary nature of the PM originating from sources not likely within
city [16]. The secondary nature of the PM2.52.5originating from sources not likely within a city boundary, a city boundary,
complicates the
complicates the overall
overall pollution
pollution control
control strategy.
strategy.
Figure
Figure 4.
4. Key
Key metal
metal and
and ion
ion markers
markers of
of various
various sources
sources contributing to PM
contributing to PM2.5
2.5. .
3. Do
3. DoSmog
SmogTowers
Towers Work?
Work?
For managing
For managingoutdoor
outdoorairairpollution,
pollution,thetheanswer
answeris is still
still “no”.
“no”. Atmospheric
Atmospheric science
science defines
defines the the
air
air pollution problem as (a) a dynamic situation where the air is moving at
pollution problem as (a) a dynamic situation where the air is moving at various speeds with no various speeds with no
boundaries, and
boundaries, and (b)
(b) aacomplex
complex mixture
mixture of
of chemical
chemical compounds
compounds constantly
constantly forming
forming andand transforming
transforming
into other compounds. With no boundaries, it is unscientific to assume that
into other compounds. With no boundaries, it is unscientific to assume that one can trap air, one can trap air,clean
cleanit,
it,
and release
and release into
into the same atmosphere simultaneously. Expecting Expecting filtering
filtering units
units to
to provide
provide any
any
noticeable results
noticeable results at
at the
the community
community level
level is
is unrealistic.
unrealistic. This
This isis illustrated
illustrated in
in a back-of-the-envelope
back-of-the-envelope
calculation for
calculation for Delhi
Delhi (Table
(Table 2)
2) using two pilots under consideration,
consideration, (a) (a) T1: aa smog
smog tower
tower inin Xi’an
Xi’an
(China) designed to filter 10 million m3 of air every day; (b) T2: a smaller version of T1 piloted in
Delhi’s Lajpat number market in January 2020, with a capacity of 600,000 m3/day.
For these calculations, we considered Delhi’s airshed, including its satellite cities Gurugram,
Noida, Greater Noida, Ghaziabad, Faridabad, and Rohtak, covering an area of 7000 sq.km (~84 km ×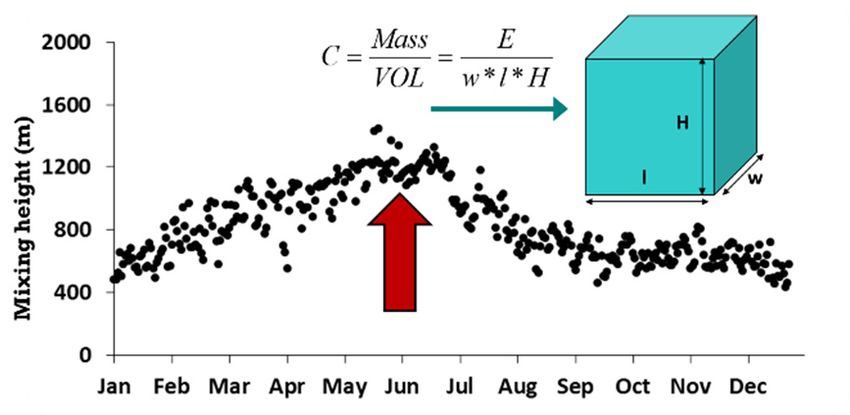
Atmosphere 2020, 11, 922                                                                                                                                         6 of 11

(China) designed to filter 10 million m3 of air every day; (b) T2: a smaller version of T1 piloted in
Delhi’s Lajpat number market in January 2020, with a capacity of 600,000 m3 /day.

                Table 2. Outdoor air pollution filtering efficiency of the smog towers in Delhi’s airshed.

                   Variable                               Delhi’s Airshed                 T1: Xi’an Smog Tower                      T2: Delhi’s 2020 Pilot
      Filtering capacity under full
                                                                                                        400,000                                  25,000
         implementation (m3 /h)
    Average airshed volume (m3 /h),                  1,209,600 million in the
     calculated using inputs from                    summer 120,960 million
                Table 3                                   in the winter
                                                                                          0.000033% in the summer                  0.000002% in the summer
   Filtering efficiency as the amount
                                                                                             and 0.00033% in the                      and 0.00002% in the
        of air filtered in one hour
                                                                                                   winter                                   winter
                                                                                            3,024,000 units in the                  50,000,000 units in the
     Number of towers required at
                                                                                            summer and 302,400                      summer and 5,000,000
            full capacity
                                                                                             units in the winter                      units in the winter
                                                     The Supreme Court of
                                                                                                                                      INR 700,000 (~USD
                                                     India allocated INR 36               Unknown; reported pilot
                   Unit cost                                                                                                       10,000) + operations and
                                                    crores (~USD 5.2 million)              cost is USD 10 million
                                                                                                                                         maintenance
                                                       for replication of T1
      Required capital cost for full
                                                                                             USD 15,725 billion                         USD 500 billion
       implementation in Delhi
         Required operations and
         maintenance costs for full                                                                     HIGH                                     HIGH
         implementation in Delhi

      Table 3. Summary of all day (AD), daytime (DT), and nighttime (NT) averages (± standard deviations)
      of mixing heights (MH in m), near surface temperature (T in ◦ C), and near surface wind speeds (WS in
      m/s) by month. Data is extracted from Weather Research Forecasting (WRF) model simulations using
      the National Centers for Environmental Prediction (NCEP) reanalysis fields for the year 2018.
 Variable   January      February      March         April        May          June          July         August      September     October      November December
 MH–AD      298 ± 58     516 ± 94     926 ± 198    1075 ± 254   1243 ± 307   1054 ± 244    573 ± 240     505 ± 152    462 ± 123     501 ± 91      350 ± 73     286 ± 71
 MH–DT      557 ± 118    974 ± 187    1801 ± 393   2066 ± 501   2377 ± 640   1855 ± 485    994 ± 450     906 ± 269    827 ± 239     959 ± 184     651 ± 129    534 ± 140
 MH–NT       39 ± 8       57 ± 56      51 ± 18      84 ± 45      109 ± 60    254 ± 124     153 ± 85      104 ± 58     97 ± 105       43 ± 13       50 ± 33      38 ± 8
  T–DT      18.9 ± 1.8   24.2 ± 2.8   30.5 ± 2.6   35.5 ± 2.4   39.4 ± 2.7   39.0 ± 3.2    33.9 ± 2.9    33.0 ± 2.1   31.4 ± 2.2    30.0 ± 1.6    25.3 ± 1.5   18.8 ± 2.2
  T–NT      9.9 ± 1.5    15.3 ± 2.5   19.6 ± 1.8   26.3 ± 2.2   31.1 ± 1.8   34.0 ± 2.3    30.6 ± 2.1    29.3 ± 1.3   26.5 ± 1.1    21.8 ± 1.8    17.5 ± 1.9   11.1 ± 2.8
 WS–AD      2.7 ± 0.7    2.8 ± 0.9     3.1 ± 0.6    3.8 ± 0.8    3.7 ± 0.9    4.5 ± 1.2    3.1 ± 0.7     2.7 ± 0.7    2.8 ± 0.9     2.5 ± 0.5     2.7 ± 0.7    2.4 ± 0.6

      For these calculations, we considered Delhi’s airshed, including its satellite cities Gurugram, Noida,
Greater Noida, Ghaziabad, Faridabad, and Rohtak, covering an area of 7000 sq.km (~84 km × 84 km).
Table 3 presents a summary of mixing heights, near surface temperature, and wind speeds for the
year 2018. The average wind speed in the domain is 4 m/s (=14.4 km/h) in the summer months and
2 m/s (=7.2 km/h) in the winter months. Similarly, the average mixing heights are 1000 m and 200 m,
respectively. This translates to an average exchange of 1,209,600 million m3 /h and 120,960 million
m3 /h of air in the summer and winter months, respectively (city side * speed * mixing height)—this
calculation assumes a steady state with constant flow of air and no vertical mixing.
      The concept of vacuum cleaning has worked in closed environments. For example, (a) in a closed
room, if the doors and windows remain shut, then an air purifier is an efficient way to clean the
air [27]. This emulates a box model containing a constant amount of air with limited movement.
When purifying the closed room, all the dust is collected on a filter, which requires either cleaning or
replacement after some time, and a clean disposal of the dust collected. During high pollution days,
the frequency of cleaning and replacement is more (b) at the end of a combustion unit, with flue gas
moving at a constant flow rate in one direction, like a power plant boiler with a chimney. The system
will include an inlet for polluted air and an outlet for cleaned air. This system is designed to trap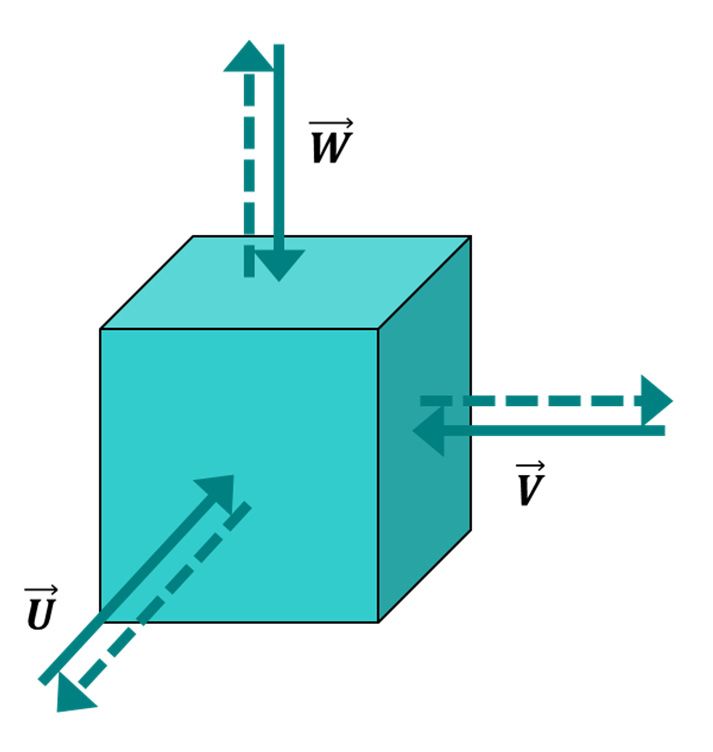
Atmosphere 2020, 11, 922                                                                               7 of 11

emissions at the source, before entering the atmosphere at the top of the chimney. In this case, all the
dust (fly ash) from the cyclone bags or electrostatic precipitators or filters also need clean collection and
disposal [28]. (c) In a subway tunnel, where the air flow is limited and prone to increased exposure
levels, a purifier will induce an artificial air flow, diluting the incoming air, and thus reducing the
overall exposure levels. None of these examples present the use of filtering systems to clean the
air permanently.
     In an outdoor environment, at best these systems are a demonstration of a filtering system with
negligible efficiencies (Table 2), whose performance at a power plant, or at any of the end of the pipe
applications where the emissions originate, is the most efficient.

4. Taking a Long View on Air Quality Management
     The air pollution problem in India is year-round [29,30]. The winter months (November,
December, January, and February) are the worst, with stagnant meteorology stifling the lateral and
vertical movement of pollution, low temperatures pushing the need for space heating, which is
mostly met using biomass [17], and some seasonal emissions from agricultural residue burning [22].
These are in addition to the all-year combustion of petrol, diesel, gas, coal, and waste in the transport,
industrial, and domestic sectors, and resuspended from the construction activities and traffic on the
roads. The monsoon months (June, July, and August) are the best, with enhanced wet scavenging
across the country.
     The air pollution problem in India is not limited to the cities. An analysis of annual average
PM2.5 concentrations, using a combination of satellite retrievals and global emission inventories for the
period of 1998–2018, suggests that 60% of the districts do not meet the national ambient standard of
40 µg/m3 and 98% do not meet the WHO guideline of 10 µg/m3 [31]. Typically, North Indian districts
are more adversely affected from chronic air pollution.
     The judicial system played a central role in several air pollution decisions in India:
•    In 1998, the Supreme Court ruled to convert public transport buses and para-transit vehicles to
     run on compressed natural gas (CNG). This was a public interest litigation, which also led to
     other emission control measures in Delhi [32,33]. CNG conversion was the most successful for
     the transport sector and, in the early 2000s, the city of Delhi witnessed a reduction in emissions
     and pollution. However, the scale of replacement has not been replicated in any other Indian city
     since, and the overall bus fleet composition in Delhi has remained the same irrespective of the
     growing demand [34].
•    In 2015, three toddlers filed a public interest ligation in the Supreme Court of India, to request
     a full ban on the sale of fireworks. In an apparent victory for cleaner air, in November 2016,
     the Court ordered a complete ban on the sale of firecrackers in the NCR. What seemed to be a
     progressive measure was, however, annulled by a ‘temporary’ ruling, when the ban was lifted
     with the caveat that the ban will be reinstituted if there is evidence that fireworks are a major
     pollutant during the festive season.
•    In 2018, the Supreme Court ruled in favour of the introduction of BS-VI standard vehicles
     nationwide, starting 1 April 2020, instead of the original plan for 2025 under the auto fuel policy.
•    In 2019, the Supreme Court ruled in favour of an immediate ban on the use of pet coke (with high
     sulphur content) in all industries in the NCR by June 2019.
     Time and again, judicial interventions have resulted in putting pressure on the respective agencies
to implement long-term measures for long-term benefits.
     Non-judicial interventions proposed and implemented for improving air quality and health are:
•    In 2015, the Government of India launched the smart cities program for 100 cities. While air
     quality was not explicitly mentioned as the environment indicator, the proposed activities were
     designed to benefit overall air quality. These included a ranking system to evaluate the waste
     management programs, road cleaning, and street greening in the cities.
Atmosphere 2020, 11, 922 8 of 11
• In December 2016, Delhi proposed the Graded Responsibility Action Plan (GRAP), a series
of measures to enforce under poor, very poor, severe and emergency levels of pollution [35].
These decisions are made based on a 48-h running average of the air quality index, calculated using
hourly PM2.5 and PM10 levels. This plan is now an example for other cities in the Indo-Gangetic
Plain to replicate. A missing link in the program is an independent body with teeth to clamp
down on offending polluters across states.
• The Ministry of Petroleum and Natural Gas took an important first step with the Pradhan Mantri
Ujjwala Yojana (PMUY) in 2016, providing liquified petroleum gas (LPG) connections to the
poorest households. As of September 2019, the PMUY has connected 80 million beneficiaries by
directly transferring subsidies to the bank accounts of women in these households and improving
indoor and outdoor health [36]. While the number of connections is on the rise, there are barriers
to LPG uptake, which need to be addressed [37].
• In April 2015, a parliamentary standing committee proposed new emission standards for all the
coal-fired thermal power plants. These standards were ratified in December 2015, tightening the
standards for PM and introducing standards for SO2 , NOx , and mercury for the first time.
If implemented in full, these standards are expected to yield a 50% drop in the PM2.5 (primary
and secondary) pollution from these plants [38,39]. All the power plants are expected to comply
in 2022.
• Financial support from the Government of India for the Faster Adoption and Manufacturing
of Electric Vehicles (FAME) program, made electric vehicles (EVs) a new policy and economic
choice for small- and large-scale applications. The program now includes subsides for two-,
three-, and four-wheelers and the introduction of EV buses into the public transportation system.
The Delhi transport corporation is expected to receive its first 1000 buses in 2021–2022 and the
Delhi government is promoting EVs to account for 25% of new registrations by 2024.
In 2019, the Ministry of Environment, Forest and Climate Change (MoEFCC) announced the
National Clean Air Programme (NCAP) for 122 non-attainment cities from 20 states and three union
territories [40]. Under the NCAP, every city is required to prepare a list of actions necessary to
reduce their PM2.5 levels by 20–30%, compared to 2017, by 2024. The authors of [41] present a review
of these action plans, summarizing the key action points that all the cities want to implement as:
(a) augmenting public transport, (b) eradicating road and construction dust, (c) abolishing open waste
burning, (d) promoting clean cooking, (e) implementing industrial emission standards, (f) increasing
ambient monitoring capacity, and (g) raising public awareness. While improving ambient monitoring
capacity and raising public awareness are short-term activities (with long-term maintenance), all others
are part of long-term planning, designed to reduce emissions at the sources.
Following the approval of the 102 NCAP city action plans by MoEFCC, the prevalence of
pollution episodes in October–November 2019, and limited action in the cities to counter air pollution,
the Supreme Court bench again intervened to demand the installation of smog towers and allocated
INR 36 crores (~USD 5.2 million) for the replication of the Xi’an’s smog tower design in Delhi. In
August 2020, a memorandum of understanding was signed by the Indian Institute of Technology
(Bombay) to design and construct the system. Wasting the judicial power by implementing band aid
measures is not only unscientific, but also a waste of limited financial and technical resources. We
cannot vacuum our way to “clean air”.
5. Conclusions
The city clean air action plans provide proof that there is enough technical know-how on how
much air pollution there is, the key sectors that need attention, the institutional requirements to
implement long-term strategies, and the ways in which they can be addressed [40,41]. These action
plans need institutional and financial support. At the institutional level, there are three tasks that
need immediate attention, where the judiciary can help to move the strategies forward: (1) Personnel
and Capacity— CPCB and the state pollution control boards are too understaffed to perform auditoryAtmosphere 2020, 11, 922 9 of 11
and scientific operations. (2) Monitoring infrastructure—as of June 2020, there are 230 continuous
monitoring stations operated and maintained by CPCB in 124 (of 715) districts. More than half of these
districts have only one station and 70 monitors are in the vicinity of the NCR, which demonstrates
the bias in measuring and managing air pollution outside the big cities like Delhi. To spatially and
temporally represent the air pollution problem, India requires at least 4000 continuous air quality
monitoring systems (2800 in the urban areas and 1200 in the rural areas). (3) Information support—air
quality management requires information on emission loads, source contributions, costs and benefits of
interventions, and a way to prioritize actions. The funds allocated by the Supreme Court for temporary
interventions like testing smog towers are most useful for implementing these permanent solutions.
Supplementary Materials: The following are available online at http://www.mdpi.com/2073-4433/11/9/922/s1,
Table S1: Summary of air quality in 124 cities in India for the periods before and during the 4 COVID-19 lockdowns.
Author Contributions: Conceptualization, writing, and editing—S.G. and P.J.; Methodology, resources,
and visualization—S.G. All authors have read and agreed to the published version of the manuscript.
Funding: This research received no external funding.
Conflicts of Interest: The authors declare no conflict of interest.
References
1. GBD. Global Burden of Disease. Available online: https://vizhub.healthdata.org/gbd-compare/ (accessed on
29 July 2020).
2. Chowdhury, S.; Dey, S. Cause-specific premature death from ambient PM2.5 exposure in India:
Estimate adjusted for baseline mortality. Environ. Int. 2016, 91, 283–290. [CrossRef] [PubMed]
3. Ghude, S.D.; Chate, D.M.; Jena, C.; Beig, G.; Kumar, R.; Barth, M.C.; Pfister, G.G.; Fadnavis, S.; Pithani, P.
Premature mortality in India due to PM2.5 and ozone exposure. Geophys. Res. Lett. 2016, 43, 4650–4658.
[CrossRef]
4. Balakrishnan, K.; Dey, S.; Gupta, T.; Dhaliwal, R.S.; Brauer, M.; Cohen, A.J.; Stanaway, J.D.; Beig, G.; Joshi, T.K.;
Aggarwal, A.N.; et al. The impact of air pollution on deaths, disease burden, and life expectancy across the
states of India: The Global Burden of Disease Study 2017. Lancet Planet. Health 2019, 3, e26–e39. [CrossRef]
5. Saini, P.; Sharma, M. Cause and Age-specific premature mortality attributable to PM2.5 Exposure: An analysis
for Million-Plus Indian cities. Sci. Total Environ. 2020, 710, 135230. [CrossRef]
6. Sahu, S.K.; Sharma, S.; Zhang, H.; Chejarla, V.; Guo, H.; Hu, J.; Ying, Q.; Xing, J.; Kota, S.H. Estimating ground
level PM2.5 concentrations and associated health risk in India using satellite based AOD and WRF predicted
meteorological parameters. Chemosphere 2020, 255, 126969. [CrossRef]
7. WIRE. India: Why Was Daytime Ozone Pollution Higher During the Lockdowns? Available online:
https://science.thewire.in (accessed on 29 July 2020).
8. CPCB. Impact of Lockdowns 25th March to 15th April on Air Quality. In Central Pollution Control Board,
Ministry of Environmental Forests and Climate Change; The Government of India: New Delhi, India, 2020.
9. Adhikari, A.; Yin, J. Short-Term Effects of Ambient Ozone, PM2.5 , and Meteorological Factors on COVID-19
Confirmed Cases and Deaths in Queens, New York. Int. J. Environ. Res. Public Health 2020, 17, 4047.
[CrossRef]
10. Wu, X.; Nethery, R.C.; Sabath, B.M.; Braun, D.; Dominici, F. Exposure to air pollution and COVID-19 mortality
in the United States: A nationwide cross-sectional study. medRxiv 2020. [CrossRef]
11. Berman, J.D.; Ebisu, K. Changes in U.S. air pollution during the COVID-19 pandemic. Sci. Total Environ.
2020, 739, 139864. [CrossRef]
12. Marlier, M.E.; Xing, J.; Zhu, Y.; Wang, S. Impacts of COVID-19 response actions on air quality in China.
Environ. Res. Commun. 2020, 2, 075003. [CrossRef]
13. Filippini, T.; Rothman, K.J.; Goffi, A.; Ferrari, F.; Maffeis, G.; Orsini, N.; Vinceti, M. Satellite-detected
tropospheric nitrogen dioxide and spread of SARS-CoV-2 infection in Northern Italy. Sci. Total Environ. 2020,
739, 140278. [CrossRef]
14. Cyranoski, D. China tests giant air cleaner to combat smog. Nature 2018, 555, 7695. [CrossRef] [PubMed]
15. DST. DST’s Initiatives Tackle Air Pollution Hazard—Wind Augmentation and Air Purifying Unit (WAYU);
Department of Science and Technology, The Government of India: New Delhi, India, 2018.Atmosphere 2020, 11, 922 10 of 11
16. Guttikunda, S.K.; Nishadh, K.A.; Jawahar, P. Air pollution knowledge assessments (APnA) for 20 Indian
cities. Urban. Clim. 2019, 27, 124–141. [CrossRef]
17. Chowdhury, S.; Dey, S.; Guttikunda, S.; Pillarisetti, A.; Smith, K.R.; Di Girolamo, L. Indian annual ambient
air quality standard is achievable by completely mitigating emissions from household sources. Proc. Natl.
Acad. Sci. USA 2019, 116, 10711–10716. [CrossRef] [PubMed]
18. Liu, T.; Marlier, M.E.; Karambelas, A.; Jain, M.; Singh, S.; Singh, M.K.; Gautam, R.; DeFries, R.S.
Missing emissions from post-monsoon agricultural fires in northwestern India: Regional limitations
of MODIS burned area and active fire products. Environ. Res. Commun. 2019, 1, 011007. [CrossRef]
19. Saikawa, E.; Panday, A.; Kang, S.; Gautam, R.; Zusman, E.; Cong, Z.; Somanathan, E.; Adhikary, B.
Air Pollution in the Hindu Kush Himalaya. In The Hindu Kush Himalaya Assessment: Mountains, Climate Change,
Sustainability and People; Wester, P., Mishra, A., Mukherji, A., Shrestha, A.B., Eds.; Springer International
Publishing: Cham, Switzerland, 2019; pp. 339–387. [CrossRef]
20. Goel, R.; Guttikunda, S.K. Evolution of on-road vehicle exhaust emissions in Delhi. Atmos. Environ. 2015,
105, 78–90. [CrossRef]
21. Sarkar, S.; Chauhan, A.; Kumar, R.; Singh, R.P. Impact of Deadly Dust Storms (May 2018) on Air Quality,
Meteorological, and Atmospheric Parameters Over the Northern Parts of India. GeoHealth 2019, 3, 67–80.
[CrossRef] [PubMed]
22. Jethva, H.; Chand, D.; Torres, O.; Gupta, P.; Lyapustin, A.; Patadia, F. Agricultural Burning and Air Quality
over Northern India: A Synergistic Analysis using NASA’s A-train Satellite Data and Ground Measurements.
Aerosol Air Qual. Res. 2018, 18, 1756–1773. [CrossRef]
23. Pathak, A.K.; Sharma, M.; Nagar, P.K. A framework for PM2.5 constituents-based (including PAHs) emission
inventory and source toxicity for priority controls: A case study of Delhi, India. Chemosphere 2020, 255, 126971.
[CrossRef]
24. Van Donkelaar, A.; Martin, R.V.; Li, C.; Burnett, R.T. Regional Estimates of Chemical Composition of Fine
Particulate Matter Using a Combined Geoscience-Statistical Method with Information from Satellites, Models,
and Monitors. Environ. Sci. Technol. 2019, 53, 2595–2611. [CrossRef]
25. SAPRC-18. The SAPRC-18 Atmospheric Chemical Mechanism; University of California: Riverside, CA, USA;
Available online: https://intra.engr.ucr.edu/~{}carter/SAPRC/18/ (accessed on 29 July 2020).
26. Stockwell, W.R.; Saunders, E.; Goliff, W.S.; Fitzgerald, R.M. A perspective on the development of gas-phase
chemical mechanisms for Eulerian air quality models. J. Air Waste Manag. Assoc. 2020, 70, 44–70. [CrossRef]
27. Vyas, S.; Srivastav, N.; Spears, D. An experiment with air purifiers in Delhi during Winter 2015–2016.
PLoS ONE 2016, 11, e0167999. [CrossRef] [PubMed]
28. Nihalani, S.; Mishra, Y.; Meeruty, A. Handling and utilisation of fly ash from thermal power plants. In Circular
Economy and Fly Ash Management; Springer: Berlin/Heidelberg, Germany, 2020; pp. 1–11.
29. Pant, P.; Lal, R.M.; Guttikunda, S.K.; Russell, A.G.; Nagpure, A.S.; Ramaswami, A.; Peltier, R.E.
Monitoring particulate matter in India: Recent trends and future outlook. Air Qual. Atmos. Health
2019, 12, 45–58. [CrossRef]
30. Guttikunda, S.K.; Goel, R.; Pant, P. Nature of air pollution, emission sources, and management in the Indian
cities. Atmos. Environ. 2014, 95, 501–510. [CrossRef]
31. Hammer, M.S.; van Donkelaar, A.; Li, C.; Lyapustin, A.; Sayer, A.M.; Hsu, N.C.; Levy, R.C.; Garay, M.J.;
Kalashnikova, O.V.; Kahn, R.A.; et al. Global Estimates and Long-Term Trends of Fine Particulate Matter
Concentrations (1998–2018). Environ. Sci. Technol. 2020, 54, 7879–7890. [CrossRef]
32. Narain, U.; Bell, R.G. Who changed Delhi’s air? Econ. Political Wkly. 2006, 1584–1588. [CrossRef]
33. Mehta, R. History, Politics, and Technology of CNG-Diesel Bus Switch in Delhi. In Proceedings of the
Transportation, Land Use, and Environment Workshop Held in Pune, India; Central Institute of Road Transport:
Pune, India, 2001; p. 151.
34. Goel, R.; Guttikunda, S.K. Role of urban growth, technology, and judicial interventions on vehicle exhaust
emissions in Delhi for 1991–2014 and 2014–2030 periods. Environ. Dev. 2015, 14, 6–21. [CrossRef]
35. WIRE. How Do We Improve Delhi’s Graded Responsibility Action Plan for Better Air Quality?
Available online: https://science.thewire.in (accessed on 10 August 2020).
36. Pillarisetti, A.; Ghorpade, M.; Madhav, S.; Dhongade, A.; Roy, S.; Balakrishnan, K.; Sankar, S.; Patil, R.;
Levine, D.I.; Juvekar, S.; et al. Promoting LPG usage during pregnancy: A pilot study in rural Maharashtra,
India. Environ. Int. 2019, 127, 540–549. [CrossRef] [PubMed]Atmosphere 2020, 11, 922 11 of 11
37. Gupta, A.; Vyas, S.; Hathi, P.; Khalid, N.; Srivastav, N.; Spears, D.; Coffey, D. Persistence of Solid Fuel Use in
Rural North India. Econ. Political Wkly. 2020, 55, 55.
38. Guttikunda, S.; Jawahar, P.; Goenka, D. Regulating air pollution from coal-fired power plants in India.
Econ. Political Wkly. 2015, 50, 62–67.
39. Cropper, M.L.; Guttikunda, S.; Jawahar, P.; Lazri, Z.; Malik, K.; Song, X.-P.; Yao, X. Applying Benefit-Cost
Analysis to Air Pollution Control in the Indian Power Sector. J. Benefit Cost Anal. 2018, 10, 185–205. [CrossRef]
40. NCAP. National Clean Air Programme. In Central Pollution Control Board; Ministry of Environmental Forests
and Climate Change, The Government of India: New Delhi, India, 2019.
41. Ganguly, T.; Kurinji, L.S.; Guttikunda, S. How robust are urban India’s clean air plans. In An Assessment of
102 Plans; Council on Energy, Environment and Water: New Delhi, India, 2020.
© 2020 by the authors. Licensee MDPI, Basel, Switzerland. This article is an open access
article distributed under the terms and conditions of the Creative Commons Attribution
(CC BY) license (http://creativecommons.org/licenses/by/4.0/).You can also read


