Public awareness and acceptance of COVID-19 vaccine: An online cross-sectional survey, conducted in the rst phase of vaccination drive in India
←
→
Page content transcription
If your browser does not render page correctly, please read the page content below
Public awareness and acceptance of COVID-19 vaccine:
An online cross-sectional survey, conducted in the rst
phase of vaccination drive in India
Arumuganainar Suresh ( suresh.a@iar.ac.in )
Department of Biological Sciences and Biotechnology, Institute of Advanced Research- The University for
Innovation, Gandhinagar-382426, Gujarat, India https://orcid.org/0000-0002-3193-0345
Rocktotpal Konwarh ( rock1311@gmail.com )
Uniglobe Scienti c Pvt. Ltd. 7/9, Kishan Garh, Vasant Kunj, New Delhi-110070, India https://orcid.org/0000-0003-
4767-4531
Anand Pratap Singh
Uniglobe Scienti c Pvt. Ltd. 7/9, Kishan Garh, Vasant Kunj, New Delhi-110070, India https://orcid.org/0000-0001-
5077-9567
Anand Krishna Tiwari
Department of Biological Sciences and Biotechnology, Institute of Advanced Research- The University for
Innovation, Gandhinagar-382426, Gujarat, India
Research Article
Keywords: Acceptance, COVID-19, Hesitance, Indians, Knowledge, Vaccine
DOI: https://doi.org/10.21203/rs.3.rs-324238/v1
License: This work is licensed under a Creative Commons Attribution 4.0 International License. Read Full
License
Page 1/19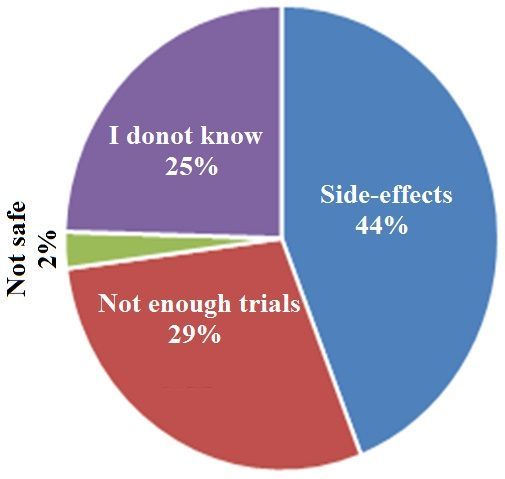
Abstract
The context-speci c, complex issue of ‘vaccine hesitancy’ is explicated in terms of delay or refusal of vaccination
despite the availability of vaccine services. Although eleven million bene ciaries were administered the COVID-19
vaccine in India from 16th January 2021 till 20th February 2021, however, proportionately a low turnout has been
registered in various parts of the country, possibly attributable to hesitance/apprehension towards the current
vaccination. In this backdrop, we report the response (collected between Feb 1, 2021 and Feb 15, 2021) of 358
voluntary respondents who participated in an online questionnaire-based pan-India survey, executed to assess their
knowledge and acceptance towards the current COVID-19 vaccination program in its rst phase. The survey
questionnaire consisted of demographic characteristics of the respondents and queries pertaining to knowledge (7
items) and acceptance (3 items). The overall correct rate and the average knowledge score of the participants were
78 % and 5.46 ± 1.4/7 respectively. The acceptance score was 3.50 ± 1.6/5 while 70 % of participants agreed against
the 20 % of respondents who neither agreed nor disagreed to take the vaccine. Around 66 % believed that the
vaccines, currently being administered in India are safe. Fear about possible side effects (44 %) and inadequacy of
comprehensive clinical trial data (29 %), seemed to be the major players in fortifying the vaccine hesitancy among the
respondents, exhibiting negative acceptance. Although maximum respondents demonstrated a good level of
knowledge (82%) and acceptance (88%), signi cant differences were observed among some demographic variables.
In general, a positive correlation was observed between knowledge and acceptance against a negative correlation,
observed in speci c provinces. Despite the good acceptance and knowledge, a considerable fraction of the
participants (30%) expressed hesitancy. Counselling, mobilization, and feedback from vaccinated individuals about
safety should be encouraged. However, due to the limited sample size, we must be cautious when generalizing these
 ndings. Nevertheless, the major elucidations of this study may be utilized in planning vaccination campaigns in
further phases.

Introduction
The global cataclysm, ushered in by COVID-19 needs no extensive description. Various measures including
countrywide lockdowns have been adapted globally to control and contain the disease. Albeit, the endeavors to
devise appropriate diagnostic and therapeutic strategies against the pandemic have escalated multifold (Konwarh,
2020a, b; Konwarh, 2021), the daily rise in the total number of con rmed cases and deaths seems incessant (globally:
129 million con rmed cases with 2.83 million deaths; India: 12.2 million con rmed cases with 163K deaths as on 2
April 2021) (Worldometer, 2021). Amongst others, the hunt for safe and effective vaccines continues across multiple
nations while a few countries including India have successfully developed vaccines in less than a year’s time frame,
started their trial, approved and permitted the mass vaccination drive (LSHTM, 2021).

The COVID-19 vaccination program kick started on 16th January, 2021 in India. The rst group of bene ciaries
included healthcare and frontline workers. The second group, comprising people over 60 years of age (as of January
1st, 2022) and those in the age-bracket of (45–59) years with comorbid conditions started receiving vaccinations
from March 1st, 2021 while vaccination for those above 45 years of age started from April 1st, 2021 (Ministry of
Health and Family Welfare, Govt. of India, 2021). Covishield® (AstraZeneca's vaccine manufactured by Serum
Institute of India) and Covaxin® (manufactured by Bharat Biotech Limited) are the two vaccines that have been
granted emergency use authorization by the Central Drugs Standard Control Organization (CDSCO) in India. In the
initial launching phase of the vaccination program, the bene ciaries were advised to receive two doses at a minimum
time gap of 28 days. Although the second dose of Covaxin® can be taken four to six weeks after the rst, however,
the time gap between two doses of the Covishield vaccine has been extended from four-six weeks to four-eight weeks

                                                       Page 2/19
(Ministry of Health and Family Welfare, Govt. of India, 2021). The vaccine is free and participation in the vaccination
drive is voluntary. One can register on the Co-WIN Portal and schedule his/her vaccination appointment or local
government health workers at Corona Vaccination Centers (CVCs) can help the bene ciaries with on-the-spot
registration, appointment, veri cation, and vaccination on the same day in case the latter fail to get themselves
registered online. Despite these efforts on the governmental end, the public response, particularly, in the early days of
the rst phase of vaccination was no less than dismal. The overall turnout was only 53 % on the rst day, 44 % on the
second day and 48 % on the third day post-registration. In the rst three days, 6, 31,417 people (far below the
expected gure) were vaccinated while 0.18% reported side-effects and nine people (0002%) were admitted to
hospitals for observation and treatment (The Hindu, 2021). The drive is being decelerated by low turnout, attributable
to a concert of factors including concerns about the safety of the vaccine, technical problems with the software used
for the online registration, and rapid dissemination of misinformation among the mass (The Guardian, 2021). The
overall national turnout had averaged around 64% while merely 22 % and 23 % of the target bene ciaries in Tamil
Nadu and Punjab, respectively were vaccinated in the rst two days of the vaccination drive (The Guardian, 2021).
Surprisingly, only 4 % turned up for the second dose of the vaccine on February 13 (Hindustan Times, 2021).
The above gures suggest that people are either unaware or afraid/hesitant towards the current vaccination program.
At this juncture, one may easily perceive the connotation of quoting vaccine hesitancy as a ‘delay in approval or
denial of vaccination’ and one of the top ten global health risks, as propounded by the Strategic Advisory Committee
of Immunization Experts from the World Health Organization (MacDonald, 2015). Vaccine hesitancy and
misinformation in many countries stand as impediments in achieving coverage and population immunization
(Larson et al., 2014; Lane et al., 2018). Governments and communities must gauge the existing levels of awareness
and readiness to get a COVID-19 vaccine that is potentially safe and successful, besides identifying the backdrop of
hesitancy towards the current vaccination program (DNAINDIA, 2021). Therefore, the objective of this pan-India online
survey was to assess our citizens’ awareness and acceptance of the current COVID-19 vaccination program. Although
a couple of previous surveys were directed towards assessing the acceptance of the COVID-19 vaccine prior to the
launch and use of the vaccine (Sharun et al. 2020; Gautam et al. 2020; Kazi Abdul and Khandaker Mursheda, 2020)
among the mass, our study was conducted during the 1st phase of the vaccination program in India. The results,
presented in this work are based on the response, collected from a sample of 358 online voluntary participants from
different states and union territories of India. It is envisaged that the outcome of this survey will de nitely assist in
decision making and policy framing to fortify the current COVID-19 vaccination program in the subsequent phases.
Materials And Methods
Survey plan and Participants
The time-frame of this cross-sectional survey was set from February 01, 2021 to February 15, 2021. During this
period, the rst phase of COVID-19 vaccination was initiated among the healthcare workers and frontline workers.
The lockdown was relaxed, although citizens were advised to maintain social distancing, wear masks and wash
hands. The nation also witnessed partial reopening of educational institutions in various states. It was not feasible
as well as advisable to conduct any off-line survey during this period, therefore, we decided to collect the data online
using Google form. A one-page poster (Electronic Supplementary Fig. ES1) was prepared and posted through various
social media platforms like WhatsApp, Facebook, Twitter, and Telegram, based on the authors’ network. The poster
contained an introduction and objectives of the work, besides information about requirements on the part of the
participants, nature of voluntary participation, declaration of anonymity and con dentiality, online link, and the
invigilators' details. The respondents were Indian citizens, aged 18 years or more, who understood the content of the
Page 3/19poster and voluntarily agreed to participate in the study without receiving any compensation or remuneration. An e-
certi cate was provided to the participants as a token of appreciation (directly delivered via e-mail), therefore, we had
requested the submission of the name and e-mail address of each respondent through the Google form.
Questionnaires and score
We designed a survey questionnaire, based on the current situation. The questionnaire consisted of demographics of
the participants, knowledge, and acceptance-attitude towards the current COVID-19 vaccination program in India.
Demographic variables included gender, age, state, marital status, education status, occupation, area (urban vs. rural)
and the state/union territory of residence (/province) (Table 1). A total of 7 questions, pertaining to the assessment of
the knowledge about COVID-19 were framed (Table 2). These questions were primarily multiple options based or of
true/false nature with an additional ‘I don't know’ choice. A correct answer was awarded 1 point and an
incorrect/unknown answer, a 0 point. The total knowledge score ranged from 0 to 7; a cut-off score of < 4 was set as
‘poor’ and > 5, ‘good’ knowledge. A total of 3 questions for acceptance (Table 3) were prepared and rated on the 5-
points Likert scale ranging from strongly disagree (1), disagree (2), neutral (3), agree (4) and strongly agree (5). Five
points were awarded to the responses, marked as 'strongly agree' with scores decreasing to 1 for the responses of
'strongly disagree', as far as the positive-acceptance questions were concerned. For the negative-acceptance
questions, a score of 1 was awarded for the response- 'strongly agree', with the score increasing to 5 corresponding to
the response, 'strongly disagree'. People who scored > 7 were classi ed as those with an attitude of ‘positive’
acceptance while the participants, scoring < 7 were considered as those with a ‘negative’ acceptance-attitude towards
the vaccination.
Page 4/19Table 1
Demographic characteristics of the respondents (n = 358) who participated in the
online survey, conducted to gauge their awareness and acceptance of the COVID-19
vaccine in India during the 1st phase of the vaccination drive
Demographic characteristics n %
Gender Male 184 51.4
Female 173 48.3
Others 1 0.3
Age 18–29 267 74.6
30–49 90 25.1
50–69 1 0.3
Marital status Married 89 24.9
Unmarried 262 73.2
Others 4 1.1
Not mentioned any 3 0.8
Education status < 12th grade 13 3.6
UG (holding or pursuing) 137 38.3
PG (holding or pursuing) 163 45.5
Ph.D. (holding or pursuing) 42 11.7
Not mentioned any 3 0.8
Occupation Student 219 61.2
Private job 95 26.5
Government Job 15 4.2
Health workers 11 3.1
Others (self, unemployed) 18 5.0
Area Urban 278 77.7
Rural 77 21.5
Not mentioned any 3 0.8
State Andaman and Nicobar Islands 2 0.6
Arunachal Pradesh 1 0.3
Assam 69 19.3
Bihar 5 1.4
Chhattisgarh 4 1.1
Dadra and Nagar Haveli and Daman and Diu 1 0.3
Page 5/19Demographic characteristics n %
Delhi 12 3.4
Gujarat 126 35.2
Haryana 1 0.3
Himachal Pradesh 1 0.3
Jharkhand 7 2.0
Karnataka 2 0.6
Kerala 2 0.6
Madhya Pradesh 7 2.0
Maharashtra 6 1.7
Manipur 1 0.3
Meghalaya 2 0.6
Odisha 2 0.6
Puducherry 2 0.6
Punjab 2 0.6
Rajasthan 7 2.0
Tamil Nadu 44 12.3
Telangana 1 0.3
Uttar Pradesh 48 13.4
Uttarakhand 2 0.6
West Bengal 1 0.3
Page 6/19Table 2
Knowledge and awareness about COVID-19 vaccination among the participants (n = 358) during the 1st phase of
vaccination
Questions, pertaining to knowledge Correct Incorrect
n % n %
K1 Do you know that the COVID-19 vaccination program started in India on the 346 96.6 11 3.1
16th of January 2021?
K2 Are you aware of the fact that the Indian government is using 2 types of 314 87.7 43 12.0
vaccines, namely, Covaxin and Covishield in its COVID-19 vaccination
program?
K3 Which vaccine is developed in India? 228 63.7 130 36.3
K4 Who are being administered with the COVID-19 vaccine in the rst phase? 327 91.3 31 8.7
K5 Do you know that two doses of the COVID-19 vaccine, 28 days apart, need to 273 76.3 82 22.9
be administered to an individual to complete the vaccination schedule?
K6 The COVID − 19 vaccine is free in India 232 64.8 126 35.2
K7 In India, getting vaccinated for COVID-19 is voluntary in nature, and not 236 65.9 120 33.5
mandatory
Table 3
Acceptance of COVID-19 vaccination among the participants (n = 358) during the 1st phase of vaccination
Questions, Strongly Disagree Neutral Agree (4) Strongly Average SD P-
pertaining to disagree (2) (3) agree (5) score value
acceptance (1)
n % n % n % n % n %
A1 I will 11 3.1 24 6.8 75 21.1 100 28.2 145 40.8 3.97 1.17 <
take 0.001
the
COVID-
19
vaccine
A2 The 8 2.2 21 5.9 93 26.1 117 32.9 117 32.9 3.88 1.01 <
Indian 0.001
COVID-
19
vaccine
is safe
to use
A3 I am 95 26.6 74 20.7 79 22.1 68 19.0 41 11.5 2.68 1.82 <
afraid 0.001
of
taking
the
COVID-
19
vaccine
Ethical considerations
All procedures performed in this study, involving human participants, complied with the institutional ethical standards
and were approved by the Ethical Committee of the Institute of Advanced Research, Gujarat, India. Moreover, the
Page 7/19study was designed and conducted in accordance with the ethical principles established by the “Committee on
Publication Ethics (COPE)” guidelines to handle publication ethics. Con dentiality of the participants' information
was ensured throughout the study. The online pages for the self-administered questionnaire could be accessed by the
participants for attempting and completion, subjected to indication (through a click on ‘Yes’ button) of consent for
voluntary participation.
Statistical analysis
The data collected from the survey were collated while the incomplete and repeated/multiple responses were deleted.
The rst completed responses were considered as accurate. The descriptive statistics and one-way analysis of
variance (ANOVA) or Chi-square test as appropriate were performed using Microsoft Excel to determine the
differences between the groups for selected demographic variables and their knowledge and acceptance towards
COVID-19 vaccination. Regression tests were applied to assess any correlation between knowledge and acceptance
scores. The statistical signi cance level was set at p < 0.05.
Results
Demographic characteristics
A total of 376 participants attempted the survey questionnaire. Among these, 18 responses were incomplete or
repeated attempts, and as such excluded. Among the valid responses, collected from 358 participants, a correct
response rate of 95.2 % was documented. Almost equal representation of either gender (albeit, males had a slightly
higher representation of 51.4 %) was registered while the majority of the respondents were within the age group of
18–29 years (74.6 %) and unmarried (73.2 %) (Table 1). Most of the respondents either held or pursued college-level
education (95.5 %) against 13 participants with school education (< 12th grade). More than half of the respondents (6
out of 10) were students, followed by people in private jobs (26.5 %), government jobs (4.2 %), and healthcare sector
(3.1 %) respectively. The participation was primarily documented from 26 states with maximum representation from
Gujarat (126), followed by Assam (69), Uttar Pradesh (48), and Tamil Nadu (44), and rest (71) from other 22 states.
Among this, eight out of ten were from the urban area. The various other demographic characteristics are shown in
Table 1.
Assessment of knowledge
The average knowledge score for the participants was 5.46 ± 1.35 (range: 0–7) (Table 4). The overall correct answer
rate for the knowledge questionnaire was 78 % (5.48/7*100). As shown in Table 2, almost all the participants (97.7
%) knew that the 1st phase of vaccination started on 16th January, 2021. However, one third of the respondents were
unaware of the Indian vaccine candidate, the attribute of voluntary/non-mandatory participation in the vaccination
program and free-of-cost availability-provisions of the vaccines in India. Nearly a quarter of the participants (22.9 %)
did not know the requirement of a second shot, post 4 weeks of the 1st administration to complete the vaccination
schedule. Nine out of ten answered correctly about the two types of vaccines, currently being administered in the
country. The respondents were aware of the fact that the bene ciaries in the 1st phase of the vaccination program
were the healthcare and frontline workers. The knowledge score signi cantly (p < 0.05) differed among the various
demographic variables (Table 4) except the gender and the area (urban vs. rural) of dwelling. Signi cant difference
was documented for the knowledge level vis-à-vis the demographical variables of age, marital status, education
status, and occupation category. In overall, two out of ten exhibited poor knowledge level. This was associated more
with the participants of the feminine gender, young age (18–29), lesser education status, students’ category and
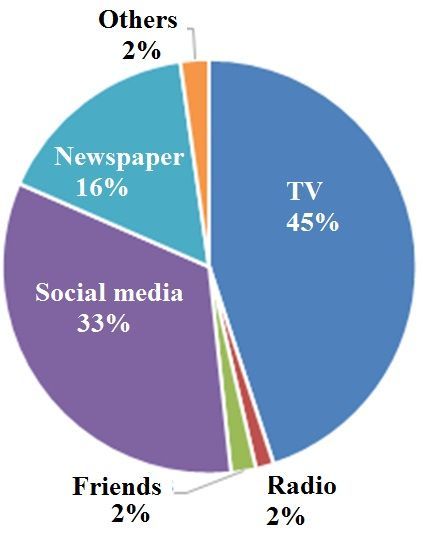
Page 8/19those dwelling in the rural area. When asked about the source of information about the COVID-19 vaccination
schedule in India, around 45 % and 33 % chose the options TV and social media, respectively (Fig. 1).
Table 4
Distribution of knowledge and acceptance scores across the various demographic variables of the participants (n =
358) towards COVID-19 vaccine during the 1st phase of vaccination
Demographic characteristics Knowledge score F- p- Acceptance score F- p-
(mean ± SD) value value (mean ± SD) value value
Gender Male 5.57 1.32 2.34 0.127 3.83 0.95 4.78 <
0.05
Female 5.35 1.38 3.62 0.88
Age 18–29 5.29 1.40 19.06 < 3.68 0.89 2.37 0.124
0.001
30–49 5.99 1.07 3.85 1.02
Marital Married 6.03 1.03 22.68 < 3.81 1.03 1.45 0.229
status 0.0001
Unmarried 5.29 1.00 3.68 0.89
Education < 12th grade 4.62 1.71 6.10 < 3.72 1.07 2.23 0.086
status 0.001
UG 5.32 1.40 3.87 0.89
PG 5.49 1.28 3.61 0.92
Ph.D. 6.14 0.98 3.62 1.00
Occupation Student 5.28 1.39 3.97 < 0.01 3.70 0.85 1.26 0.285
Private job 5.79 1.19 3.79 1.01
Government Job 6.27 0.80 4.09 1.09
Health workers2 5.64 1.43 3.48 1.34
Others (self, 5.22 1.44 3.48 0.89
unemployed)
State Assam 5.07 1.43 3.39 < 0.01 3.58 0.83 5.39 <
0.001
Delhi 5.17 1.40 4.36 0.85
Gujarat 5.35 1.43 3.80 0.83
Tamil Nadu 5.93 1.26 3.29 1.11
Uttar Pradesh 5.67 1.12 3.90 0.82
Area Urban 5.49 1.31 0.37 0.543 3.70 0.97 0.51 0.476
Rural 5.39 1.46 3.79 0.74
Overall score average ± SD 5.46 ± 1.35 (0–7) 3.50 ± 0.62 (1.33-5)
(Min-Max)
Assessment of vaccine acceptance
The average acceptance score for the participants was 3.50. ± 1.62 (range: 1.33-5) (Table 4). Seven out of ten
responded that they will take the COVID-19 vaccine, while one out of ten disagreed, and two out of ten chose neither.
Page 9/19One fourth of the respondents chose neither to agree nor disagree about the safety of the vaccines. However, 65 %
seconded that the vaccines were safe to use while 8 % voiced the other way. Though 70 % respondents agreed to get
vaccinated, 20 % opted neither to agree nor disagree about taking the vaccine. Besides, 30 % asserted that they were
afraid of taking the COVID-19 vaccine while a neutral-attitude was noted for around 22 %. Responding to the query,
‘Why are you hesitant/afraid to take the COVID-19 vaccine?’, around 44 % participants mentioned that their point of
apprehension was the plausible side effect while three out of ten quoted the insu ciency of clinical trial data, on the
other hand, a quarter of the respondents said ‘I don’t know’ (Fig. 2). The acceptance score signi cantly (p < 0.05)
differed among the gender and state category, while the difference was insigni cant across other variables (Table 4).
The acceptance level signi cantly (p < 0.05) differed across the states and area category, while the difference was
insigni cant across other variables (Table 5). Around 9 out of 10 exhibited positive acceptance level. Comparatively
greater negative acceptance level was evident among the females, more aged (30–49), married, highly educated
(Ph.D.), healthcare workers, and urban area dwellers. Regression tests revealed a signi cant positive linear correlation
between knowledge and acceptance (r = 0.215, p < 0.0001) (Table 6).
Page 10/19Table 5
Knowledge and acceptance levels across demographic variables of the participants (n = 358) towards COVID-19
vaccine during the 1st phase of vaccination
Demographic characteristics Knowledge level p- Acceptance level p-
value value
Poor Good Negative Positive
n % n % n % n %
Gender Male 34 18.5 150 81.5 0.279 18 9.8 165 90.2 0.487
Female 40 23.0 133 76.9 21 12.1 152 87.9
Age 18–29 68 25.7 197 74.3 < 29 10.9 237 89.1 0.732
0.001
30–49 6 6.7 84 93.3 11 12.2 79 87.8
Marital Married 4 4.5 85 95.5 < 11 12.4 78 87.6 0.673
status 0.0001
Unmarried 67 25.5 196 74.5 28 10.7 233 89.3
Education < 12th grade 4 30.8 9 69.2 < 0.05 1 8.3 11 91.7 0.436
status
UG (holding or 37 27.0 100 73.0 11 8.0 126 92.0
pursuing)
PG (holding or 30 18.4 133 81.6 22 13.5 141 86.5
pursuing)
Ph.D. (holding or 2 4.8 40 95.2 6 14.3 36 85.7
pursuing)
Occupation Student 58 26.5 161 73.5 < 0.01 20 9.1 199 90.9 0.342
Private job 11 11.6 84 88.4 11 11.7 83 88.3
Government Job 0 0.0 15 100.0 2 13.3 13 86.7
Health workers 2 18.2 9 81.8 3 27.3 8 72.7
Others (self, 2 11.8 15 88.2 3 16.7 15 83.3
unemployed)
State Assam 19 27.5 50 72.5 0.082 7 10.1 62 89.9
Delhi 3 25.0 9 75.0 0 0.0 11 100.0 <
0.01
Gujarat 34 27.0 92 73.0 9 7.1 117 92.9
Tamil Nadu 6 13.6 38 86.4 11 25.0 33 75.0
Uttar Pradesh 5 10.6 42 89.4 3 6.3 45 93.8
Area Urban 55 19.7 224 80.29 0.481 36 13.0 241 87.0 <
0.01
Rural 18 23.4 59 76.62 2 2.6 75 97.4
Page 11/19Demographic characteristics Knowledge level p- Acceptance level p-
value value
Poor Good Negative Positive
n % n % n % n %
Average (%) 17.8 82.2 11.9 88.1
Table 6
Correlation between knowledge and acceptance towards the
COVID-19 vaccine in India during the 1st phase of vaccination-
drive
Variable Correlation Coe cient p-value
Knowledge-Acceptance 0.215 < 0.0001
Discussion
Since the rst quarter of 2020, the world has witnessed an unprecedented catastrophe in the form of COVID-19. The
global population has been anxiously waiting for a potential vaccine for more than a year by now. As of February
2021, eleven vaccine candidates were approved in less than a year’s time by at least one national regulatory body for
public use: two RNA based (P zer–BioNTech and Moderna vaccine), four conventional inactivated vaccines (BBIBP-
CorV, Covaxin, CoronaVac and CoviVac), four viral vector vaccines (Sputnik V, Oxford–AstraZeneca, Convidicea and
Johnson & Johnson), and one peptide vaccine (EpiVacCorona) (LSHTM, 2021). As of 24 February 2021, 221.8 million
doses of COVID19 vaccine were administered worldwide. It included 12.3 million from India since 16th January, 2021.
According to the recent data, retrieved on March 30, 2021 (Mathieu, 2021), against 63.1 million administered doses,
only 9.07 million have been fully vaccinated i.e., 0.66% of the population in India. The dismal number of vaccinated
individuals is a possible indicator of the hesitance among the public of various countries, attributable to the fear
about the safety of the COVID-19 vaccine candidates used by the respective countries while the spread of
misinformation cannot be ruled out (The Guardian, 2021). Despite the backing from the scienti c fraternity, vaccine
acceptance is shaped according to the dictates of space, time, social class, ethnicity, knowledge and attitude (Larson
et al., 2014; Xiao et al., 2020; Shetty et al., 2019).
In some studies, executed before the COVID-19 vaccination program (when the spread was intensive with alarming
number of cases, registered per day) had started in India, varied acceptance levels of 86.3 % (Sharun et al. 2020),
77.3 % (Gautam et al. 2020), 74.5 % (Lazarus et al. 2021) and 74 % (Kazi Abdul and Khandaker Mursheda, 2020)
were recorded. Similarly, a high acceptance was observed in others countries like US (80 %) (Thunstrom et al. 2020),
and China (72.5 %) (Fu et al. 2020) prior to vaccination. In our survey on knowledge and acceptance for COVID-19
vaccination, conducted during the 1st phase of vaccination in India, we found around 70 % acceptance among the
358 participants, hailing from different parts of the country. During our survey period (1st to 15th February, 2021), a
comparatively lower intensity of spread (average 11,500 cases/day) was registered. Based on these results, it
appears that the reduction in acceptance rate bears a correspondence with the dip in the intensity of the cases. This
needs a deeper delving. However, on a note of concern, this level of acceptance towards COVID-19 vaccine projects to
be inadequate to meet the requirements for immunizing large community.
The vaccination drive started on 16th January, 2021 in India and nearly, all the participants were aware about it: TV
and social media, being the main sources of information. However, the lack of knowledge was evident in multiple
Page 12/19instances. One third of the responders did not know about the indigenous vaccine candidate (Covaxin), cost of the
vaccine (free) and non-mandatory policy. Most importantly, a quarter of the participants did not know about the
requisite for the 2nd dose post 28 days of the rst shot for the completion of vaccination regime. In fact, as on
February 13, 2021, only 7,668 out of the over 1, 91,000 participating healthcare workers, who were administered the
rst shot on 16 January, had shown up for the second dose of the COVID-19 jab, indicating a mere 4% turn up (Money
Control, 2021). Augmenting the acceptance demands the dissemination of timely and adequate knowledge and trust
building for the current COVID-19 vaccination. In support of this, the central and state governments had allowed walk-
ins, counselled and mobilized healthcare workers and promoted visible feedback from vaccinated individuals, leading
to improved average turn up of 65% for the 2nd dose on 25th February, 2021 (Live Mint, 2021). Our study also
revealed that the there was a positive correlation between knowledge and the acceptance of vaccination, in general.
Interestingly, there was negative correlation between knowledge and acceptance in speci c cases, to cite for evidence,
the knowledge score (5.93/7) was more for the respondents from Tamil Nadu while their acceptance score (3.29/5)
was lesser than the others. As a matter of fact, a lackluster 22% turnout was recorded in Tamil Nadu in the rst two
days of the vaccination drive in January, 2021 (The Guardian, 2021). The respondents from Delhi had the acceptance
score of 4.36 against a knowledge score of 5.17.
Most of the respondents (66%) felt that the currently administered COVID-19 vaccines were safe, however, 30%
respondents exhibited an attitude of fear, while 22% registered a ‘neutral’ attitude. Around 44 % of the respondents
were of the view that possibility of side effect was the major reason for the hesitance to accept, followed by the lack
of data on su cient clinical trials while one out of ten chose the ‘I don’t know’ response. In agreement with our study,
Khan et al. (2020) also reported that apprehension about possible side effects acted as the key barrier to vaccine
acceptance in India. Indian government had laid its precedence on the healthcare and frontline workers during the 1st
phase of vaccination. On a surprising note, we found that the healthcare workers had shown greater negative
acceptance level than others. This might be attributed to the insu ciency of clinical safety data and the associated
anxiety of being the prime bene ciaries in the 1st phase. Execution of greater number of studies to assess the
effectiveness and safety of vaccines is imperative. Counselling, mobilization and feedback from vaccinated
individuals about the safety should be encouraged. Previous studies on pandemics, caused by H1N1, SARS, MERS
and Ebola, are suggestive of the fact that successful disease control depends on trusted sources of information and
guidance to a great extent (Larson et al. 2014; Larson et al. 2018). However, Siegrist, and Zingg (2014)’s remark about
the multifactorial, intricate and context-dependent attribute of vaccine hesitancy, that demands concomitant tackling
at various levels merit special mention. Understanding patient-physician interactions in the context of vaccine
hesitancy is also critical.
The participants, belonging to the masculine gender, age > 29 years, married, more educated, engaged in government
jobs and those in the urban areas registered higher knowledge score. This may be plausibly attributed to the
difference in the accessibility-levels of information in comparison to their counterparts. The same trend was noted for
the acceptance, except across the demographic variables of education and area. On an interesting note, less
educated people and rural participants exhibited greater positive acceptance than their counterparts. In lines with our
observation, Al-Mohaithef and Padhi (2020) had reported greater acceptance among participants, belonging to the
masculine gender, age above 45 years, married, higher level of education and government employees in Saudi Arabia.
Another global survey also supported similar nding except for the fact that females documented a greater positive
acceptance than the males (Lazarus et al. 2021). In fact, nearly, 11 % of the respondents exhibited negative
acceptance while 18% was grouped under poor knowledge category. It is quite perceivable that trust and legitimacy
are pivotal in grasping why some sources of information on vaccination are referred to more often than others, how
information on vaccination is re-interpreted and the way beliefs that are often con icting to medical science are
Page 13/19shaped (Yaqub et al. 2014). These might provide some backdrop to understand and unsnarl some perplexing
observations, evident in our study as well, such as why the better/higher educated people (who mistrust) might reject
vaccination more readily than the less educated (who accept passively) (Hak et al., 2005).
At this juncture, it is pertinent to mention that currently we do not have comprehensive data on the effectiveness of
the current COVID-19 vaccines against the emerging variants of the virus (WHO, 2021) as well as the duration for
which the immunity shall last post vaccination (Lord, 2021). However, Dr. V. K. Paul, Member (Health), NITI Aayog has
recently mentioned about the availability of data to attest the safety and effectiveness of the vaccines against both,
Brazil and the U.K. variants of the novel coronavirus (Ministry of Health, 2021). Previously, it has been advocated that
the awareness about the vaccines and vaccination program should be increased among the population; this can have
profound role in reducing vaccine hesitancy (Gautam et al. 2020). When it comes to mass immunization, a
transparent, evidence-based policy as well as clear, accurate and timely communication are indispensable. The
current pandemic seems to be open up an opportunity-portal to build and fortify vaccine acquaintance and
con dence among public towards the administration of potential COVID-19 vaccine.
Limitations of the study
This study had a number of limitations. The survey was conducted based on the respective online network of the
authors and relied on the circulation of the survey link on different social media platforms for a certain period in time.
There is a possibility of bias as underprivileged populations may not have been able to participate in the survey.
Moreover, when compared to the current population in India, the survey-sample was over representative for
participants below the age of 50, students, and educated (more than a degree). The ndings may not be a true
representation from the perspective of the entire nation. A more systematic, community-based, inclusive sampling
method (preferably conducted in local/o cial languages of different areas) is recommended to improve the
representativeness and generalizability of the ndings. Despite these limitations, our ndings are expected to provide
valuable information about the knowledge and acceptance toward current COVID-19 vaccination program among
Indians. This could be crucial in shaping and chalking out necessary action-plans for further vaccine campaign.
Conclusion
This community based online survey on knowledge and attitude of acceptance for COVID-19 vaccine, conducted
during the 1st phase of vaccination among Indians revealed that the majority of the participants had positive
acceptance and good knowledge with positive correlation between the two. However, the positive acceptance for
immunization from the larger perspective in the community was low. Signi cant difference was observed among the
respondents with respect to knowledge while no signi cant difference in acceptance was noted across many
demographical variables. A considerable number of participants were apprehensive about the safety of the vaccine.
Dissemination of timely knowledge and education as well as safety and health promotion interventions, targeting
concerned demographic variables are requisites of the moment. Studies with greater number of participants are
expected to provide deeper insight and more convincing results. Nevertheless, the major ndings of this study may be
utilized in planning vaccination campaigns in further phases.
Declarations
Acknowledgements
Page 14/19A note of gratitude is extended to all the participants for responding and providing us with valuable online survey
information. The authors extend a bouquet of gratitude to Dr. Rao Bhamidimarri, President, Institute of Advanced
Research, Gujarat and Dr. Priti Desai, HoD, Department of Biotechnology, Institute of Advanced Research, Gujarat for
the immediate approval and support for the survey.
Data availability statement
The datasets generated during and/or analyzed during the current study are available from the corresponding
authors on reasonable request.
Funding
Though no formal funding was provided, this research was conducted using the resources and research priority
directions of the Institute of Advanced Research, Gujarat.
Competing interests: The authors have declared that no competing interests exist.
Authors Contribution
Concept: Arumuganainar Suresh, Rocktotpal Konwarh,
Methodology: Arumuganainar Suresh, Rocktotpal Konwarh, Anand Pratap Singh, Anand Krishna Tiwari
Data analysis: Arumuganainar Suresh, Rocktotpal Konwarh, Anand Krishna Tiwari
Project administration: Arumuganainar Suresh, Rocktotpal Konwarh, Anand Pratap Singh
Supervision: Arumuganainar Suresh, Rocktotpal Konwarh, Anand Pratap Singh
Writing – original draft: Arumuganainar Suresh, Rocktotpal Konwarh
Writing – review & editing: Arumuganainar Suresh, Rocktotpal Konwarh, Anand Pratap Singh, Anand Krishna Tiwari
References
Al-Mohaithef, M., Padhi, B.K., 2020. Determinants of COVID-19 vaccine acceptance in Saudi Arabia: a web-based
national survey. Journal of Multidisciplinary Healthcare 13, 1657. https://doi.org/10.2147/JMDH.S276771
Covid19India, 2021. https://www.covid19india.org/
DNAINDIA, 2021. India's coronavirus vaccine candidate COVAXIN showed positive result in animals: Bharat Biotech
(dnaindia.com)
Fu, C., Wei, Z., Pei, S., Li, S., Sun, X., Liu, P., 2020. Acceptance and preference for COVID-19 vaccination in health-care
workers (HCWs). MedRxiv. https://doi.org/10.1101/2020.04.09.20060103
Gautam, A., Dhara, B., Mukherjee, D., Mukhopadhyay, D., Roy, S., Ganguly, S.S., Chowdhury, A.D., Goswami, S., Dey, S.,
Basu, S., Chatterjee, S., 2020. a digital survey on the acceptance and affordability of COVID 19 vaccine among the
people of West Bengal, India-A survey based study. medRxiv https://doi.org/10.1101/2020.11.13.20229534
Page 15/19Hak, E., Schönbeck, Y., De Melker, H., Van Essen, G.A. and Sanders, E.A., 2005. Negative attitude of highly educated
parents and health care workers towards future vaccinations in the Dutch childhood vaccination
program. Vaccine, 23(24), 3103-3107. https://doi.org/10.1016/j.vaccine.2005.01.074
Hindustan Times, 2021. https://www.hindustantimes.com/india-news/only-4-bene ciaries-turn-up-for-second-
vaccine-shot-centre-101613239833404.html
Kazi Abdul, M., Khandaker Mursheda, F., 2020. Knowledge, attitude and acceptance of a COVID-19 Vaccine: A global
cross-Sectional study https://mpra.ub.uni-muenchen.de/105236/
Konwarh, R., 2020. Can CRISPR/Cas technology be a felicitous stratagem against the COVID-19 asco? Prospects
and hitches. Frontiers in Molecular Biosciences 7, 557377. doi: 10.3389/fmolb.2020.557377
Konwarh, R., 2020b. Nanobodies: prospects of expanding the gamut of neutralizing antibodies against the novel
coronavirus, SARS-CoV-2. Frontiers in Immunology 11, 1531. doi: 10.3389/ mmu.2020.01531
Konwarh, R., Cho, W. C., 2021. Fortifying the diagnostic-frontiers with nanoscale technology amidst the COVID-19
catastrophe. Expert Review of Molecular Diagnostics 21(2), 131-135, doi: 10.1080/14737159.2021.1878879
Lane, S., MacDonald, N.E., Marti, M., Dumolard, L., 2018. Vaccine hesitancy around the globe: Analysis of three years
of WHO/UNICEF Joint Reporting Form data-2015–2017. Vaccine, 36(26), 3861-
3867. https://doi.org/10.1016/j.vaccine.2018.03.063
Larson, H.J., Clarke, R.M., Jarrett, C., Eckersberger, E., Levine, Z., Schulz, W.S. and Paterson, P., 2018. Measuring trust in
vaccination: A systematic review. Human Vaccines & Immunotherapeutics, 14(7), 1599-1609.
https://doi.org/10.1080/21645515.2018.1459252
Larson, H.J., Jarrett, C., Eckersberger, E., Smith, D.M., Paterson, P., 2014. Understanding vaccine hesitancy around
vaccines and vaccination from a global perspective: a systematic review of published literature, 2007–
2012. Vaccine, 32(19), 2150-2159. https://doi.org/10.1016/j.vaccine.2014.01.081
Lazarus, J.V., Ratzan, S.C., Palayew, A., Gostin, L.O., Larson, H.J., Rabin, K., Kimball, S., El-Mohandes, A., 2021. A global
survey of potential acceptance of a COVID-19 vaccine. Nature Medicine, 27, 225–
228. https://doi.org/10.1038/s41591-020-1124-9
Live Mint, 2021. https://www.livemint.com/news/india/delhi-j-k-lead-phase-1-vaccine-effort-second-dose-turnout-
lowerthanexpected-11614235546595.html
Lord, D., 2021. Coronavirus: How long does immunity last after a COVID-19
vaccine? https://www.kiro7.com/news/trending/coronavirus-how-long-does-immunity-last-after-covid-19-
vaccine/RIMEAWEUWRE6PG6CT4KZEN2NYE/
LSHTM, 2021. London School of Hygiene and Tropical Medicine. Equity of vaccine roll-out COVID-19 vaccine tracker
(shinyapps.io)
MacDonald, N.E., 2015. Vaccine hesitancy: De nition, scope and determinants. Vaccine, 33(34), pp.4161-
4164. https://doi.org/10.1016/j.vaccine.2015.04.036
Page 16/19Mathieu, E., 2021. Owid/COVID-19 data. https://github.com/owid/covid-19-
data/blob/master/public/data/vaccinations/vaccinations.csv
Ministry of Health (@MoHFW_INDIA), 2021 https://twitter.com/MoHFW_INDIA/status/1377980071152021509?
ref_src=twsrc%5Egoogle%7Ctwcamp%5Eserp%7Ctwgr%5Etweet
Ministry of Health and Family Welfare, Govt. of India,
2021. https://www.mohfw.gov.in/covid_vaccination/vaccination/faqs.html#about-the-vaccine
Money Control, 2021. COVID-19 Vaccination | Most Bene ciaries Skipped Second Dose, Reveals Government Data
(moneycontrol.com)
Our World in Data, 2021. https://ourworldindata.org/covid-vaccinations
Sharun, K., Rahman, C.F., Haritha, C.V., Jose, B., Tiwari, R., Dhama, K., 2020. COVID-19 vaccine acceptance: Beliefs and
barriers associated with vaccination among the general population in india. Journal of Experimental Biology and
Agricultural Sciences, 8(Special Issue 1). http://dx.doi.org/10.18006/2020.8(Spl-1-SARS-CoV-2).S210.S218
Shetty S, Prabhu S, Shetty V, Shetty AK., 2019. Knowledge, attitudes and factors associated with acceptability of
human papillomavirus vaccination among undergraduate medical, dental and nursing students in South
India. Human vaccines & Immunotherapeutics. 15(7-8), 1656-65. https://doi.org/10.1080/21645515.2019.1565260
Siegrist, M., Zingg, A. 2014. The role of public trust during pandemics: implications for crisis
communication European Psychologist, 19, 23–32. https://psycnet.apa.org/doi/10.1027/1016-9040/a000169
The Guardian, 2021. Indian hesitancy sets back world's biggest Covid vaccination drive | World news | The Guardian
The Hindu, 2021. Coronavirus | Over six lakh vaccinated so far - The Hindu
Thunstrom, L., Ashworth, M., Finnoff, D., Newbold, S., 2020. Hesitancy towards a COVID-19 vaccine and prospects for
herd immunity. Available at SSRN 3593098. https://dx.doi.org/10.2139/ssrn.3593098
WHO, 2021. The effects of virus variants on COVID-19 vaccines. https://www.who.int/news-room/feature-
stories/detail/the-effects-of-virus-variants-on-covid-19-vaccines
Worldometer, 2021. https://www.worldometers.info/coronavirus/?utm_campaign=homeAdvegas1?#countries
Xiao, X., Wong, R.M., 2020. Vaccine hesitancy and perceived behavioral control: A meta-analysis. Vaccine, 38(33),
5131-5138. https://doi.org/10.1016/j.vaccine.2020.04.076
Yaqub, O., Castle-Clarke, S., Sevdalis, N. and Chataway, J., 2014. Attitudes to vaccination: a critical review. Social
Science & Medicine, 112, 1-11. http://dx.doi.org/10.1016/j.socscimed.2014.04.018
Figures
Page 17/19Figure 1
Pie-chart, depicting the share (in percentage) of the various sources of information about the COVID-19 vaccination
program in India among the respondents
Page 18/19Figure 2
Pie-chart, depicting the response to the query, 'Why are you hesitant/afraid to take the COVID-19 vaccine?'
Supplementary Files
This is a list of supplementary les associated with this preprint. Click to download.
ElectronicSupplementaryFigure1.tif
Page 19/19You can also read