MADHYA PRADESH - SANCHI STUPA IN SANCHI, MADHYA PRADESH March 2021 For updated information, please visit www.ibef.org

Page created by Chester Lynch
 
CONTINUE READING
MADHYA PRADESH - SANCHI STUPA IN SANCHI, MADHYA PRADESH March 2021 For updated information, please visit www.ibef.org
MADHYA PRADESH

                 SANCHI STUPA IN SANCHI, MADHYA PRADESH
                                                             March 2021
                           For updated information, please visit www.ibef.org
MADHYA PRADESH - SANCHI STUPA IN SANCHI, MADHYA PRADESH March 2021 For updated information, please visit www.ibef.org
Table of Contents

        Executive Summary           3

        Introduction                4

        Economic Snapshot           9

        Physical Infrastructure     15

        Social Infrastructure       22

        Industrial Infrastructure   25

        Key Sectors                 27

        Key Procedures & Policies   35

        Appendix                    42

 2
MADHYA PRADESH - SANCHI STUPA IN SANCHI, MADHYA PRADESH March 2021 For updated information, please visit www.ibef.org
Executive summary

                    Strong economy
      1                  The Gross State Domestic Product (GSDP) of Madhya Pradesh increased at a CAGR of 11.14% from 2015 to
                          2021.

                    Growth in cotton yarn export
      2                  In FY20, exports of cotton yarn stood at US$308 million against US$ 267 million in FY19, a 15% YoY growth. In
                          FY21, the export contributed 5% to the state’s total export (US$ 87.25 million).

                    Potential for tourism
     3                   Madhya Pradesh boasts of rich ancient cultural & religious heritage.

                         Due to a thick forest cover, the state has immense potential for wild life, adventure & eco-tourism.

                    Infrastructure support
                         Madhya Pradesh is growing as a solar power hub with Rewa solar power project (new 750 MW solar power

      4                   plant) and an upcoming 600 MW floating solar energy project at Omkareshwar Dam on Narmada river, which
                          represents the country’s commitment to achieve the installed renewable energy capacity target of 175 GW by
                          2022.

 Source: Directorate of Economics and Statistics, Government of Madhya Pradesh; Ministry of Petroleum & Natural Gas, MNRE

 3
MADHYA PRADESH - SANCHI STUPA IN SANCHI, MADHYA PRADESH March 2021 For updated information, please visit www.ibef.org
INTRODUCTION

4
MADHYA PRADESH - SANCHI STUPA IN SANCHI, MADHYA PRADESH March 2021 For updated information, please visit www.ibef.org
Advantage: Madhya Pradesh

      Attractive investment avenues                                      Rich resource pool
       Madhya Pradesh Industrial Development Corporation
                                                                          Madhya Pradesh adds around 270,000 graduates to the
        (MPIDC) has emerged as the leading investment promotion
                                                                           workforce each year, of which around 90,000 have
        agency worldwide. In the field of investment promotion, the
                                                                           technical skills. At labour costs of US$ 3.7 per day, the
        state scored 97%. In parameters comprising inviting
                                                                           state has a significant cost advantage over metros.
        investors, taking investment to Madhya Pradesh, providing
        investors with facilities after setting up companies, building    The state houses some of the country’s most reputed
        infrastructure and website, the state scored 100%.                 institutes including Indian Institute of Management, Indian
                                                                           Institute of Foreign Management & Indian Institute of
       The cluster-based advancement methodology promotes
                                                                           Technology.
        investments in automotive, textiles & biotechnology.

                                                                                                 Policy and infrastructure
      Strategically located
                                                                                                 support
      business hub
                                                                                                  In 2020, the Union Minister for Road
  •    The state is centrally
                                                                                                   Transport, Highways and MSMEs laid
       located in India. Major
       consumer             goods                                                                  the foundation stones for developing 45
       multinationals are situated                                                                 highway projects worth Rs. 1.25 trillion
       in Madhya Pradesh in order                                                                  (US$ 16.95 billion) in Madhya Pradesh.
       to access major consumer
       markets & metro urban                                                                      State introduced the ‘Madhya Pradesh
       communities like New Delhi                                                                  Health Sector Investment Promotion
       (740 km), Mumbai (780 km),                                                                  Scheme 2020’ to encourage private
       Kolkata (1,350 km) &
                                                                                                   investment in healthcare infrastructure
       Chennai (1,435 km)
                                                                                                   by incentivising the establishment of
                                                                                                   standalone healthcare centres.

 Note: 1 From Bhopal

 5
MADHYA PRADESH - SANCHI STUPA IN SANCHI, MADHYA PRADESH March 2021 For updated information, please visit www.ibef.org
Madhya Pradesh vision

 1 SKILL DEVELOPMENT                                         8 TRANSPORT
  Skill development by expanding                             Develop the transportation network to
   training infrastructure & capacity to                       enhance rural connectivity
   aid 1 million youth in attaining wages                     Reform the institutional machinery for
   & self employment                                           creating public transport facilities

                                                 1   8
 2 HOUSING                                                   7 INVESTMENT
  Improve civic infrastructure, including                   PROMOTION
                                             2           7
   public     &  household      sanitation                    Enhance the ease of doing business
   facilities                                                  for the benefit of investors
  Expand availability of affordable                          Attract    higher     investments in
   housing                                                     manufacturing, services & labour
                                                               intensive sectors

 3 ENVIRONMENT                                               6 TOURISM
  Promote social & agro forestry
  Revitalise ground water resources         3           6    Make the state a world class tourist
                                                               destination
  Private    sector  participation  in                       Promote religious, adventure &
   maintaining waste disposal & water                          heritage tourism & attract private
   conservation                                                investment

 4 INFRASTRUCTURE                                4   5       5 AGRICULTURE
  Connect all villages through world class                   Expand the outreach of agriculture
   highways                                                    technology & irrigation to remote
  To be a leader in renewable energy & green                  farms.
   technology                                                 Promote farm level diversification and
  Keep the state power surplus by addition to                 value addition.
   the power generation capacity

 6
MADHYA PRADESH - SANCHI STUPA IN SANCHI, MADHYA PRADESH March 2021 For updated information, please visit www.ibef.org
Madhya Pradesh fact file

                                                                   Bhopal
                                                                      Capital                236 persons per sq km                82.89 million
                                                                                                Population density                total population

                                                          308,000 sq.km.
                                                              geographical area                     34.98 million               37.6 million
                                                                                                  female population            male population

                                                                                                                                931:1000
     Source: Government of Madhya Pradesh                                                                                           Sex ratio
                                                                    70.6%                   administrative districts:   51   (females per 1,000 males)
     Key Insights                                                  literacy rate

     • There are 11 agro-climatic conditions and a variety of soils available in the state to support cultivation of a wide range of crops.
     • Madhya Pradesh is located in central India. The state is surrounded by Uttar Pradesh in North, Chhattisgarh in East, Maharashtra in South,
       Gujarat and Rajasthan in west.
     • The most commonly spoken language of the state is Hindi. English and Marathi are the other languages used.
     • Bhopal, Indore, Gwalior, Jabalpur and Ujjain are some of the key cities of the state.

 Source: Government of Madhya Pradesh website, National Informatics Centre Madhya Pradesh

 7
MADHYA PRADESH - SANCHI STUPA IN SANCHI, MADHYA PRADESH March 2021 For updated information, please visit www.ibef.org
Madhya Pradesh in figures

     Madhya Pradesh’s Contribution to Indian Economy (2020-21)                                 Physical Infrastructure in Madhya Pradesh

 GSDP     GSDP as a percentage of all states’ GSDP*                                                    Installed power capacity (MW) as of February
          India: 100.0 | Madhya Pradesh: 4.25                                                          2021
                                                                                                       India: 379,130.41 | Madhya Pradesh: 25,489.32
          GSDP growth rate (%)
          India*: 11.46 | Madhya Pradesh: -2.12                                                        Wireless subscribers (million) as of January 2021
                                                                                                       India: 1,163.40 | Madhya Pradesh: 76.04
          Per capita GSDP (US$)
          India*: 1,382.99| Madhya Pradesh: 1,504.07
                                                                                                       Internet subscribers (million) as of September 2020
                                                                                                       India: 776.45 | Madhya Pradesh: 51.32
     Social Indicators
                                                                                                       National highway length (km) (as of September 2019)
          Literacy rate (%)                                                                            India: 132,499 | Madhya Pradesh: 8,772.3
          India: 77.7 | Madhya Pradesh: 73.7
                                                                                                       Airports (No.)
          Birth rate (per 1,000 population) (2018)                                                     India: 153 | Madhya Pradesh: 8
          India: 20 | Madhya Pradesh: 24.6

     Industrial Infrastructure                                                                  Investments (as of December 2020 )

          Operational PPP projects (No.)                                                                Cumulative FDI inflow from
          (as of December 06,2019)                                                                      October 2019 to December 2020 (US$ million)
          India: 1,824 | Madhya Pradesh: 187
                                                                                                        India: 75,351.56 | Madhya Pradesh: 263.58
          Operational SEZs (No.) (October 2020)
          India: 262 | Madhya Pradesh: 5

 Note: *- 2018-19, PPP - Public Private Partnership, SEZ - Special Economic Zone, Refer annexure for sources

 8
MADHYA PRADESH - SANCHI STUPA IN SANCHI, MADHYA PRADESH March 2021 For updated information, please visit www.ibef.org
ECONOMIC SNAPSHOT

9
MADHYA PRADESH - SANCHI STUPA IN SANCHI, MADHYA PRADESH March 2021 For updated information, please visit www.ibef.org
Economic snapshot – GSDP

                GSDP of Madhya Pradesh at current prices                                                 Per capita GSDP of Madhya Pradesh at current prices

                                       CAGR (in Rs.) 11.14%                                                                                  CAGR (in Rs.) 9.83%
      140                                                                                         10   1,800                                                                                                     120,000

                                                                                                  9

                                                                       132.98
                                                                                                       1,600

                                                                                                                                                                                   113,079.35
                                                                         9.37

                                                                                       9.18

                                                                                                                                                                                                  109,180.76
      120

                                                                                    126.40

                                                                                                                                                                                    1604.19
                                                                                                                                                                                                                 100,000
                                                                                                  8

                                                                                                                                                                                                  1504.07
                                                                                                       1,400

                                                                                                                                                              99,542.53
                                                        116.44
                                                         8.14
                                           112.70

                                                                                                                                                              1424.27
      100

                                                                                                                                                  1372.41
                                                                                                  7

                                                                                                                                               88,452.00
                                                                                                       1,200                                                                                                     80,000
                                          7.26
                           96.86

                                                                                                                              81,140.00
                                                                                                                               1209.42
                                                                                                  6
                           6.50

       80                                                                                              1,000
              82.66

                                                                                                                 1043.69
                                                                                                               68,320.00
                                                                                                  5                                                                                                              60,000
             5.41

       60                                                                                                800
                                                                                                  4
                                                                                                         600                                                                                                     40,000
       40                                                                                         3
                                                                                                         400
                                                                                                  2
                                                                                                                                                                                                                 20,000
       20                                                                                                200
                                                                                                  1
        0                                                                                         0        0                                                                                                     0

                                                                                                                    2015-16

                                                                                                                                   2016-17

                                                                                                                                                    2017-18

                                                                                                                                                                   2018-19

                                                                                                                                                                                        2019-20

                                                                                                                                                                                                       2020-21
                 2015-16

                             2016-17

                                              2017-18

                                                           2018-19

                                                                          2019-20

                                                                                        2020-21

                                       US$ billion      Rs. trillion                                                                                   US$                   Rs.

       At current prices, the Gross State Domestic Product (GSDP) of                                   The state’s per capita GSDP was ~Rs. 109,180.76 (~US$
        Madhya Pradesh stood at Rs. 9.18 trillion (US$ 126.40 billion) in                                1,504.07) in 2020-21.
        2020-21.
                                                                                                        Per capita NSDP in the state increased at a CAGR of 9.83%
       Between 2015-16 and 2020-21, the GSDP of the state increased                                     between 2015-16 and 2020-21.
        at a CAGR of 11.14%.

 Source: Ministry of Statistics and Programme Implementation

 10
Economic snapshot – NSDP

                NSDP of Madhya Pradesh at current prices                                                   Per capita NSDP of Madhya Pradesh at current prices

                                        CAGR (in Rs.) 11.22%                                            1,600                                                                                                             120,000
                                                                                                    9                                           CAGR (in Rs.) 9.97%
       120                                                                                              1,400

                                                                           8.56

                                                                                                                                                                                               1,465.29
                                                                                                    8

                                                                        121.47
                                                                                                                                                                                                                          100,000

                                                                                          8.27

                                                                                                                                                                                          103,288.17

                                                                                                                                                                                                             1,355.81
                                                                                      113.94

                                                                                                                                                                                                           98,418.19
                                                                                                                                                                        1,294.70
       100                                                                                          7   1,200

                                                           7.40
                                                         105.85

                                                                                                                                                        1,239.83

                                                                                                                                                                    90,486.58
                                           99.11

                                                                                                                                                                                                                          80,000
                                           6.61

                                                                                                    6

                                                                                                                                    1,092.09
                                                                                                        1,000

                                                                                                                                                   79,907.00
        80
                            86.03
                             5.91

                                                                                                                                73,268.00
                                                                                                                      934.98
                                                                                                    5
                                                                                                         800                                                                                                              60,000
              72.59
              4.86

                                                                                                                61,204.00
        60                                                                                          4
                                                                                                         600
                                                                                                                                                                                                                          40,000
                                                                                                    3
        40
                                                                                                         400
                                                                                                    2
                                                                                                                                                                                                                          20,000
        20                                                                                               200
                                                                                                    1

         0                                                                                          0      0                                                                                                              0

                                                                                                                      2015-16

                                                                                                                                      2016-17

                                                                                                                                                          2017-18

                                                                                                                                                                          2018-19

                                                                                                                                                                                                 2019-20

                                                                                                                                                                                                                2020-21
                  2015-16

                              2016-17

                                               2017-18

                                                            2018-19

                                                                            2019-20

                                                                                          2020-21

                                         US$ billion     Rs. trillion                                                                                        US$                    Rs.

       Net State Domestic Product (NSDP) of Madhya Pradesh was                                          The state’s per capita NSDP in 2020-21 was Rs. 98,418.19 (US$
        about Rs. 8.27 trillion (US$ 113.94 billion) in 2020-21.                                          1,355.81).
       Between 2015-16 and 2020-21, the state’s NSDP increased at                                       Per capita NSDP of the state increased at a CAGR of 9.97%
        a CAGR of about 11.22%.                                                                           between 2015-16 and 2020-21.

 Source: Ministry of Statistics and Programme Implementation

 11
Economic snapshot – Percentage distribution of GSVA

   In 2020-21, the primary sector contributed 46.98% to the state’s       Visakhapatnam
                                                                                  GVA composition
                                                                                         port trafficby
                                                                                                      (million
                                                                                                        sectortonnes)
    GSVA at current prices, followed by the tertiary sector (33.55%) and
    secondary sector (19.47%).

   At a CAGR of 16.49%, the primary sector witnessed the fastest               39.06%         CAGR*           33.55%
    growth among the three sectors between FY12 and FY21.

   The tertiary sector expanded at a CAGR of 10.44% between FY12
                                                                                               10.44%
    and FY21. Growth was driven by trade, hotels, real estate, finance,
    insurance, transport, communications and other services.
                                                                                                               19.47%
   The secondary sector expanded at a CAGR of 8.28% between FY12
                                                                                27.09%
    and FY21, driven by the manufacturing, electricity, gas & water
    supply and construction sectors.                                                           8.28%
                                                                                                               46.98%

                                                                                33.85%

                                                                                               16.49%

                                                                                2011-12                        2020-21

                                                                           Primary Sector   Secondary Sector    Tertiary Sector

 Note: CAGR* is in Rs. terms
 Source: Ministry of Statistics and Programme Implementation

 12
Economic snapshot – FDI inflow & investments

   According to the Department for Promotion of Industry and Internal         FDI Inflow in Madhya Pradesh in April 2000-December 2020
                                                                                        Visakhapatnam port traffic (million tonnes)
    Trade (DPIIT), cumulative FDI inflow in Madhya Pradesh was valued                                (US$ million)
    at US$ 263.58 million between October 2019 and December 2020.               2000

   The state will be holding the sixth edition of its Global Investors
    Summit in October 2019. At the previous edition, the state witnessed        1500                                                      76     28     32
                                                                                                                                   80
    expression of interest’s worth Rs. 5,62,887 crore (US$ 83.75 billion).                                                 101
                                                                                                                    118                                        82
   152 investment intentions worth Rs. 12,762 crore (US$ 2.47 billion)         1000                        220
                                                                                                    123
    were filed in the state during 2019.

                                                                                        654
                                                                                 500                                                                                  264

                                                                                   0

                                                                                                     FY12

                                                                                                             FY13

                                                                                                                    FY14

                                                                                                                            FY15

                                                                                                                                   FY16

                                                                                                                                          FY17

                                                                                                                                                 FY18

                                                                                                                                                        FY19

                                                                                                                                                               FY20
                                                                                        FY01-FY11

                                                                                                                                                                      Oct19-Dec20
                                                                             Investment intentions in terms of IEMs filed, LOIs / DILs issued

                                                                                 Year                  Number              Proposed Investments (US$ billion)

                                                                                 2017                       76                                   1.10

                                                                                 2018                       140                                  3.49

                                                                                 2019                       178                                  2.47

 Source: Department for Promotion of Industry and Internal Trade

 13
Economic snapshot – Export trends

        Merchandise Export from Madhya Pradesh (US$ billion)                            Principal Commodities Exported in FY21*

         7.00                                                                                                           Drug Formulations,
                                                                                                                        Biologicals
         6.00                           6.38
                                                                                                                        Oil Meals
                                                                 5.80                                  19%
         5.00                    5.25               5.32
                                                                                                                        Aluminium, Products of
         4.00        4.44                                                                                               Aluminium
                                                                                                             8%
                                                                                                                        Cotton Yarn
         3.00
                                                                                  56%
                                                                                                             6%
         2.00                                                                                                           Cotton Fabrics, Madeups,
                                                                                                          4%            Etc
                                                                                                        4%
         1.00                                                                                         3%                Bulk Drugs, Drug
                                                                                                                        Intermediates
           -
                       FY17

                                 FY18

                                         FY19

                                                     FY20

                                                                 FY21*
                                                                                                                        Others

   Exports from the state stood at US$ 5.80 billion in FY21*.

   In FY21*, the total drug formulations and biological product exports from Madhya Pradesh accounted for US$ 1,099.97 million, which was 19% of
      the total exports.

 Note: * - until February 2021
 Source: DGCIS Analytics

 14
PHYSICAL INFRASTRUCTURE

15
Physical infrastructure – Roads

   Madhya Pradesh has national highways measuring 8,772.3 kms.
      The state also has 11,389 km of state highways, as of September          Road type              Road length (kms)
      2019.
                                                                               National highways           8,772.3
   Under the State Budget 2021-22, the government has allocated Rs.
      6,957 crore (US$ 948.60 million) for development of roads and            State highways              11,389
      bridges.
                                                                               Major district roads        22,129
       Rs. 850 crore (US$ 115.89 million) has been allocated for the
                                                                               Village roads               23,395
          repair and upgrade of roads and Rs. 620 crore (US$ 84.55
          million) has been allocated for the construction of roads in rural   Road length                 64,719
          areas.

   Under the State Budget 2021-22, the government has allocated Rs.
      2,925 crore (US$ 398.83 million) for the Pradhan Mantri Gram Sadak
      Yojana.

   In August 2020, the Union Minister for Road Transport, Highways
      and MSMEs Mr. Nitin Gadkari laid the foundation stones for 45
      highway projects in Madhya Pradesh. Rs. 1.25 trillion (US$ 16.95
      billion) worth of development work is underway in Madhya Pradesh.
      ~60-70% work has been completed on road works approx. worth Rs.
      300 billion (US$ 4.07 billion). These roads are aiming to improve
      connectivity to the tourist spots and backward areas of the state. The
      Minister announced that development work worth Rs. 500 billion
      (US$ 6.78 billion) is likely to be completed by 2023.

 Source: NHAI, Ministry of Road Transport & Highways, State Budget 2020-21
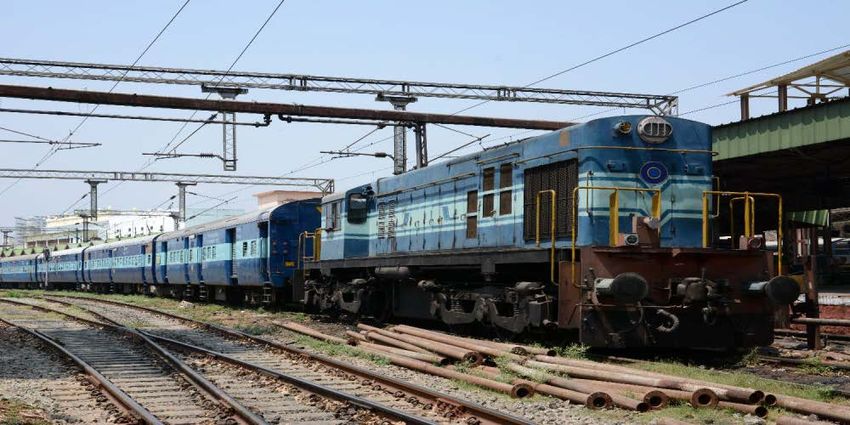
 16
Physical infrastructure – Railways

   Madhya Pradesh has around 4,954 kms of railway lines and the
      state is connected to different states of the country through more
      than 425 trains which travel on daily basis.

   By end of 2019, Habibganj railway station in Madhya Pradesh will
      become Indian Railways’ first airport-like hub.

   The railway network in Madhya Pradesh primarily falls under the
      West-Central Railways, which was formed in 2002 and is
      headquartered in Jabalpur. Part of the state is also covered by
      Central and Western Railways.

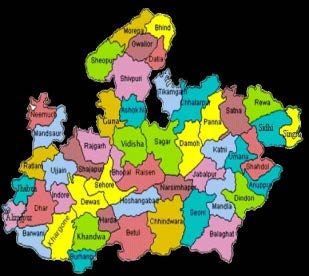
   Being centrally located, the railway network in the state assumes      Source: Maps of India
      great significance. Madhya Pradesh’s capital, Bhopal is one of the
      foremost railway junctions in the country, as 220 trains travel
      through the capital alone.

   Government of India has undertaken redevelopment of Habibganj
      Railways station in Bhopal. The station is being redeveloped at an
      estimated cost of Rs. 100 crore (US$ 15.52 million) and the total
      value of development (including commercial development) has been
      estimated at Rs. 450 crore (US$ 698.21 million).

   Under the State Budget 2021-22, the government has allocated Rs.
      262 crore (US$ 35.73 million) for metro projects in Bhopal and
      Indore.

 Source: News Article, State Budget 2020-21

 17
Physical infrastructure – Airports

  Airport indicators

                                          Aircraft movements                           Passengers                                  Freight
                                                 (in no)                                 (in no.)                                  (in MT)
   Airport

                                       2019-20         2020-21*              2019-20              2020-21*              2019-20              2020-21*

   Bhopal                              10,047              4,774             924,833              393,477                 894                 1,191

   Indore                              14,769              8,419            1,895,686             760,209                7,377                6,643

    Madhya Pradesh has five operating airports at Jabalpur, Bhopal, Indore, Gwalior and Khajuraho.

    Indore and Bhopal airports are the busiest in the state. In 2020-21*, passenger traffic at Indore airport reached 760,209, with overall movement of
      8,419 aircraft. In the same period, passenger traffic at Bhopal airport stood at 393,477, with movement of 4,774 aircraft.

    Both Indore and Bhopal airports have strong cargo handling capacity. In 2020-21*, Indore airport handled 6,643 million tonnes of cargo, whereas
      Bhopal airport handled 1,191 million tonnes of cargo.

    Government of India has granted ‘site clearance’ approval to Madhya Pradesh Road Development Corporation Limited for setting up Singrauli
      domestic greenfield airport in Waidhan, Singrauli.

 Note: * - until February 2021
 Source: Airports Authority of India

 18
Physical infrastructure – Power

                                                                                                      Breakdown of installed capacity by source of power generation
                                 Installed power capacity (MW)
                                                                                                                          (as of February 2021)
                                                                                                                           1.07%
      30,000

      25,000                                                                                                                                      Thermal Power

                                                                                          25,489.32
                                                                             25,066.25
                                                                                                                  20.42%

                                                                23,334.40
      20,000
                                                   20,321.87                                                                                      Hydropower
                                      19,618.28
                     18,813.65

      15,000

      10,000                                                                                                   12.65%                             Renewable Power

        5,000                                                                                                                      65.86%
                                                                                                                                                  Nuclear Power
            0
                   2016              2017         2018         2019         2020         2021*

   As of February 2021, Madhya Pradesh had a total installed power generation capacity of 25,489.32 MW, comprising 7,187.62 MW under state
      utilities, 7,326.09 MW under central utilities and 10,975.61 MW under the private sector.

   Of the total installed power generation capacity, 16,787.03 MW was contributed by thermal power, 3,223.66 MW (hydropower), 273.00 MW
      (nuclear power) and 5,205.57 MW (renewable power).

   Under the State Budget 2021-22, the government has allocated Rs. 16,745 crore (US$ 2.28 billion) for the energy sector.

   In January 2021, Madhya Pradesh State Minster of New and Renewable Energy, Hardeep Singh Dang, announced that the state government is
      constructing the world's largest floating solar energy project with a capacity of 600 MW at Omkareshwar Dam on Narmada river in the Khandwa
      district of Madhya Pradesh. The estimated investment in this project stands at Rs. 3,000 crore (US$ 409.18 million) with commencement of power
      generation by 2022-23.

 Note: MW- Megawatt       * - as of February 2021
 Source: Central Electricity Authority, news sources, State Budget 2021-22

 19
Physical infrastructure – Telecom

 Performance status of Bharat Net project                                          Telecom infrastructure* (January 2021)

                                                                                   Wireless subscribers                              76,046,519

                                                                                   Wireline subscribers                               704,609

  Service-ready GPs                                                                Internet subscribers (in million) as of
                                                               13,899                                                                  51.32
  (November 2020)                                                                  September 2020

                                                                                   Teledensity (in %)                                  67.40

                                                                                   Mobile number portability requests (in million)     38.63

   According to the Telecom Regulatory Authority of India (TRAI), Madhya Pradesh* had ~76.04 million wireless and 0.70 million wireline
      subscribers, as of January 2021.

   Internet subscribers in the state* reached 51.32 million, as of September 2020.

   As of January 2021, teledensity (telephone connections per 100 persons) in Madhya Pradesh* stood at 67.40%.

   As of January 2021, 38.63 million people had submitted requests for mobile number portability in the state*.

 Source: * - including Chhattisgarh
 Source: Telecom Regulatory Authority of India, Department of Telecommunications

 20
Physical infrastructure – Urban Development

   In State Budget 2021-22, an allocation of Rs. 900 crore (US$ 122.75                     Smart cities in Madhya Pradesh
      million) was made for the Smart Cities Mission.
                                                                                            Cities                  Population               Literacy rate
   Seven cities of the state have been selected for Government of
      India’s Smart Cities Mission.                                                         Bhopal                   2,371,061                   80.37%

                                                                                            Indore                   3,276,697                   80.87%
   Also, the state is home to 34 cities which have been chosen for
      AMRUT Mission.                                                                        Gwalior                  2,032,036                   76.65%

                                                                                            Ujjain                   1,986,864                   72.34%
   Under the State Budget 2021-22, the government has been allocated
      Rs. 1,500 crore (US$ 204.61 million) for ‘Housing for All’ under                      Jabalpur                 2,463,289                   81.07%
      Urban Development & Housing Department and Rs. 1,000 crore
                                                                                            Sagar                    2,378,458                   76.46%
      (US$ 136.41 million) towards Atal Mission for Rejuvenation and
      Urban Transformation.                                                                 Satna                    2,228,935                   72.26%

   As of December 23, 2020, Madhya Pradesh and Andhra Pradesh
      have taken the lead to undertake the urban local bodies (ULB)                         Rural
      reforms. Madhya Pradesh has been permitted to mobilise additional
      Rs. 2,373 crore (US$ 323.52 million) for better public health and                      In the State Budget 2021-22, Rs. 2,500 crore (US$ 340.99 million)
      sanitation services.                                                                     has been allocated to the Pradhan Mantri Awas Yojana (Grameen).

   In October 2020, a US$ 270 million loan was signed by the Asian                          As of September 2020, 1.75 lakh houses were built under Pradhan
      Development Bank (ADB) and the Government of India to establish                          Mantri Awaas Yojana - Gramin at Madhya Pradesh.
      water supply and integrated storm water and sewage management
      infrastructure; and boost capacity of urban local bodies (ULBs) in
      Madhya Pradesh to improve service delivery.

 Source: Bhopal Municipal Corporation, Ministry of Urban Development, Census 2011, State Budget 2021-22

 21
SOCIAL INFRASTRUCTURE

22
Social infrastructure – Education

   Madhya Pradesh had a literacy rate of 70.6%; the male literacy rate
                                                                                           Category                                         Literacy rate (%)
      is 80.5% and the female literacy rate is 60.0%.

   As per the State Budget 2021-22, Rs. 9,793 crore (US$ 1.33 billion)                    Total                                                    70.6
      has been allocated for the establishment of primary schools, Rs.
      5,329 crore (US$ 726.94 million) for secondary education and Rs.                     Male                                                     80.5
      4,027 crore (US$ 549.33 million) for higher secondary education.

   Under the State Budget 2021-22, the government has allocated Rs.                       Female                                                   60.0
      3,993 crore (US$ 544.69 million) for Samgra Shiksha Abhiyan and
      Rs. 1,100 crore (US$ 150.05 million) for CM Rise scheme.
                                                                                           AICTE Approved Education Statistics (2020-21)
   In 2020-21, Madhya Pradesh had a total of 644 AICTE-approved
      institutes.
                                                                                                             Undergraduate           Postgraduate              Diploma
   In December 2020, the state government partnered with IIM Indore
      to create video-based training for teachers.

                                                                                           Total
                                                                                                                    300                    429                    258
                                                                                           Institutions
      Reputed institutes of Madhya Pradesh

   Indian Institute of Management (IIM), Indore
                                                                                           Total
                                                                                                                  83,286                 73,161                 43,606
   Indian Institute of Forest Management, Bhopal                                          Intake

   Institute of Hotel Management, Bhopal

   International Institute of Professional Studies, Indore                                Faculties              24,113                  5,839                   952
   Indian Institute of Technology (IIT), Indore

 Source: AICTE, Directorate of Technical Education, Madhya Pradesh, Higher Education Department- Government colleges of Madhya Pradesh, Madhya Pradesh Education Portal,
 National Health Portal, State Budget 2021-22

 23
Social infrastructure – Health

  Health institutions (May 2020)                                                              Health indicators of Madhya Pradesh (2018)

                                                                                                         1
  Sub Centres                                                   12,128                        Birth rate                                   24.6

                                                                                                             1
                                                                                              Death rate                                   6.7
  Primary Health Centres                                         1,566
                                                                                                                     2
                                                                                              Infant mortality rate                        48
  Community Health Centres                                        424
                                                                                              Life expectancy at birth (years)
  Sub District Hospitals                                          211
                                                                                              Male (2011-15)                               64.5

  District Hospitals                                               52                         Female (2011-15)                             65.3

    As of May 2020, the public healthcare services network of Madhya Pradesh comprised 52 district hospitals, 424 community health centres, 1,566
       primary health centres and 12,128 sub-health centres.

    The state government proposed Rs. 11,619 crore (US$ 1.58 billion) for development of the Health and Family Welfare Department in the state in
       2021-22.

    In October 2020, with an investment of Rs. 150 crore (US$ 20.45 million), the 200-bedded super speciality block (SSS) was established under the
       Government of India's Pradhan Mantri Swasthya Suraksha Yojana (PMSSY). The SSB will be configured with six portable operation theatres, 200
       super specialty beds, 30 ICU beds and eight fans. This facility will host 14 postgraduate students for training.

 Source: 1Per thousand persons, 2Per thousand live births
 Source: Ministry of Health & Family Welfare, Government of India, Sample Registration System (SRS) Bulletin, State Budget 2021-22

 24
INDUSTRIAL INFRASTRUCTURE

25
Industrial infrastructure

   Madhya Pradesh State Industrial Development Corporation Limited                            Operational SEZs in Madhya Pradesh (As of October 2020)
      (MPSIDC) is the nodal agency for industrial growth in the state. It is
      the central point to coordinate, activate and ensure implementation of
      mega infrastructure projects.                                                            Name of SEZ                           Industry     Location

   MPSIDC has established seven growth centres at Bhopal, Gwalior,
      Jabalpur, Indore, Rewa, Ujjain and Sagar. These growth centres are                       Crystal IT Park                       IT/ ITeS      Indore
      known as Madhya Pradesh Audyogik Kendra Vikas Nigam Limited
      (AKVN).
                                                                                               Infosys Ltd.                              IT        Indore
   Work on development of infrastructure in 22 industrial units is
      underway with an investment of Rs. 1,820 crore (US$ 281.12
                                                                                               Impetus Infotech Pvt.
      million). The works is expected to be completed by December 2018.^                                                             IT/ ITeS      Indore
                                                                                               Ltd.

   The state is home to five operational SEZs, six notified SEZs and 12
      formally approved SEZs. Bhopal, Indore, Gwalior and Jabalpur are                         Tata Consultancy
                                                                                                                               IT/ITES/BPO/KPO     Indore
                                                                                               Services Limited
      the major locations where SEZs have been approved. These SEZs
      have been proposed for IT/ITeS, mineral-based, agro-based and
      multi-products.                                                                          Indore SEZ                         Multi-product    Dhar

   Under the State Budget 2021-22, the government has allocated Rs.
      1,237 crore (US$ 168.83 million) for Magnificent MP Investment
      Attraction Scheme under the Department of Industrial Policy and
      Investment Promotion and Rs. 480 crore (US$ 65.51 million) for
      industrialisation infrastructure development.

 Source: MP Trade & Investment Facilitation Corporation Ltd, Department for Promotion of Industry and Internal Trade, State Budget 2021-22

 26
KEY SECTORS

27
Key sectors – Agriculture and Food processing

       Agriculture Exports from Madhya Pradesh (US$ million)**                                                          Production - 2019-201                Area- 2019-201
                                                                                                Crop
                                                                                                                            (‘000 tonnes)                    (‘000 hectares)
         160

         140                                                                                     Fruits                            7916.39                          385.69

                                                   141.36

                                                              134.60
         120
                                                                                                 Vegetables                       19832.27                          1007.86

                                                                        123.69
         100
                    108.81

                                                                                                 Aromatics and

                                                                                  94.94
                                         93.03
                              91.53

           80                                                                                                                       101.97                           40.46
                                                                                                 Medicinal
           60

           40                                                                                    Spices                            3010.17                          639.70
           20

            0
                  FY15       FY16      FY17      FY18       FY19       FY20      FY21^           Honey                               2.30

   Agriculture is the main source of livelihood for the people of the Madhya Pradesh.

   Rs. 16,142 crore (US$ 2.2 billion) was allocated to agriculture and allied activities in the State Budget 2021-22.

       Of this, Rs. 4,592 crore (US$ 626.68 million) has been allocated to the Atal Krishi Jyoti Yojana and Rs. 3,200 crore (US$ 436.71 million) to the
         Mukhya Mantri Kisan Kalyan Yojana.

   Two mega food parks have been sanctioned by Government of India in Madhya Pradesh. One of the mega food parks - Indus Mega Food Park,
      Khargone - is already operational and has a leasable area of 24 acres.

   In 2019-20, the total production of horticulture crops in the state was expected to be 31,243.51 thousand tonnes and area under production was
      2,106.23 thousand hectares. In 2019-20, total production of vegetables and fruits in the state was estimated at 19,832 million tonnes and 7,916
      million tonnes, respectively.
 Note: *Estimate, #Third Advance Estimates of Production of Foodgrains for 2019-20,**Target ^- Between April and September 2020; 1As per third advanced estimates
 Source: MP State Facts Profile Department of Agriculture and Cooperation, National Horticulture Board, MP Economic Survey 2017-18, State Budget 2021-22

 28
Key sectors – Textiles…(1/2)

    Production of textile raw material in Madhya Pradesh (in MMT)                                         Exports of Cotton Yarn from Madhya Pradesh (US$ million)

         50                                                                                         300   400
                                                                                                          350

                                                                                                                 377.42
                                                                                                    250

                                                                                                                           366.37
         40
                                        248.00

                                                         257.00                                     200   300

                                                                                                                                                                   307.87
         30
                       195.00

                                                                                                          250

                                                                                                                                                         266.56
                                                                                                    150

                                                                                                                                               350.87
         20                                                                                               200

                                                                                            24.00

                                                                                                                                     214.67
                                                                                                    100
                                                                    20.50

                                                                               20.50
                                                                  111.00

                                                                             103.00

                                                                                         100.00
               19.00

                                19.00

                                                                                                                                                                             250.22
                                                 18.00

                                                                                                          150
         10                                                                                         50
                                                                                                          100
          0                                                                                         0
                 FY14             FY15             FY16            FY17       FY18        FY19             50
                                                                                                            0
                                Cotton Production^                     Silk Production                          FY15      FY16      FY17      FY18      FY19      FY20      FY21*

       Madhya Pradesh is one of the major cotton producing states of India. In 2018-19, cotton production in the state reached 24 metric tonnes^.

       Exports of cotton yarn is estimated at US$ 260.22 million in FY21* and accounts for 4% of the state’s total exports.

       To attract investments into the sector, the Government has provided an interest subsidy for five years at a rate of 5% for textile projects and
         7% for composite textile projects without capping. Furthermore, the Government provided 100% assistance in plant & machinery for eight
         years under Industrial Investment Promotion Assistance Scheme.

       During 2018-19, silk production in the state stood at 100 million metric tonnes.

 Note: ^in lakhs bales of 170 kgs each, MMT - Million Metric Tonne, *- Between April 2020 and February 2021
 Source: The Cotton Corporation of India Ltd, 1 Projected, As per Cotton Advisory Board

 29
Key sectors – Textiles…(2/2)

  Key players in textiles industry

                               Trident Limited, the flagship company of Trident Group, is one of the largest integrated home textiles
                                manufacturers over the world. The company has a bed linen manufacturing plant in Budni, Madhya Pradesh. The
                                facility has capacity of 43.2 million metres per annum and is home to 500 looms. Also, the world’s largest
         Trident Limited        standalone terry towel manufacturing facility resides at the plant.

                               Grasim Industries Ltd, a flagship company of the Aditya Birla Group, is one of the leading companies in India with
                                diverse interests in cement, chemicals and textiles. Its textile plants are located at Bhiwani, Haryana and
                                Malanpur, Madhya Pradesh. The Malanpur unit of the company manufactures worsted dyed yarn spun from pure
                                merino wool along with polyester and other blends. The company has a wide retail network and also serves
      Grasim Industries Ltd     international apparel manufacturers.

                               The Vardhman Group is a leading textile conglomerate in India having a turnover of US$ 1.1 Billion. The yarn
                                manufacturing units are located in Mandideep (130,994 spindles), Satlapur (222,624 spindles) and Bhudhni
                                (60,000 spindles). In September 2013, the company added 36,288 spindles to its Satlapur plant. Furthermore, the
                                Bhudhni plant has a fabric weaving unit (400 looms) and a fabric processing unit with a capacity of 40 million
  Vardhman Textiles Ltd         metres per annum.

                               Raymond is a major fabric manufacturer in India. Besides, the company also has business interests in engineering
                                and aviation. The company is one of the largest integrated manufacturers of worsted fabric in the world and
                                commands over 60.0% market share in worsted suiting in India. The total production capacity of the company is
                                around 38 million metres of wool and wool-blended products. One of the four plants of the company is located at
         Raymond Ltd            Chhindwara in Madhya Pradesh.

 30
Key sectors – Tourism

    Madhya Pradesh is blessed with scenic beauty, rich heritage of                Total tourist arrivals in Madhya Pradesh (in millions)
      pilgrim centres, temples and wildlife sanctuaries.
                                                                                 90.00
                                                                                                                                  0.33
    In 2019, foreign tourist arrivals and domestic tourist visits in the        89.00
      state stood at 0.33 million and 88.71 million, respectively.               88.00                                           88.71
                                                                                 87.00
                                                                                 86.00
    As per State Budget 2019-20, the state Government proposed an
                                                                                 85.00        0.38                0.38
      allocation of Rs. 229 crore (US$ 32.77 million) for the development        84.00
      of the state’s tourism department.                                         83.00       83.97                83.97
                                                                                 82.00
    Major places of tourist interest in Madhya Pradesh are as follows:          81.00
                                                                                              2017                2018            2019
      •   Kanha: One of the largest wild-life sanctuaries in Asia.
                                                                                                       Domestic     Foreign
      •   Khajuraho: Some of the most famous sculptures in the world.
      •   Bhimbetka: The oldest cave paintings in the world.
      •   Sanchi: The oldest Buddhist Stupa in the world.
      •   Bandhavgarh: The highest density of tiger population in the
          country.
      •   Bhedaghat: Scenic marble rocks rising up to 100 feet.

 Source: MP economic survey 2017-18, Ministry of Tourism, State Budget 2019-20

 31
Key sectors – Pharmaceuticals

    Madhya Pradesh is home to over 280 pharmaceutical units operating                              Exports of drug formulations and biologicals from Madhya
       in the industrial areas of Dewas, Indore, Pithampur, Mandideep and                                             Pradesh (US$ million)
       Malanpur.
                                                                                                      1400
    Indore is one of the largest producers of pharmaceuticals like tablets,
       capsules, formulations in India.                                                               1200

                                                                                                                                             1,158.55
    Pithampur SEZ located in Indore is a production hub for

                                                                                                                                                        1,099.97
                                                                                                      1000
       pharmaceutical majors such as Cipla, Lupin, Mylan, etc.

                                                                                                                         909.24
                                                                                                       800

                                                                                                                                   845.22
    Exports of drug formulations and biologicals will likely account for
       ~24% of the state’s total exports in FY21*.                                                     600

                                                                                                                525.78
                                                                                                       400

                                                                                                       200

                                                                                                            0

                                                                                                                FY17

                                                                                                                         FY18

                                                                                                                                   FY19

                                                                                                                                             FY20

                                                                                                                                                        FY21*
 Note: *- until February 2021
 Source: Directorate General of Commercial Intelligence and Statistics, Ministry of Commerce and Industry

 32
Key sectors – Mineral-based industry

    Madhya Pradesh is one of the key mineral-producing states in India,        Mineral production in Madhya Pradesh (‘000 MT)
     providing tremendous potential for industrial growth.

    The state has rich deposits of coal, limestone and manganese.
                                                                                Mineral          2016-17    2017-18     2018-19    2019-20
     Bauxite, dolomite, fire clay, granite and marble stones are other
     mineral resources available.
                                                                                Coal             108,548    112,239     118,661    113,804
    Major mineral-based industries in the state are cement, thermal
     power generation, ceramic-products, tiles and refractory.
                                                                                Bauxite          658.38      581.39      722.54    637.83
    Madhya Pradesh is the sole diamond producing state in the country.
     Diamond production in the state reached 25,603 thousand tonnes in          Copper ore      2,415.33    2,339.04    2,542.15   2,406.35
     2019-20.

    MOIL Ltd., a state-owned manganese ore mining company, is                  Copper conc.      68.19      75.48       82.94      60.95
     working in Madhya Pradesh and Maharashtra on new projects worth
     Rs. 5.18 billion (US$ 78.79 million), with the company aiming to           Iron ore          1,730      2,679       2,792      3,124
     complete these projects by August 2021. At the company's Ukwa
     mine in Madhya Pradesh, a project worth Rs. 771.5 million (US$             Manganese ore    648.13      831.35       944        906
     10.46 million) is underway to set up a sinking vertical shaft at a depth
     of 324 metres.
                                                                                Phosphorite       68.80      113.30      98.60      99.30
    At Balaghat mine in Madhya Pradesh, work for sinking a large
     diameter high-speed vertical shaft of 750-metres depth is                  Diamond (in
                                                                                                 36,516      39,699      38,437    25,603
                                                                                carat)
     undergoing. At the Rs. 2.59 billion (US$ 35.12 million) project site,
     the shaft sinking and lining up to 480 metres depth is complete and
                                                                                Limestone        35,843      42,744      49,762    43,686
     the overall project is scheduled to be completed by July 2021.

 Note: MT - Metric Tonnes
 Source: Indian Bureau of Mines

 33
Key industries – Mineral-based industry

                          Hindustan Copper Ltd (HCL) is a vertically integrated copper manufacturing company. In 1982, the company
                           established its Malanjkhand copper project, which has the single-largest copper deposit in the country. The
                           Malanjkhand mine has a copper deposit of 221 million tonnes with 1.3% copper concentration. The company
                           possesses an open-pit mine with a capacity of 2 million tonnes per annum, concentrator plant, tailing disposal
                           system and other auxiliary facilities. The plant contributes around 80.0% of the copper production of the company.
                           HCL’s mines and plants are spread across Rajasthan, Jharkhand, Madhya Pradesh and Maharashtra.
  Hindustan Copper Ltd

                          NMDC is a public sector unit involved in mining of a wide range of minerals such as iron, copper, limestone,
                           dolomite, gypsum, tin, graphite and diamond. The company is the single largest iron ore producer in the country.
                           NMDC is the only organised producer of diamonds in India and produces diamond from its Majhgawan mine at
                           Panna in Madhya Pradesh. The production capacity of the mine is around 84,000 carat per annum. The mine
                           employs around 199 persons.

       NMDC Ltd

 34
KEY PROCEDURES AND POLICIES

35
Key approvals required
                  List of approvals and clearances required                                                       Departments to be consulted

                                                                                                                   DIC for SSI/ SIA for large and medium
        Prior to setting up the unit                                   Registration
                                                                                                                                 industries

                                                        Allotment of land/shed                                  DI/ SIDC/ Infrastructure Corporation/ SSIDC

                                                                                                                District authorities/ State DI/ Dept. of Town
                                                       Permission for land use                                  and Country Planning (in case industry is
                                                                                                                    located outside an industrial area)

          No-Objection Certificate (NOC) under the Water and Air                                                 Madhya Pradesh Pollution Control Board
                                                            Act
                                                                                                                Town and Country Planning/ Municipal and
               Approval for construction activity and building plan                                           local authorities/ Chief Inspector of Factories/
                                                                                                                 Pollution Control Board, Electricity Board

                                                                                  NOC                                             Fire Department

         Provisional Trade Tax registrations / Registration under                                              Central and State Excise Departments, Sales
                                     Central Sales Tax (CST) Act                                                             Tax Department
        Before commencement of production

                                          NOC under the Water and Air Act                                         Madhya Pradesh Pollution Control Board

                                                                                   NOC                                             Fire Department

        Permanent trade tax registration under Central Sales Tax                                                Central and State Excise Departments, Sales
        Act 1956 / Registration under Central Sales Tax Act 1956                                                              Tax Department

         After commencement of production/activity
                                                                                                                     Department of Commerce, Industry &
                                                                        Registration                                            Employment

 Note: SIDC- State Industrial Development Corporation, SSI- Small Scale Industries, SIA- Secretariat of Industrial Assistance, DIC- District Industrial Center,
 Source: MP Trade & Investment Facilitation Corp. Ltd., SSIDC- Small Scale Industrial Development Corporation

 36
Key investment promotion offices

  Agency                                 Description

                                          The department is responsible for industrialisation in the state through development of small, medium and
                                           large scale industries and new investments. The department is also responsible for creation of basic
  Department of Commerce, Industry
                                           infrastructure and development of industrial parks. The department has several support institutions such
  & Employment
                                           as Madhya Pradesh State Industrial Development Corporation (MPSIDC) and Audhyogik Kendra Vikas
                                           Nigam (AKVN) in six cities.

                                          District Trade and Industries Centres are district-level offices of the Department of Commerce, Industry
  District Trade and Industries Centre     and Employment of the state Government. These centres are empowered to provide clearance for setting
                                           up industrial units.

                                          Madhya Pradesh State Industrial Development Corporation (MPSIDC) is a support institution of
  Madhya Pradesh State Industrial          Department of Commerce, Industry and Employment of the state Government. The organisation had the
  Development Corporation                  mandate to promote the state as an industrial destination and help companies set up and expand
                                           industries in Madhya Pradesh.

 37
Contact list

  Agency                                                    Contact information

                                                            Mantralaya, Vallabh Bhawan
                                                            Bhopal - 462 004
  Department of Commerce, Industry & Employment             Madhya Pradesh, India
                                                            Phone: 91-755-2441061
                                                            Website: www.mpindustry.org

                                                            Directorate of Industries
                                                            Vindhyachal Bhawan
                                                            Bhopal
  Directorate of Industries                                 Madhya Pradesh, India
                                                            Phone: 91-755-2677988, 2677966
                                                            Email: indsbpl@mp.nic.in
                                                            Website: www.mpindustry.org

                                                            AVN Towers
                                                            192 Zone-1, M.P. Nagar
                                                            Bhopal-462 011, Madhya Pradesh
  Madhya Pradesh State Industrial Development Corporation
                                                            Phone: 91-755 - 427 0370
  Limited
                                                            Fax: 91-755- 427 0280
                                                            E-mail: admin@mpsidc.org, mpsidc@sancharnet.in
                                                            Website: www.mpsidc.org

 38
Cost of doing business in Madhya Pradesh

  Cost parameter                                          Cost estimate            Source

  Cost of industrial land (per sq. ft.)                    US$ 4.8-28.7            Industry sources

  Hotel cost per room per night
                                                           US$ 76.6-95.7           Leading hotels in the state
  (four-star, five-star hotel)

  Residential rent
                                                           US$ 268-335             Industry sources
  (for a 2,000 sq ft house, per month)

  Commercial rent
                                                            US$ 0.7-3.2            Industry sources
  (per sq ft per month)

                                                                                   Madhya Pradesh Electricity Regulatory
  Power cost (per kWh)                               Industrial: 8-12.4 US cents
                                                                                   Commission

                                                                                   Labour Department, Madhya Pradesh
  Labour cost (minimum wages per day)                        US$ 3.73
                                                                                   Government

 Source: Madhya Pradesh State Portal, PwC Research

 39
State acts & policies…(1/2)

      1
                      PM SVANidhi scheme 2020
                      To help poor street vendors, impacted by COVID-19, resume livelihood activities.

                      Policy for women employment

      2               In December 2020, the state government announced to form a policy to increase the
                      number of job opportunities for women in industries.

                     Pradhan Mantri Kisan Samman Nidhi (PM-Kisan) scheme

      3
                     In September 2020, Madhya Pradesh’s Chief Minister announced that Rs. 4,000 (US$ 54.53)
                     will be transferred to accounts of 1,75,000 farmers in the state every year in two instalments
                     under the Pradhan Mantri Kisan Samman Nidhi (PM-Kisan) scheme.

                      Draft Madhya Pradesh Electric Vehicle (EV) Policy 2019
                      To put in place measures to support the creation of jobs in driving, selling, financing,

      4               servicing, charging and manufacturing of EVs.
                      To enable faster adoption of electric vehicles in Madhya Pradesh by ensuring safe, reliable,
                      accessible and affordable Charging Infrastructure eco-system.

 40
State acts & policies…(2/2)

                      Tourism Policy 2016 (As amended in 2019)
                      To promote balanced and sustainable tourism, which enables socio-economic development

      5               and establishes Madhya Pradesh as a destination that provides a complete tourism
                      experience. Aims at providing an effective regulatory mechanism for sustainable tourism
                      and developing the sector through PPP.

                      Industrial Promotion Policy 2014 (Amended as of December 2018)
                      To improve investor facilitation and ensure rapid economic development and employment

      6               opportunities through sustainable use of available resources. Promotes SMEs and ensures
                      PPP initiatives for industrialisation. Envisages an industry-friendly administration and
                      attracting investments by developing quality infrastructure.

      7
                     MP Incubation and Start-Up Policy 2016
                     To strengthen the start-up culture in the state by nurturing entrepreneurial skills

                      IT, ITeS and ESDM Policy 2016

      8
                      To increase the flow of investments in the state in Information Technology industry, ITeS &
                      ESDM sectors.
                      To promote development of the IT, ITeS and ESDM sectors in a balanced manner in the State.

                      Madhya Pradesh Health Sector Investment Promotion Scheme, 2020

      9               To encourage private investments in healthcare infrastructure in the state by incentivising
                      establishment of standalone healthcare centres.

 41
APPENDIX

42
Sources

                       Data                                                                Sources

 GSDP (state)                                  Ministry of Statistics and Programme Implementation

 Per capita GSDP figures                       Ministry of Statistics and Programme Implementation

 Per Capita GSDP (India)                       Ministry of Statistics and Programme Implementation

  Installed power capacity (MW)                Central Electricity Authority

  Wireless subscribers (No)                    Telecom Regulatory Authority of India

  Internet subscribers (million)               Telecom Regulatory Authority of India

  National highway length (km)                 NHAI, Roads and Building Department-Government of India

  Major and Minor Ports (No)                   India Ports Association 2019

  Airports (No)                                Airports Authority of India

  Literacy rate (%)                            Census, 2011

  Birth rate (per 1,000 population)            SRS Bulletin, May 2020

 Cumulative FDI equity inflows (US$ billion)   Department for Promotion of Industry and Internal Trade

  Operational PPP projects (No)                DEA, Ministry of Finance, Government of India

  Notified SEZs (No)                           Ministry of Commerce & Industry, Department of Commerce

 43
Exchange rates

  Exchange Rates (Fiscal Year)                                                 Exchange Rates (Calendar Year)

                    Year                           Rs. Equivalent of one US$               Year                 Rs. Equivalent of one US$
                  2004-05                                   44.95                          2005                          44.11

                  2005-06                                   44.28                          2006                          45.33
                  2006-07                                   45.29                          2007                          41.29
                  2007-08                                   40.24                          2008                          43.42
                  2008-09                                   45.91                          2009                          48.35
                  2009-10                                   47.42                          2010                          45.74
                  2010-11                                   45.58                          2011                          46.67
                  2011-12                                   47.95                          2012                          53.49
                  2012-13                                   54.45                          2013                          58.63
                  2013-14                                   60.50                          2014                          61.03
                  2014-15                                   61.15                          2015                          64.15
                  2015-16                                   65.46                          2016                          67.21
                  2016-17                                   67.09                          2017                          65.12
                  2017-18                                   64.45                          2018                          68.36
                  2018-19                                   69.89                          2019                          69.89
                  2019-20                                   70.49                          2020                          74.18
                  2020-21                                   72.59                         2021*                          73.69

 Note: As of February 2021
 Source: Reserve Bank of India, Average for the year

 44
Disclaimer

  India Brand Equity Foundation (IBEF) engaged Sutherland Global Services private Limited to prepare/update this presentation.

  All rights reserved. All copyright in this presentation and related works is solely and exclusively owned by IBEF, delivered during the course of
  engagement under the Professional Service Agreement signed by the Parties. The same may not be reproduced, wholly or in part in any material
  form (including photocopying or storing it in any medium by electronic means and whether or not transiently or incidentally to some other use of this
  presentation), modified or in any manner communicated to any third party except with the written approval of IBEF.

  This presentation is for information purposes only. While due care has been taken during the compilation of this presentation to ensure that the
  information is accurate to the best of Sutherland Global Services’ Private Limited and IBEF’s knowledge and belief, the content is not to be construed
  in any manner whatsoever as a substitute for professional advice.

  Sutherland Global Services Private Limited and IBEF neither recommend nor endorse any specific products or services that may have been
  mentioned in this presentation and nor do they assume any liability, damages or responsibility for the outcome of decisions taken as a result of any
  reliance placed on this presentation.

  Neither Sutherland Global Services Private Limited nor IBEF shall be liable for any special, direct, indirect or consequential damages that may arise
  due to any act or omission on the part of the user due to any reliance placed or guidance taken from any portion of this presentation.

 45
You can also read