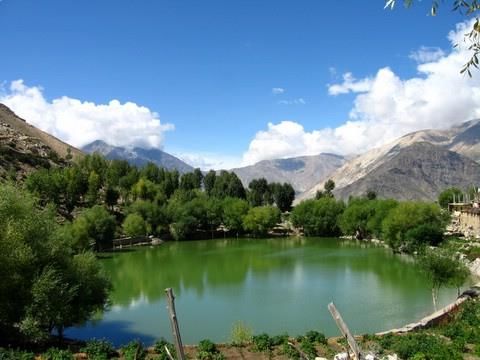
HIMACHAL PRADESH THE ABODE OF THE GODS - NAKO LAKE IN KINNAUR VALLEY, HIMACHAL PRADESH
←
→
Page content transcription
If your browser does not render page correctly, please read the page content below
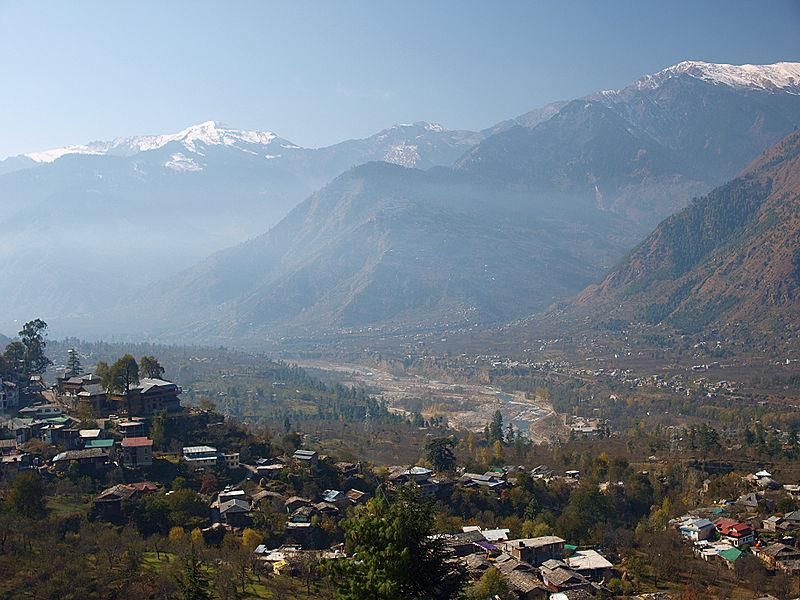
NAKO LAKE IN KINNAUR VALLEY, HIMACHAL PRADESH

 HIMACHAL PRADESH
 THE ABODE OF THE GODS

For updated information, please visit www.ibef.org                                   October 2018

Table of Content

  Executive Summary .…………….…….…....3

  Introduction ……..………………………...….4

  Economic Snapshot ……………….….…….8

 Physical Infrastructure ………..……...........14

  Social Infrastructure ...................................21

  Industrial Infrastructure ……...……….........24

 Key Sectors ………….……………..…..…...27

 Key Procedures & Policies……...……..…...34

 Annexure.………….………….......................43
EXECUTIVE SUMMARY
Himachal Pradesh is one of the fastest-growing states in India. Its per capita Gross State Domestic Product
Strong economic growth
(GSDP) was estimated at Rs 186,777.57 (US$ 2,898.02) during 2017-18.
Himachal Pradesh, known as the Land of Gods, is famous for its topographic diversity & pristine natural
Tourists paradise beauty. In 2017, the state witnessed a total of 19.6 million tourists, out of which 19.1 million were domestic
tourists and 471,000 were foreign tourists.
With a hydro power potential of 18,820 MW (of which just 9,755 MW has been harnessed), Himachal Pradesh
India’s hydro-power hub accounts for 12.66 per cent of the country’s total hydro power potential. All villages of Himachal Pradesh have
been electrified.
Government’s emphasis on improving productivity has yielded positive results in the state. Production of food
Increasing agricultural
grains is targeted at 1.67 million metric tonnes in 2018-19. Horticulture production in the state reached 2,423
productivity thousand metric tonnes in 2017-18, as per 1st advance estimates.
Himachal Pradesh has a rich heritage of handicrafts. These include woollen and pashmina shawls, carpets,
Heritage silver and metal ware, embroidered chappals, grass shoes, Kangra and Gompa style paintings, wood work,
horse-hair bangles, wooden and metal utensils and various other house hold items.
Source: Himachal Pradesh Economic Survey 2016-17, 2017-18, Department of Agriculture Cooperation and Farmers Welfare
3 HIMACHAL PRADESH For updated information, please visit www.ibef.org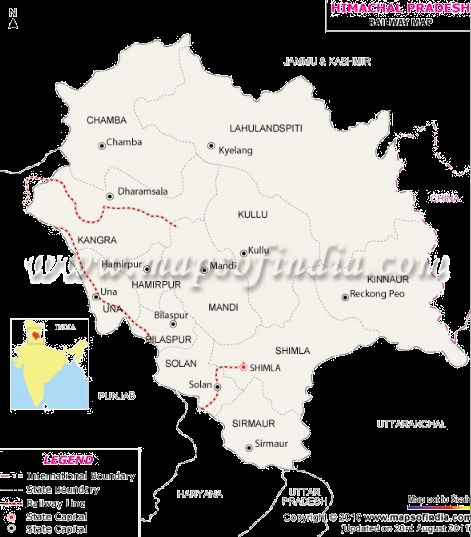
HIMACHAL PRADESH

INTRODUCTION
FACT FILE
Himachal Pradesh is located in the northern region of India. The
state is surrounded by Jammu & Kashmir on the North, Punjab on
the West and the South-West, Haryana on the South, Uttar Pradesh
on the South-East and China on the East.
Being a sub-Himalayan state, Himachal Pradesh has a varied
climate that changes with altitude. The climate ranges from warm
and sub-humid tropical at low altitudes to cold and icy at high
altitudes. There are three main seasons: winter from October to
March, summer from April to June and rainy from July to September.
Parameters Haryana
Agriculture contributes nearly 45 per cent to the net state domestic
product. It is the main source of income as well as employment in Capital Shimla
Himachal. About 93 per cent of the state population depends directly Geographical area (sq km) 55,673
upon agriculture. Administrative districts (No) 12
Population density (persons per sq km) 123
Total population (million) 6.86
Male population (million) 3.48
Female population (million) 3.38
Sex ratio (females per 1,000 males) 971
Literacy rate (%) 82.8
Source: Government of Himachal Pradesh website, Economic Survey of Himachal Pradesh
5 HIMACHAL PRADESH For updated information, please visit www.ibef.org
ADVANTAGE
High economic growth and stable political environment Rich labour pool and infrastructure support
GSDP (in Rs) grew at a Compounded Annual Growth Rate The state has a large base of skilled labour, making it a
(CAGR) of 11.02 per cent between 2011-12 and 2017-18. favourable destination for knowledge-based sectors. It
With a stable political environment and a single-party also has a large pool of semi-skilled and unskilled labour.
government, the state Government is committed towards According to the 2011 census, the overall literacy rate of
creating a progressive business environment. the state was around 82.8 per cent
Himachal Pradesh has a strong hydropower base, with a
potential capacity of 27,436 MW.
Advantage
Himachal
Pradesh
Pharmaceuticals and food processing hub Policy and incentives
Himachal Pradesh has attracted investments in the The state offers a wide range of policy and fiscal
pharmaceuticals, IT and engineering industries. incentives for businesses under the Industrial Policy,
2017.
Agriculture plays a significant role in the state’s economy.
Himachal Pradesh has a robust food processing sector. Himachal Pradesh has well drafted sector specific policies
for biotechnology and pharmaceuticals, solar power and
startups.
Note: GSDP: Gross State Domestic Product
Source: Himachal Pradesh Economic Survey 2017-18
6 HIMACHAL PRADESH For updated information, please visit www.ibef.orgHIMACHAL PRADESH IN FIGURES
Himachal Pradesh’s Contribution to Indian Economy (2017-18) Physical Infrastructure in Himachal Pradesh
Parameter Himachal Pradesh India Parameter Himachal Pradesh India
GSDP as a percentage of
0.81 100.0 Installed power capacity
all states’ GSDP 4,046.81 344,718.61
(MW)
GSDP growth rate* (%) 8.08 10
Per capita GSDP (US$) 2,898.02 1,977.60 Wireless subscribers (Mn) 10.26 1,157.04
Social Indicators Internet subscribers (Mn) 4.32 512.26
Parameter Himachal Pradesh India
National highway length
Literacy rate (%) 82.8 73.0 2,642 122,432
(km)
Birth rate (per 1,000
16.0 20.4 Airports (No) 3 125
population) (2017)
Industrial Infrastructure Investments (US$ billion)
Parameter Himachal Pradesh India Parameter Himachal Pradesh** India
Operational PPP projects
41 720 Cumulative FDI equity
(No)
inflows between April 2000 – 1.47 389.72
June 2018
Note: *in Rs terms, GSDP, per capita GSDP figures are taken at current prices, Exchange Rate used is average of 2017-18, i.e. USD = 64.45, ** - Including Chandigarh, Punjab and
Haryana, For sources refer to annexure
7 HIMACHAL PRADESH For updated information, please visit www.ibef.orgHIMACHAL PRADESH ECONOMIC SNAPSHOT
ECONOMIC SNAPSHOT – GSDP
GSDP of Himachal Pradesh at current prices Per Capita GSDP of Himachal Pradesh at current prices
25 CAGR (in Rs) 11.02% 1.6 3,500 210000
CAGR (in Rs) 10.01%
1.4
20 3,000 180000
1,86,777.57
1.36
21.13
1.2
1,74,564.91
2,898.02
1.26
18.78
2,500 150000
1,59,842.47
1.14
17.45
2,601.95
1
16.97
15 1.04
1,46,488.32
2,441.83
2,395.56
15.66
15.21
15.17
0.95
1,34,934.02
2,230.31
0.8 2,000 120000
2,197.62
2,184.75
0.83
1,18,959.75
10
0.73
0.6
1,05,375.80
1,500 90000
0.4
5 1,000 60000
0.2
0 0 500 30000
2011-12
2012-13
2013-14
2014-15
2015-16
2016-17
2017-18
0 0
2011-12
2012-13
2013-14
2014-15
2015-16
2016-17
2017-18
US$ billion Rs trillion
At current prices, the Gross State Domestic Product of US$ Rs
Himachal Pradesh reached Rs 1.36 trillion (US$ 21.13 billion) in
The state’s per capita GSDP in 2017-18 was Rs 186,777.57
2017-18.
(US$ 2,898.02). .
The state’s GSDP (in Rs) increased at a Compound Annual
The per capita GSDP (in Rs) increased a CAGR of 10.01 per
Growth Rate of 11.02 per cent between 2011-12 and 2017-18.
cent between 2011-12 and 2017-18.
Note: exchange rates used are averages of each year, given on slide 45
Source: Directorate of Economics & Statistics of Himachal Pradesh, MOSPI
9 HIMACHAL PRADESH For updated information, please visit www.ibef.orgECONOMIC SNAPSHOT – NSDP
NSDP of Himachal Pradesh at current prices Per Capita NSDP of Himachal Pradesh at current prices
20 CAGR (in Rs) 11.64% 1.4 3,000 180000
CAGR (in Rs) 10.62%
18
1.2
18.18
2,500 150000
1,60,719.43
16
1.17
1,50,285.33
2,493.71
16.17
1
1.08
14
1,35,512.13
2,240.06
14.80
14.28 2,000 120000
0.97
2,070.15
1,23,299.43
2,016.34
12
13.24
12.75
0.8
12.62
1,14,094.75
0.87
1,885.86
1,831.60
1,829.43
0.80
10 1,500 90000
99,730.35
0.69
0.6
87,721.00
8
0.61
6 1,000 60000
0.4
4
0.2 500 30000
2
0 0 0 0
2014-15
2011-12
2012-13
2013-14
2014-15
2015-16
2016-17
2017-18
2011-12
2012-13
2013-14
2015-16
2016-17
2017-18
US$ billion Rs trillion US$ Rs
At current prices, the total Net State Domestic Product of
The state’s per capita NSDP in 2017-18 was Rs 160,719.43
Himachal Pradesh reached Rs 1.17 trillion (US$ 18.18 billion) in
(US$ 2,493.71). .
2017-18
The per capita NSDP (in Rs) increased a CAGR of 10.62 per
The state’s NSDP (in Rs) increased at a compound annual
cent between 2011-12 and 2017-18.
growth rate of 11.64 per cent between 2011-12 and 2017-18.
Note: exchange rates used are averages of each year, given on slide 45
Source: Directorate of Economics & Statistics of Himachal Pradesh, MOSPI
10 HIMACHAL PRADESH For updated information, please visit www.ibef.orgECONOMIC SNAPSHOT – PERCENTAGE
DISTRIBUTION OF GSDP
During 2017-18, the tertiary sector accounted for 43.05 per cent Visakhapatnam
GSVA composition
port trafficby
(million
sectortonnes)
share in the over GSVA of the state, followed by secondary sector
and primary sector with contributions of 41.99 per cent and 14.95 per 100%
39.03% CAGR 43.05%
cent, respectively.
90%
The tertiary sector witnessed the fastest growth at a CAGR of 12.43 80%
12.43%
per cent between 2011-12 and 2017-18.
70%
Secondary sector in the state expanded at a CAGR of 9.82 per cent
60%
between 2011-12 and 2017-18. Primary sector grew at a CAGR of 43.81%
41.99%
8.09 per cent during the same time. 50%
9.82%
40%
30%
20%
17.16%
10% 8.09% 14.95%
0%
2011-12 2017-18
Primary Sector Secondary Sector Tertiary Sector
Source: Directorate of Economics and Statistics of Himachal Pradesh
11 HIMACHAL PRADESH For updated information, please visit www.ibef.orgECONOMIC SNAPSHOT – FDI INFLOWS &
INVESTMENTS
FDI Inflows in Himachal Pradesh^ Proposed Investments
April 2000-June 2018 (US$ million)
Proposed
1,600 Year IEMs filed investments
108 1472 (in US$ million)
1,400 39 27 6
91 2016 9 147.5
47
1,200 130
2017 6 17.6
1024
1,000 2018** 7 49.73
800
According to the Department of Industrial Policy & Promotion
600 (DIPP), during April 2000 to June 2018, FDI inflows in the state^
totalled to US$ 1.47 billion.
400
FY12
FY13
FY14
FY15
FY16
FY17
FY18
FY00-FY19*
FY00-FY11
FY19*
During 2018**, seven investment intentions were filed in Himachal
Pradesh with a proposed investment of Rs 349 crore (US$ 49.73
million).
Annual FDI Inflow
Note: * - Upto June 2018, ** - Upto August 2018, ^ - including Chandigarh, Punjab and Haryana
Source: Department of Industrial Policy & Promotion
12 HIMACHAL PRADESH For updated information, please visit www.ibef.orgECONOMIC SNAPSHOT – EXPORT TRENDS
Merchandise Exports from Himachal Pradesh (US$ million) Major Commodities Exported in FY18
1400.00 Drug, Formulations &
1,221.66 Biologicals
1200.00 Cotton yarn
1,056.01
19%
1000.00 896.23 893.14 Man Made Yarn &
Fabrics
800.00 2% Cotton Fabrics
3%
3%
600.00 Bulk Drugs
465.24 4% 57%
5%
400.00 Paper & Paper Board
7%
200.00 Cosmetics & Toiletries
0.00 Others
FY15 FY16 FY17 FY18 FY19*
Total merchandise exports from Himachal Pradesh were US$ 1,221.66 million in FY18. In FY19*, merchandise exports from the state stood at
US$ 465.24 million.
Drug, Formulations and Biologicals account for a majority of the share in the overall exports of the state and reached US$ 702.87 million in FY18.
Cotton Yarn and Man Made Yarn & Fabrics products are the other major products that account for a significant share in Himachal Pradesh’s
export basket.
Note: * - Upto July 2018
Source: DGCIS Analytics
13 HIMACHAL PRADESH For updated information, please visit www.ibef.orgHIMACHAL PRADESH PHYSICAL INFRASTRUCTURE
PHYSICAL INFRASTRUCTURE – ROADS
Since much of the state is hilly, roads play a vital role in
transportation.
Starting from scratch, around 37,158 kilometres of motorable roads
have been constructed by the state government till December 2017.
The state had 2,642 km of national highways as of February 2018.
As per Budget 2018-19, the state government has also launched the
Himachal Road Improvement Scheme for cross drainage.
As of December 2017, 10,241 villages in the state were connected
by roads.
Source: Maps of India
Pradhan Mantri Gram Sadak Yojana (PMGSY) in 2018-19
Target Habitations 150
Target Length (km) 2,400
Habitations Connected (up to May
2
2018)
Source: Himachal Pradesh Economic Survey, 2017-18; State Budget 2018-19, update is expected in the next financial year budget
15 HIMACHAL PRADESH For updated information, please visit www.ibef.orgPHYSICAL INFRASTRUCTURE – RAILWAYS
Himachal Pradesh falls under the Northern Railways network.
The state has three railway lines (two narrow and one broad gauge).
The two narrow gauge lines are of 113 km and 96 km, which
connect Jogindernagar with Pathankot and Shimla with Kalka,
respectively. The broad gauge line is 33 km long, which connects
Nangal dam and Charuru in Una district. As of March 2017, the state
had 296 km of railway network.
A provision of Rs 422 crore (US$ 65.18 million) has been made in
2018-19 for expansion of the railway network in the state.
The Baddi-Bilaspur rail line is under construction, as of 2017.
As of October 2018, the state has been proposed to get India’s first
railway station inside the tunnel at a height of 3,000 metres on the
Bilaspur-Manali-Leh line close to the India-China border.
Source: Himachal Pradesh Economic Survey, 2017-18; State Budget 2018-19
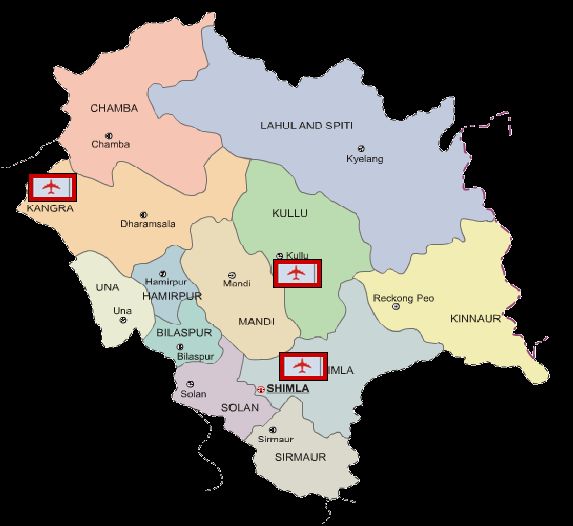
16 HIMACHAL PRADESH For updated information, please visit www.ibef.orgPHYSICAL INFRASTRUCTURE – AIRPORTS
There are 3 airports in Himachal Pradesh – at Kullu (Bhuntar),
Kangra (Gaggal) & Shimla (Jubbar Hatti).
The state government has identified 3 sites at Kandaghat in the
Solan district & Nadaun in the Hamirpur district to establish an
international airport in the state.
The state government has taken an initiative to introduce heli-taxi
services, which are expected to improve connectivity and open up
remote areas for tourists.
In 2017-18, the Guggal airport of Kangra recorded 2,466 aircraft
movements and passenger traffic of 139,231 people. Passenger
traffic and aircraft movement at Guggal airport of Kangra stood at
56,529 and 1,112, respectively, during Apr-Aug 2018.
Airport indicators for Guggal Airport, Kangra
Parameter 2015-16 2016-17 2017-18 Apr-Aug 2018
Aircraft movement (nos.) 1,258 1,841 2,466 1,112
Passenger traffic (nos.) 78,544 108,245 139,231 56,529
Source: Himachal Pradesh Economic Survey, 2017-18, AAI
17 HIMACHAL PRADESH For updated information, please visit www.ibef.orgPHYSICAL INFRASTRUCTURE – POWER
Installed power capacity (MW) Assessed hydro power potential (MW)
5,000 14,000
4,500 13,332
12,000
4,578.56
4,463.00
4,000
4,046.81
4,038.68
3,986.00
3,892.72
3,500 10,000
3,770.10
3,584.90
3,000
8,000
2,500
2,000 6,000
2,326.70
5,995
1,500
4,000
1,000 4,032
2,000 3,237
500 840
0 -
FY11 FY12 FY13 FY14 FY15 FY16 FY17 FY18 FY19* Yamuna Satluj Beas Ravi Chenab
Himachal Pradesh is naturally suited for hydropower generation and accounts for around 25.9 per cent of India’s total hydro power potential. Out
of the 27,436 MW hydro power potential, 24,000 MW is harnessable. As per state budget 2018-19, 20,912 MW of this is already allocated under
various sectors and 182 MW of hydro power capacity addition is expected in 2018-19.
Himachal Pradesh is one of the few states in India where power delivered to consumers is entirely metered.
As of September 2018, Himachal Pradesh had a total installed power generation capacity of 4,046.81 MW. Hydro power accounted for 2,910.48
MW of total installed power generation capacity, followed by renewable power (861.97 MW) and thermal power (245.41 MW). Under thermal
power, coal accounted for 183.40 MW and gas accounted for 62.01 MW of total installed power.
Note: * - up to September 2018
Source: Central Electricity Authority, Himachal Pradesh Economic Survey 2017-18, State Budget 2018-19.
18 HIMACHAL PRADESH For updated information, please visit www.ibef.orgPHYSICAL INFRASTRUCTURE – TELECOM
Telecom infrastructure (as of July 2018) Performance of Bharat Net (As of October 2018)
Wireless subscribers 10,257,680
Service Ready GPs 208
Wire-line subscribers 122,036
Tele-density (%) 143.60
GPs for which Cable laid ** 223
Internet subscribers* (million) 4.32
At 143.60 per cent, the state has the second highest tele density in India after Delhi.
According to the Telecom Regulatory Authority of India (TRAI), Himachal Pradesh had 10.26 million wireless subscribers and 122,036 wire-line
subscribers as of July 2018.
By the end of July 2018, 1.88 million subscribers had submitted requests for mobile number portability in Himachal Pradesh.
The major telecom operators in Himachal Pradesh are: Bharat Sanchar Nigam Limited (BSNL), Bharti Airtel, Vodafone and IDEA Cellular Services
Note: * - As of June 2018; GP-Gram Panchayat, ** - As of July 2018
Source: Telecom Regulatory Authority of India; Department of Telecommunications- Ministry of Communications & Information Technology
19 HIMACHAL PRADESH For updated information, please visit www.ibef.orgPHYSICAL INFRASTRUCTURE – URBAN
Under State Budget 2018-19, Rs 487 crore (US$ 75.22 million) has Cities under Smart
Population Area (sq km)
Cities Mission
been allocated for Urban Development department.
Dharamsala 22,580 29.51
In May 2017, the state government signed an MoU with Skyway Shimla 269,578 35.34
Technologies, a Belarus based company, for constructing the world’s
1st suspended ‘skyway’ transportation system in Dharamsala. The
project is expected to be completed in the next three years.
In Himachal Pradesh, Dharamsala and Shimla have been selected to
be developed as smart cities under the smart city scheme of the
central Government. Under the smart city scheme, 24 hours
persistent water and power supply would be provided to the city.
Under the AMRUT (Atal Mission for Rejuvenation and Urban
Transformation) Mission, Shimla has been selected. Up to April
2018, Rs 304.52 crore (US$ 47.25 million) has been allocated to the
state under the mission.
As of July 2018, 12 projects were being implemented under the
Smart Cities mission, while Rs 216 crore (US$ 32.22 million) has
been released to the state government under the mission.
Source: JNNURM, Ministry of Urban Development, Rajyasabha, State Budget 2018-19
20 HIMACHAL PRADESH For updated information, please visit www.ibef.orgHIMACHAL PRADESH SOCIAL INFRASTRUCTURE
SOCIAL INFRASTRUCTURE – EDUCATION
Institutes Student Intake (2017-18) No of educational institutions (functional) December 2017
Primary 10,751
Degree level 4,070
Middle 2,103
B-Pharmacy 858
High schools 922
Diploma level 7,837
Senior secondary schools 1,836
Government, Private ITIs 47,784 Degree colleges 137
Sarva Shiksha Abhiyan, a programme that ensures each and every child receives elementary education, is being implemented in the state on a
priority basis.
Himachal Pradesh is placing special emphasis on girl education, with the implementation of National Programme for Education of Girls at
Elementary Level in 8 educationally backward blocks, where rural literacy rates were below the national average. The state government is also
providing girls free education up to university level, which includes vocational and professional courses.
As per state’s economic survey 2017-18, there are 10,751 primary schools, 2,103 middle schools, 922 high schools and 137 degree colleges
functioning in the state.
The “Swayamsidham Project”, that aims to provide teachers with online solutions for their problems and deliver academic support to school heads
through the web portal, is being executed in around 2,153 schools of Himachal Pradesh.
Source: Himachal Pradesh Economic Survey 2017-18, State Budget 2018-19, update is expected in the Budget 2019-20
22 HIMACHAL PRADESH For updated information, please visit www.ibef.orgSOCIAL INFRASTRUCTURE – HEALTH
No of institutions Total facilities (As of October 2018) Health indicators (SRS bulletin, September 2017)
1
Sub centres 2,158 Birth rate 16.0
1
Community Health Death rate 6.8
79
Centres
2
Infant mortality rate 25.0
Primary Health Centres 540
Sub District Hospital 76
District Hospital 15
Total Institutions 2,868
A provision of Rs 2,181 crore (US$ 336.89 million) has been made for health and family welfare under state budget 2018-19. Rs 263 crore (US$
40.62 million) was allocated for Ayurveda.
As of October 2018, the state has 2,158 sub centres, 540 primary health centres, 79 community health centres, 76 sub district hospitals and 15
district hospitals.
As per state budget 2018-19, In 2017-18, the state government introduced a new scheme- “Mukhayamantri Shaya Rog Nivaran Scheme”, which
aims to eradicate Tuberculosis from the state by 2021.
In June 2017, the central government has given a nod to Post Graduate Institute of Medical of Education & Research (PGIMER) for setting up a
PGI satellite centre at Baddi, Himachal Pradesh.
Source: State Budget 2018-19, Ministry of Health & Family Welfare; Sample Registration System (SRS) Bulletin 2014, 1Per thousand persons, 2Per thousand live births
23 HIMACHAL PRADESH For updated information, please visit www.ibef.orgHIMACHAL PRADESH INDUSTRIAL INFRASTRUCTURE
INDUSTRIAL INFRASTRUCTURE … (1/2)
As of December 2017, the state recorded 45,597 working units, of which, the large industrial units were recorded to be 138 whereas the medium
scale units were 484.
For development of industrial infrastructure, the state government has planned the following under the state budget 2018-19:
• No electricity duty on new small and medium industries for first five years
• New e-stamping system to be launched
• All tenders above Rs 500,000 (US$ 7,723) will be carried out on e-Procurement portal
• Lease on industrial plots increased from to be given for 90 years, up from 30 years at present
• Industrial area Kandrori and Pandoga to be completed on priority
Infrastructure Description
Set up at Baddi, Barotiwala, Parwanoo, Kala Amb, Paonta Sahib, Mehatpur, Tahliwal, Amb, Sansarpur Terrace,
Industrial areas
Golthai, etc.
Baddi Barotiwala Nalagarh The industrial area has been promoted by the Ministry of Commerce and Industries, Government of India. It has
Industrial Area emerged as a hub for textiles, pharmaceuticals and packaging industries.
Biotechnology Park The government has proposed to set up a biotechnology park at Nalagarh.
A nanotechnology park is proposed to come up on a 400-acre area near the Biotechnology Park at Aduwal near
Nanotechnology Park
Nalagarh.
An ICD is being developed at Baddi for the benefit of exporting industries through the Container Corporation of
Inland Container Depot (ICD) India. A Memorandum of Understanding (MoU) has been signed between the Himachal Pradesh government and
Container Corporation of India.
25 HIMACHAL PRADESH For updated information, please visit www.ibef.orgINDUSTRIAL INFRASTRUCTURE … (2/2)
In an effort to provide infrastructure support to entrepreneurs, the Himachal Pradesh government has developed 41 industrial areas and 15
industrial estates.
Name and location Primary industry Description
Located in the Solan district, the Baddi industrial area has several
Baddi Pharmaceuticals/textiles
pharmaceutical, textile, auto ancillary, paper and printing units.
Barotiwala Multi-industry Located in the Solan district; hub for small scale industries.
Located in the Solan district; the city is an industrial cluster for high-
Parwanoo Light engineering
density polyethylene (HDPE) pipe companies.
Located on the Shimla-Kalka highway in the Solan district, the industrial
Chambaghat Electronics area has prominent companies such as Himachal Futuristic
Communications Limited and Shivalik Bimetal Controls Limited.
Located in the Sirmour district, the industrial area has a number of
Paonta Sahib Pharmaceuticals/chemicals
pharmaceutical and chemical companies.
Located in the Una district, it has prominent telecommunications
Tahliwal and Gagret Electronics
companies.
Amb has prominent engineering and automotive companies such as
Amb Industrial Area Engineering/auto
International Cars and Motors Limited.
Located in the Kangra district, it has some of the leading engineering
Sansarpur Terrace Engineering
companies of North India.
Located in the Bilaspur district, it has been identified as a mini growth
Golthai Multi-industry
centre.
26 HIMACHAL PRADESH For updated information, please visit www.ibef.orgHIMACHAL PRADESH KEY SECTORS Agriculture and Allied Industries Pharmaceuticals Tourism
KEY SECTOR – AGRICULTURAL AND ALLIED
INDUSTRIES… (1/3)
Horticulute Production (‘000 metric tonnes) Production of commercial crops (in ‘000 tonnes)
1,800
2,750
1,600
2,700
1,654
1,650
1,609
2,709 1,400
1,540
2,650
1,200
2,600
1,000
2,550
2,563 800
2,500
600
2,450 400
2,400 2,452
2,423 200 32 35 33 35
2,404 183 196 200 195
2,350 -
2,300 2015-16 2016-17 2017-18* 2018-19*
2,250
FY14 FY15 FY16 FY17 FY18** Potato Vegetables Ginger
Agriculture is a key livelihood for the people of Himachal Pradesh and holds a significant share in the state’s economy. Major food crops in the
state are rice, maize, wheat, barley, jowar, pulses, bajra and potato. The four agro-climatic conditions in the state support cultivation of multiple
crops, vegetables and fruits around the year. The state government is focusing on increasing productivity levels besides diversification towards
high-value crops.
The yield for food grains is estimated at 2.09 metric tonnes in 2017-18. Horticulture production in 2017-18 is estimated at 2,423 thousand metric
tonnes, as per 1st advance estimates.
The contribution of major livestock products during the year 2016-17 was 1.32 million MT of milk, 1,476 MT of wool, 95.8 million eggs and 4,460
MT of meat.
Note: *target, MT – Metric tonnes, **1st advance estimates
Source: Himachal Pradesh Economic Survey 2017-18, Department of Agriculture Cooperation and Farmers Welfare, Ministry of Food Processing Industries
28 HIMACHAL PRADESH For updated information, please visit www.ibef.orgKEY SECTOR – AGRICULTURAL AND ALLIED
INDUSTRIES… (2/3)
With suitable agro-climatic conditions, Himachal Pradesh has Food Processing Clusters in Himachal Pradesh
realised the importance of commercial crops, including off-season
Category Districts
vegetables, potatoes and ginger. The state is one of the largest
Dairy products and Shimla, Mandi, Bilaspur, Kullu, Kangra,
producers of off season vegetables and exotic fruits and the second
analogues Solan, Hamirpur, Una, Sirmaur
largest producer of apples and almonds in the country.
Spices Mandi, Bilaspur, Shimla
The food processing industry primarily focuses on the areas of
Prepared Foods Kangra, Mandi, Hamirpur
traditional processing of agricultural and horticultural raw materials.
Cereals and cereal Solan, Hamirpur, Kangra, Kullu, Kangra
Agri-procurement has lately been an investment area for corporate products
entities.
Ready to eat Hamirpur, Solan, Kangra
Presence of good food processing infrastructure has attracted major
Pickle, Jam Squash Solan, Kangra, Una
companies to invest in the state. There are 12 cold chains and one
dedicated food park in Himachal Pradesh.
Source: Ministry of Food Processing Industries
29 HIMACHAL PRADESH For updated information, please visit www.ibef.orgKEY SECTOR – AGRICULTURAL AND ALLIED
INDUSTRIES… (3/3)
Key players
Cremica Group is a prominent player in food retail and food services industries in India. The company’s business
activities include Cremica Frozen Foods, EBI Foods, Mrs Bector’s Desserts and Cremica Agro India. The
company is commissioning a plant at Tahliwal Industrial Area, Una, for manufacturing biscuits and Indian snack
foods. It is a 100 per cent automated facility, with an annual manufacturing capacity of 150,000 MT.
Cremica Group
Adani Agrifresh, a 100 per cent subsidiary of Adani Enterprises, has set up three controlled-atmosphere storage
units at Rampur, Sainj and Rohru in Himachal Pradesh, with an investment of US$ 40 million and a combined
capacity of 18,000 metric tonnes of apples per year. The subsidiary is involved in the procurement, storage and
transportation of fresh fruits and vegetables. The company directly buys fruits from about 4,000 farmers.
Adani Agrifresh Ltd
Nestlé has been operating in India for almost a century, with seven production facilities across the country. The
company produces chocolates and confectionaries, prepared dishes and cooking aids, beverages and milk
products and nutrition.
Nestle India The company has a factory in Tahliwal, Una, Himachal Pradesh.
Dabur is one of the country’s largest consumer goods companies.
The company produces several products, including honey and amla, in Baddi.
Dabur India Ltd
Source: Company Websites & Annual Reports
30 HIMACHAL PRADESH For updated information, please visit www.ibef.orgKEY INDUSTRIES – PHARMACEUTICALS … (1/2)
Himachal Pradesh is one of the fastest-growing regions in the Exports of drug formulations and biologicals
pharmaceutical industry in India, driven by incentives announced by
800
the state Government in its Industrial Policy, 2004. Baddi is one of 702.87
700
the largest pharmaceutical hubs in Asia and the world.
600
500 450.12
The Department of Environment, Science & Technology (DEST), 409.79
400 352.78
Government of Himachal Pradesh, proposes to develop a
300 268.1
Biotechnology Park (BTP) spread over an area of 35 acres at
200
Aduwal in Solan under PPP mode in the state
100
The Ayurvedic Department has three ayurvedic pharmacies at - 0
2014-15 2015-16 2016-17 2017-18 2018-19*
Jogindernagar District Mandi, Majra District Sirmaur & Paprola
District Kangra. The 4 herbal gardens of the state are located at -
Some of the key players
Jogindernagar (Mandi), Jungle Jhalera (Bilaspur), Neri (Hamirpur) &
Ranbaxy Laboratories Ltd
Dumreda (Shimla).
Cipla Ltd
During 2017-18, exports of drug formulations and biologicals from Dr Reddy's Laboratories Ltd
the state stood US$ 702.87 million. During 2018-19*, the exports
Panacea Biotec Ltd
stood at US$ 268.10 million
Note: * - Upto July 2018
Source: Himachal Pradesh Economic Survey 2015-16
31 HIMACHAL PRADESH For updated information, please visit www.ibef.orgKEY INDUSTRIES – PHARMACEUTICALS … (2/2)
Key players
Ranbaxy is one of the leading pharmaceutical companies in India, with business operations in 43 countries and
manufacturing facilities in eight countries.. In 2008, Japanese conglomerate Daiichi Sankyo became the largest
shareholder in Ranbaxy, which is now its global generic arm. In March 2015, Sun Pharma acquired Ranbaxy
Laboratories.
Ranbaxy Laboratories It has a manufacturing facility at Paonta Sahib, Sirmaur
Ltd (Sun Pharma)
Cipla has one of the largest product portfolios, with over 1,000 products.
It established a manufacturing facility in Baddi in 2005. The unit manufactures bulk drugs, tablets and capsules,
creams, aerosols/inhalation devices and injections/sterile solutions.
Cipla Ltd
Established in 1984, Dr Reddy’s ranks among the top 15 generics players in the world.
Dr Reddy’s has a finished dosage facility in Baddi.
Dr Reddy's
Laboratories Ltd (DRL)
Panacea is one of India’s prominent pharmaceutical and biotech companies involved in research, manufacturing
and marketing of pharmaceutical formulations. The company has around 2,700 employees, including 130
scientists.
Panacea’s pharmaceutical and vaccine formulations facility is located in Baddi, with a production capacity of 600
million doses per annum. The production is likely to be increased to one billion doses per annum after the addition
Panacea Biotec Ltd of the third line.
32 HIMACHAL PRADESH For updated information, please visit www.ibef.orgKEY INDUSTRIES – TOURISM
Number of domestic tourists (in million) Number of foreign tourists (in ‘000s)
25.00 600
20.00 500
485 500
471
19.13
400 454 453
17.99
17.12
15.00 401 414 406
390
15.92
15.65
14.71
14.60
300
12.81
10.00
11.04
200
5.00
100
0.00 0
2009 2010 2011 2012 2013 2014 2015 2016 2017 2009 2010 2011 2012 2013 2014 2015 2016 2017
Tourism is one of the most important sectors for the state economy in terms of foreign exchange earnings and creation of employment
opportunities. Himachal Pradesh is endowed with topographic diversity, historical monuments and religious shrines. As of 2017-18, there were
2,907 registered hotels in the state. Top tourist destinations in the state include Kullu, Shimla, Kangra, Solar, Chamba and Spiti.
The tourism sector of Himachal Pradesh contributes to 6.6 per cent in the state GDP. Domestic tourist inflows in the state reached 19.13 million in
2017 while foreign tourist arrivals reached 470,992.
Sustainable Tourism Policy, 2013 was formulated for promoting sustainable tourism without damaging the ecology and environment.
As per Himachal Pradesh Economic Survey 2017-18, the Asian Development Bank is giving loan assistance of US$ 95.16 million to develop
tourism infrastructure in the state.
Source: Ministry of Tourism, Government of India, Himachal Pradesh Economic Survey 2017-18
33 HIMACHAL PRADESH For updated information, please visit www.ibef.orgHIMACHAL PRADESH KEY PROCEDURES & POLICIES
SINGLE-WINDOW CLEARANCE MECHANISM … (1/2)
Single-Window Clearance Mechanism (SWM) was established in SWM structure in Himachal Pradesh
2004. It has a two-tier structure.
• District Single Window Clearance Committee for each district in
the state is chaired by General Manager/Member Secretary, with State-level Single
Chief Minister of
senior-most officers of departments concerned in the district as Window Clearance and
Himachal Pradesh
members. Monitoring Authority
• State-level agency with Chief Minister of Himachal Pradesh as
Chairman and various heads of departments as members.
• Approval for proposals with investments of over US$ 1.09 million,
power requirement of above 1 MW and industries in the negative
list (such as forest-based and mining); as defined by central and
state Governments, are decided by the state-level Single-Window
Clearance Agency.
• In the budget 2015-16, the Government announced its plans to
revamp the State Level Single Window Clearance & Monitoring
Authority. District-level Single
GM-DIC/ Member
Window Clearance
Secretary
• According to the budget speech 2015-16, approval for Agency
establishing industries in the state would be granted within a
period of 45 days from the date of submission of common
application form, which should be complete in all respect and
fulfilling all necessary requirements.
Source: Industries Department, Government of Himachal Pradesh, State Budget 2015-16; GM: General Manager, DIC: District Industrial Centre
35 HIMACHAL PRADESH For updated information, please visit www.ibef.orgSINGLE-WINDOW CLEARANCE MECHANISM … (2/2)
Single-window Clearance and Monitoring Agency: State-level Nodal Agency
Purpose Composition
Provides first approval to medium and large scale investment proposals The Chief Minister of Himachal Pradesh is Chairman of the
between 30–60 days of submission. agency; other members include heads of the departments of
town and country planning, labour, electricity, water, director of
Projects above US$ 1.09 million, power requirements above one MW and
industries and industrial adviser.
industries in the negative list (such as forest-based and mining) as defined
by the central and state governments are approved by the agency.
District Industry Centre (DIC): District-level Committee for Single-window Clearance
Purpose Composition
Provides sanctions and clearances for setting up small scale industrial Convened by the General Manager, DIC or member secretary,
units. Single-window Clearance and Monitoring Agency.
Source: Industries Department, Government of Himachal Pradesh ; MW: Mega-Watt, DIC: District Industrial Centre
36 HIMACHAL PRADESH For updated information, please visit www.ibef.orgKEY INVESTMENT PROMOTION OFFICES
Agency Description
Agency for speedy clearance and in-principle approval to large and medium scale projects.
Single-Window Time frame for approval is 45 days.
Clearance Agency Since inception in 2004, 104 meetings have been held, and 1,023 projects, with an investment of US$ 11.77
billion, have been approved up to December 2014.
Himachal Pradesh State Supply of raw materials through appropriate depots.
Small Industries and Export Supply of machinery on hire-purchase.
Corporation Provision of assistance in export and marketing.
To provide medium and long-term loans as well as working capital loans to small and medium scale units under
Himachal Pradesh
various schemes.
Financial Corporation
To provide loans for expansion, modernisation and rehabilitation of existing units.
Registration of Small Scale Industries (SSI) and recommendation of medium and large scale industries to the
appropriate authority.
Technical and general consultancy.
Recommendation for financial assistance to financial institutions/banks for margin money and loans.
Directorate of
Industrial infrastructure development.
Industries
Collection and maintenance of data relating to industrial units.
Allotment of industrial plots, sheds and shops in districts.
Liaison with and provide feedback to the central and state Governments.
Administration of all incentives to industries given by the central and state Governments.
Source: Department of Industries, Government of Himachal Pradesh; State Budget 2015-16
37 HIMACHAL PRADESH For updated information, please visit www.ibef.orgCONTACT LIST
Himachal Pradesh State Industrial Development Corporation
Himachal Pradesh Industries Department
Limited
Udyog Bhawan 4th & 5th Floor, New Himrus Building
Shimla Cart Road
Phone: 91-177-2813414 Shimla
E-mail: dirindus-hp@nic.in Phone: 91-177-2624751, 2621426
Website: http://himachal.nic.in/industry/welcomelat.htm Fax: 91-177-2624278
E-mail: hpsidc@sancharnet.in
Website: http://www.hpsidc.nic.in
38 HIMACHAL PRADESH For updated information, please visit www.ibef.orgKEY APPROVALS REQUIRED … (1/2)
Approvals and clearances required Departments to be consulted
Prior to setting up the unit
Registration District Industry Centre for SSI or Large and Medium Industries
Allotment of land/shed State Department of Industries/Infrastructure Corporation
Permission for land use District Authorities, Department of Town and Country Planning
No Objection Certificate under Water and
Himachal Pradesh State Pollution Control Board
Air Act
Approval for construction activity and
Town and Country Planning Authority
building plan
Site environmental approval State Pollution Control Board and Ministry of Environment and Forests
Provisional trade tax registrations Central and State Excise Departments
Registration under Central Sales Tax Act Central and State Excise Departments
Source: Commissionerate of Industries, Government of Himachal Pradesh
39 HIMACHAL PRADESH For updated information, please visit www.ibef.orgKEY APPROVALS REQUIRED … (2/2)
Approvals and clearances required Departments to be consulted
Before commencement of production
No Objection Certificate under Water and
Himachal Pradesh State Pollution Control Board
Air Act
No Objection Certificate Fire Department and Directorate of Factories and Boilers
Permanent trade tax registration Central and State Excise Departments
Registration under Central Sales Tax Act Central and State Excise Departments
After commencement of production/activity
Department of Industries and respective sector departments such as Information
Registration
Technology/Biotechnology, etc.
Source: Commissionerate of Industries, Government of Himachal Pradesh
40 HIMACHAL PRADESH For updated information, please visit www.ibef.orgCOST OF DOING BUSINESS IN HIMACHAL PRADESH
Parameter Cost estimate
Baddi Industrial Area: US$ 15–50
Industrial land (per sq ft)
Other Industrial Areas: US$ 12–35
Office space rent
US 10 cents to US$ 8
(per sq ft per month)
Residential rent
US$ 100–200 per month
(1,600 to 2,500 sq ft house)
Hotel costs (per room, per night) US$ 20–200
Small and medium industries: US 8.3–8.7 cents
Power (per kWh)
Large industries: US 7.5–8.7 cents
Labour (minimum wage per day) US$ 4.5–7
Domestic: US 18 cents
Water (per kl)
Commercial: US 32.6 cents
Source: Directorate of Industries, Ministry of Labour and Employment, Government of India, Himachal Pradesh Irrigation and Public Health Department,
Himachal Pradesh State Electricity Board Ltd, Industry sources
41 HIMACHAL PRADESH For updated information, please visit www.ibef.orgSTATE ACTS & POLICIES
Objectives
To achieve environmentally sustainable and balanced industrial growth leading to more employment opportunities,
Industrial Policy 2013
income generation and overall economic development of the state. Read more
To preserve and protect natural, both flora and fauna, and cultural heritage of Himachal Pradesh, attract tourists
Eco-Tourism Policy 2017 and visitors to the state, provide opportunities to enhance livelihood of local people and generate resources for
sustainable development. Read more
Action plan to harness potential benefits offered by the IT sector.
IT Policy 2009
To use IT for heralding world class e-tourism in the state. Read more
To focus on capacity addition, energy security, access and availability, affordability, efficiency, environment and
Hydro Policy
local employment. Read more
Himachal Pradesh State To ensure the planning, development and management of water resources. The policy directs that the use of water
Water Policy 2013 should be optimised and an awareness of water as a scarce resource should be fostered. Read more
Himachal Pradesh
To help in establishment and regulation of private universities in the state for higher education and to regulate their
Private Universities Act,
functioning and for matters connected therewith or incidental thereto.
2009 Read more
The policy was framed with the objective of increasing the portion of renewable energy in total energy consumption
Himachal Pradesh Solar by the state.
Power Policy, 2016 To provide 24X7 power among remote and rural areas of the state through distributed supply of solar power for
meeting the basic needs of people living in the mountains. Read more
42 HIMACHAL PRADESH For updated information, please visit www.ibef.orgHIMACHAL PRADESH ANNEXURE
ANNEXURE…(1/2) - SOURCES

                          Data                                                          Sources

     GSDP (state)                                              Directorate of Economics & Statistics of Himachal Pradesh

     Per capita GSDP figures                       Directorate of Economics & Statistics of Himachal Pradesh, Central Statistics Office

     GSDP (India)                                                                Central Statistics Office

     Installed power capacity (MW)                                 Central Electricity Authority, As of September 2018

     Wireless subscribers (No)                                   Telecom Regulatory Authority of India, As of July 2018

     Internet subscribers (Mn)                                   Telecom Regulatory Authority of India, As of June 2018

     National highway length (km)                             NHAI, Roads and Building Department-Government of India

     Airports (No)                                                              Airports Authority of India

     Literacy rate (%)                                                                Census 2011

     Birth rate (per 1,000 population)                                       SRS Bulletin September 2017
     Cumulative FDI equity inflows (US$ billion)                      Department of Industrial Policy & Promotion

     Operational PPP projects (No)                                   DEA , Ministry of Finance, Government of India

44      HIMACHAL PRADESH                                                                  For updated information, please visit www.ibef.org
ANNEXURE…(2/2) - EXCHANGE RATES
Exchange Rates (Fiscal Year) Exchange Rates (Calendar Year)
Year INR INR Equivalent of one US$ Year INR Equivalent of one US$
2004–05 44.95 2005 44.11
2005–06 44.28
2006 45.33
2006–07 45.29
2007 41.29
2007–08 40.24
2008–09 45.91 2008 43.42
2009–10 47.42 2009 48.35
2010–11 45.58
2010 45.74
2011–12 47.95
2011 46.67
2012–13 54.45
2013–14 60.50 2012 53.49
2014-15 61.15 2013 58.63
2015-16 65.46 2014 61.03
2016-17 67.09
2015 64.15
2017-18 64.45
2016 67.21
Q1 2018-19 67.04
Q2 2018-19 70.18 2017 65.12
Source: Reserve Bank of India, Average for the year
45 HIMACHAL PRADESH For updated information, please visit www.ibef.orgDISCLAIMER
India Brand Equity Foundation (IBEF) engaged Aranca to prepare this presentation and the same has been prepared by Aranca in consultation with
IBEF.
All rights reserved. All copyright in this presentation and related works is solely and exclusively owned by IBEF. The same may not be reproduced,
wholly or in part in any material form (including photocopying or storing it in any medium by electronic means and whether or not transiently or
incidentally to some other use of this presentation), modified or in any manner communicated to any third party except with the written approval of
IBEF.
This presentation is for information purposes only. While due care has been taken during the compilation of this presentation to ensure that the
information is accurate to the best of Aranca and IBEF’s knowledge and belief, the content is not to be construed in any manner whatsoever as a
substitute for professional advice.
Aranca and IBEF neither recommend nor endorse any specific products or services that may have been mentioned in this presentation and nor do
they assume any liability or responsibility for the outcome of decisions taken as a result of any reliance placed on this presentation.
Neither Aranca nor IBEF shall be liable for any direct or indirect damages that may arise due to any act or omission on the part of the user due to any
reliance placed or guidance taken from any portion of this presentation.
46 HIMACHAL PRADESH For updated information, please visit www.ibef.orgYou can also read