GOA PEARL OF THE ORIENT - FORT AGUADA IN CANDOLIM, GOA - IBEF
←
→
Page content transcription
If your browser does not render page correctly, please read the page content below
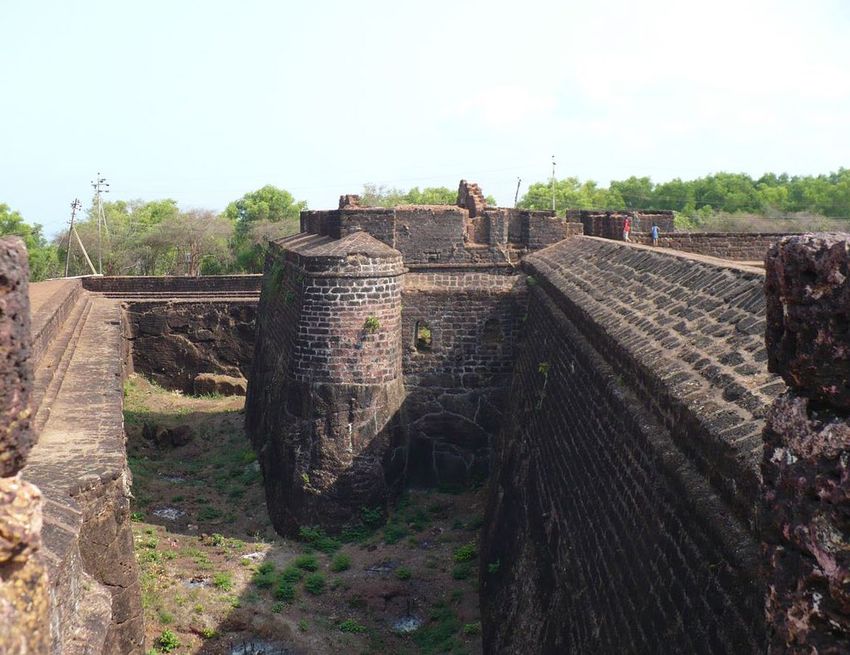
FORT AGUADA IN CANDOLIM, GOA

 GOA
 PEARL OF THE ORIENT

For updated information, please visit www.ibef.org                       June 2020

Table of Contents

 Executive Summary .…………….…….…....3

 Introduction ……..………………………...….4

 Economic Snapshot ……………….….…….9

 Physical Infrastructure ………..……...........15

 Social Infrastructure …..……..……….........23    .

 Industrial Infrastructure ……..……….........26

 Key Sectors ………….………………...…...29

 Key Procedures & Policies………………...34

Annexure.………….……..….......................43

EXECUTIVE SUMMARY
Goa currently has a total of 38 operational mining leases with a reported production of 9.84 million tonnes in
2018-19.
India’s major iron ore
producer Export of iron ore from the state reached US$ 32.19 million in FY20 (till February 2020).
Mormugoa Port (Goa) handled 1.71 million tonnes (MT) of total Iron Ore1 traffic in FY20.
Mormugao Port,
Mormugao port handled 16.01 MT of cargo in FY20.
reflected remarkable
The average output per ship berth day was recorded to be 12,042 MT during the same period.
growth
Goa is one of the fastest growing states in the country. At current prices, Goa’s Gross State Domestic
Strong economic Product (GSDP) was Rs 848.89 billion (US$ 12.15 billion) in 2019-20.
growth The NSDP (in Rs) increased at a compound annual growth rate (CAGR) of 11.97 per cent between 2015-16
and 2018-19.
Goa is a popular tourist destination due to its natural beauty and bountiful avenues for leisure and relaxation.
Tourist paradise During 2019 (till May 2019), Goa witnessed arrivals of 2.71 million domestic tourists and 447,152 foreign
tourists.
Note: 1 – Includes Pellets
Source: Economic Survey of Goa, Indian ports Association, Goa Tourism Department, Directorate of Economics and Statistics Goa
3 GOA For updated information, please visit www.ibef.org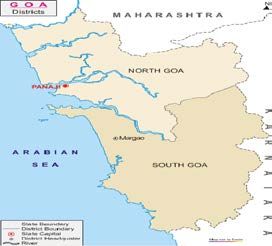
GOA

INTRODUCTION
GOA FACT FILE
Parameters Goa
Capital Panaji
Geographical area (sq km) 3,702
Administrative districts (No) 2
Population density (persons per sq km) 364
Total population (million) 1.46
Male population (million) 0.74
Female population (million) 0.72
Sex ratio (females per 1,000 males) 973
Literacy rate (%) 88.7
Goa is located in the western region of India. The state shares its
border with the Arabian Sea to the west, Maharashtra to the north
and Karnataka to the south and the east.
Languages spoken are Konkani, Marathi, Portuguese, Hindi and
English.
Goa’s administrative headquarters are located at Panaji (the state
capital) and Margao. The state has two districts: North Goa and
South Goa.
Goa has a tropical climate, with a monsoons lasting from June to
September. Due to its long coastline, the weather is hot and humid
for the rest of the year.
Source: Census 2011
5 GOA For updated information, please visit www.ibef.orgADVANTAGE GOA
High Economic Growth Facilitating infrastructure
Goa’s Net State Domestic Product (NSDP) was Goa has a well-developed social, physical and
Rs 706.83 billion (US$ 10.11 billion) in 2018-19. industrial infrastructure, and virtual connectivity.
The NSDP of Goa (in Rs) increased at a It has an international airport that is in line its
compound annual growth rate (CAGR) of 11.97 per ambition to be a globally recognised leisure
cent between 2015-16 and 2018-19. destination. It also has significant port
infrastructure.
Advantage
Goa
Strong presence in Rich labour pool
mining, tourism and pharmaceuticals Goa’s high rate of literacy has attracted
Abundant reserves of iron ore. knowledge-based industries such as
Established base for the pharmaceuticals industry pharmaceuticals, biotechnology and IT.
and an emerging destination for knowledge-based A large proportion of the population can speak
industries such as biotechnology and IT. English, which helps boost the state’s tourism and
High inflow of international tourists driving tourism ITeS industries.
revenue.
Source: Economic Survey of Goa 2017-18, Press Information Bureau, Directorate of Economics and Statistics Goa
6 GOA For updated information, please visit www.ibef.orgGOA IN FIGURES
Goa‘s Contribution to Indian Economy (2018-19) Physical Infrastructure in Goa
Parameter Goa India Parameter Goa India
GSDP as a percentage of all Installed power capacity
0.41 100.0 574.96 370,106.46
states’ GSDP (MW) (March 2020)
GSDP growth rate (in Rs) (%) 1.12 11.3 Wireless subscribers (mn)
93.39 1,156.43
(January 2020)
Per capita GSDP (US$) 7,144.56 2,015.53
Internet subscribers1 (mn)
57.59 687.62
(September 2019)
Social Indicators
National Highway length
293 132,499
Parameter Goa India (km) (March 2019)
Literacy rate (%) 88.7 73.0 Major and minor ports (No) 1+5 13+187
Birth rate (per 1,000 Airports (No) 1 129
12.9 20.4
population)
Industrial Infrastructure Investments (US$ million)
Parameter Goa India Parameter Goa India
Approved Special
Economic Zones (SEZs) 7 416 Cumulative FDI equity inflows in
1,053 469.998
(February 2020) April 2000 – March 2020
Note: PPP: Public Private Partnership, SEZ- Special Economic Zone
Note: GSDP, per capita GSDP figures are taken at current prices, exchange rate used is average of 2017-18 i.e. 64.45, 1Goa and Maharashtra, Refer to annexure for sources,
7 GOA For updated information, please visit www.ibef.orgSTATE VISION
The foundation of high The state plans to preserve its
quality governance should natural beauty at all costs
be fairness, accountability To ensure vibrant future for the
and transparency. habitats of the state.
Goa plans to emerge as the To conserve Goa’s biodiversity,
most well-governed state in Governance Preserve beauty embrace responsible mining,
India. and serenity develop tourism sites.
Vision 2035
Goa’s per capita GDP was
Rs 502,121 (US$ 7,184), one
Value chains to Knowledge centric In spite of its higher literacy
of the highest in India, during
success rate, the state plans to move
2018-19 and the state aims
one step ahead.
to double it in the next 25
years.
To depend on natural
resources and related logistic The state plans to be a
industries, tourism and related knowledge-centric destination in
services, healthcare & pharma the upcoming years.
industry, etc.
Source: Goa Chamber of Commerce and Industry
8 GOA For updated information, please visit www.ibef.orgGOA ECONOMIC SNAPSHOT
ECONOMIC SNAPSHOT – GSDP
GSDP of Goa at Current Prices GSDP Per Capita of Goa at Current Prices
CAGR 11.83% CAGR 11.66%
14 900 8,000 600,000
800 7,000
848.89
12
7,184
500,000
7,145
12.15
771.72
502,121
700 6,000
11.04
6,161
702.67
460,467
10 10.90
600 400,000
645.44
413,330
5,000
5,509
9.62
8 500
360,634
542.75
8.29
4,000 300,000
6 400
3,000
300 200,000
4 2,000
200
100,000
2 1,000
100
0 0 - 0
2015-16
2016-17
2017-18
2018-19
2015-16
2016-17
2017-18
2018-19
2019-20E
US$ Rs
US$ billion Rs billion
At current prices, Goa’s Gross State Domestic Product (GSDP) The state’s per capita GSDP was Rs 502,121 (US$ 7,184), one of
was Rs 848.89 billion (US$ 12.15 billion) in 2019-20. the highest in India, during 2018-19.
The GSDP (in Rs) increased at a Compound Annual Growth Goa’s per capita GSDP (in Rs) increased at a CAGR of 11.66 per
Rate (CAGR) of 11.83 per cent between 2015-16 and 2019-20. cent between 2015-16 and 2018-19.
Note: exchange rates used are averages of each year ‘E' for Quick estimate
Source: Directorate of Economics and Statistics Goa. Economic Survey 2019-20
10 GOA For updated information, please visit www.ibef.orgECONOMIC SNAPSHOT – NSDP
NSDP of Goa at Current Prices NSDP Per Capita of Goa at Current Prices
12 800
CAGR 11.97% 7,000 500,000
700 CAGR 11.06%
10 450,000
6,558
6,523
6,000
706.83
458,304
10.11
10.00
600 400,000
644.20
420,383
5,598
8 5,000 350,000
579.32
8.64
375,550
5,111
500
7.69
334,576
300,000
503.54
4,000
6 400 250,000
3,000 200,000
300
4
2,000 150,000
200
2 100,000
100 1,000
50,000
0 0 0 0
2015-16
2016-17
2017-18
2018-19
2015-16
2016-17
2017-18
2018-19
US$ billion Rs billion US$ Rs
At current prices, Goa’s Net State Domestic Product (NSDP) was The state’s per capita NSDP was Rs 458,304 (US$ 6,558) in
Rs 706.83 billion (US$ 10.11 billion) in 2018-19. 2018-19.
The NSDP (in Rs) increased at a Compound Annual Growth Rate Goa’s per capita NSDP (in Rs) increased at a CAGR of 11.06 per
(CAGR) of 11.97 per cent between 2015-16 and 2018-19. cent between 2015-16 and 2018-19.
Note: exchange rates used are averages of each year
Source: Directorate of Economics and Statistics Goa
11 GOA For updated information, please visit www.ibef.orgECONOMIC SNAPSHOT – PERCENTAGE
DISTRIBUTION OF GSVA
In 2018-19, the secondary sector accounted for 51.35 per cent of Visakhapatnam
GSVA Composition
port trafficby
(million
Sectortonnes)
Gross State Value Added (GSVA) at current prices, followed by
tertiary sector at 37.99 per cent and primary sector at 10.66 per cent. CAGR
100%
At 11.54 per cent, tertiary sector had the highest growth among all 31.25% 37.99%
three sectors between 2011-12 and 2018-19, followed by secondary 90%
sector (9.78 per cent).
80% 11.54%
Growth in the tertiary sector was largely been driven by the tourism
industry, which facilitated growth of other related industries such as 70%
47.23%
banking and financial services, real estate, and business services.
60%
51.35%
50% 9.78%
40%
30%
20%
21.52%
10% -1.88%
10.66%
0%
2011-12 2018-19
Primary Sector Secondary Sector Tertiary Sector
Source: Directorate of Economics and Statistics Goa, Economic Survey 2018-19
12 GOA For updated information, please visit www.ibef.orgECONOMIC SNAPSHOT – FDI INFLOW &
INVESTMENTS
According to Department for Promotion of Industry and Internal FDI Inflow
Visakhapatnam
in Goa in April
port2000-March
traffic (million
2020tonnes)
(US$ million)
Trade (DPIIT), Foreign Direct Investment (FDI) inflow in the state
stood at US$ 1,053 million between April 2000 and March 2020. 1,100 70 1053
1,000 43 16
In 2019, 13 Industrial Entrepreneurs Memorandums (IEMs) were 83
900 18
filed in Goa with a proposed investment of Rs 589 crore (US$ 84.28 35
38 9 17
million). 800
724
700
The Goa Investment Promotion & Facilitation Board is targeting
600
investment of Rs 25,000 crore (US$ 7.46 billion) between 2015-20.
500
400
300
200
FY12
FY13
FY14
FY15
FY16
FY17
FY18
FY19
FY20
FY01-11
FY01-20
Investment Intentions in Terms of IEMs Filed
Proposed
Year Number investments
(US$ million)
2017 12 20.48
2018 10 169.70
2019 13 84.28
Source: GOA – IPB, Department for Promotion of Industry and Internal Trade
13 GOA For updated information, please visit www.ibef.orgECONOMIC SNAPSHOT – EXPORT
Merchandise Export from Goa (US$ billion) Principal Commodities Exported in FY19
2.50
Drug Formulations, Biologicals
2% 3%
2.28 3%
2.00 2.10 2.06 Iron Ore
4%
1.50 1.60 1.60 3%
1.54 Marine Products
1.00
Agro Chemicals
0.50 44%
Telecom Instruments
0.00
Other
FY15 FY16 FY17 FY18 FY19 FY20*
Merchandise export from the state reached US$ 2.06 billion in FY19 and US$ 1.54 billion between April-December 2019.
Drug formulations and biologicals are most exported item from the state with a 49 per cent share in export in FY19. Iron ore, marine products and
agro chemicals were the other major export commodities from Goa.
A new export policy for the state is also being prepared in order to promote export of manufactured goods and surplus agriculture produce.
Note: *- December 2019
Source: DGCIS Analytics, Media Sources
14 GOA For updated information, please visit www.ibef.orgGOA PHYSICAL INFRASTRUCTURE
PHYSICAL INFRASTRUCTURE – ROADS
NH-17 runs along India's West Coast & links Goa to Mumbai in the Road type Road length (km)
north & Mangalore to the south. NH-4A running across the state
connects Panaji to Belgaum (Karnataka) in the east. As of March National highways (As of March 2019) 293
2019, Goa had 293 km of national highways.
State highways 232
According to the State Budget 2019-20, under Bharatmala project for
a length of 200 kilometres costing Rs 2,500.00 crore (US$ 357.7 District highways 815
million) and 100.5 kms of state roads added recently to National
Highway network.
As per state’s Economic Survey, following road works completed
during 2019-20:
• Construction of two-lane bridge connecting Kharwada and
Caranzalem village in Panchayat Madkai in Madkai constituency
at a cost of Rs 10.04 crore (US$ 1.44 million).
• Renewal of carpet of MDR 34 from Dongar, Bhati to Gawaliwada,
Vaddem in a length of 5.5 Kms in Sanguem Const. of Sanguem
Taluka at cost of Rs 259.87 lakh (US$ 0.37 million).
Source: Directorate of Transport PWD: Public Works Department, State Budget 2019-20, Economic Survey 2019-20
16 GOA For updated information, please visit www.ibef.orgPHYSICAL INFRASTRUCTURE – RAILWAYS
The total railway route in Goa is comprising of two rail tracks: the
Konkan Railways line that runs from the north to south and the
South-Western Railways line that runs from west to east. These
routes connect the state to other parts of the country. These routes
are around 167 km long, and cross the most important junction of
the state, the Madgaon railway station. Vasco Da Gama is the next
important railway station in the state.
As per the State Transport Authority, Government of Goa has
granted approval for operations of GoaMiles app-based taxi service
in accordance with the Guidelines for App Taxi operators in the
State.
Konkan Railways, which connects Mumbai, Goa and Mangalore,
has considerably boosted tourism. The Mormugao port is connected
through a broad gauge line.
Four railway overbridges are to be built in Goa with financial support
from the Rail Ministry. The Government has pulled off a new double-
decker luxury train service on Konkan Railways route that
commutes tourists from Mumbai to Goa.
Source: Maps of India
Source: Ministry of Railways – Government of India
17 GOA For updated information, please visit www.ibef.orgPHYSICAL INFRASTRUCTURE – AIRPORTS
Goa Airport Passenger Traffic (million) Goa Airport Aircraft Movement
9
70,000
8
8.46
8.36
60,000
7.61
7
57,655
56,946
6.86
6 50,000
50,567
47,801
5 40,000
5.37
39,030
4
30,000
3
20,000
2
1 10,000
0
0
FY16
FY17
FY18
FY19
FY20
FY16
FY17
FY18
FY19
FY20
Goa has one airport at Dabolim, which functions as a domestic as well as an international airport. The state is connected to most Indian cities by
air. A second greenfield international airport is being developed in Mopa, Goa with an annual capacity to handle 30 million passengers by phase
IV. The first phase of the airport is expected to start by September 2020.
In FY20, Goa Airport handled 8.36 million passengers and 57,655 aircraft movements.
The state has good connectivity in terms of international flights, including chartered flights from European countries.
Source: Airports Authority of India
18 GOA For updated information, please visit www.ibef.orgPHYSICAL INFRASTRUCTURE – PORTS
Goa has 255 kms of rivers & canals, providing an economical mode Ports
for goods transport.
Major ports Mormugao
The Mormugao harbour, a multi-purpose general cargo berth Panaji
situated in the port town of Vasco-da-Gama, handles local and
Chapora
international maritime cargo traffic.
Minor ports Betul
The River Navigation Department was established to provide safe, Talpona
dependable and affordable transport facilities on different ferry routes Tiracol
of Goa’s inland waters.
Commodity-wise Traffic Handled at Mormugao Port during
In FY20, the port handled 16.01 million tonnes of traffic. 2019-20
Commodity Quantity (000’ tonnes)
POL (Petroleum, Oil & Lubricants) 658
Other Liquids 165
Iron ore 1,710
Fertilizers (Fin.) 52
Thermal & Steam 1,550
Coking & others 7,901
Container tonnage 417
Container TEUs 32
Other Misc. Cargo 3,566
Total 16.019
Source: Ministry of Shipping, Government of India, Indian Ports Association, Mormugao Port Trust
19 GOA For updated information, please visit www.ibef.orgPHYSICAL INFRASTRUCTURE – POWER
Installed Power Capacity (MW) Classification of installed power capacity in FY20
Visakhapatnam port traffic (million tonnes)
700.00 0.8%
4.5%
600.00
581.17
567.23
500.00
550.19
Thermal
540.56
0.2%
400.00 Nuclear
412.45
300.00 Renewable
200.00 Hydro
100.00
94.5%
0.00
FY16 FY17 FY18 FY19 FY20
The Electricity Department of Goa was created as a Government Department in 1963. The Electricity Department is the only licensee in the state of Goa
for transmission and distribution of Electrical Energy. In FY20, Goa had a total installed power generation capacity of 581.17 MW.
Of the total installed capacity, 528 MW was managed by central utilities, 53.12 MW by private utilities, and 0.05 MW by state utilities. Thermal power
plants accounted for a significant share in the total installed capacity with 549 MW, whereas, nuclear energy and renewable energy contributed 26 MW
and 5.17 MW, respectively.
Under the State Budget 2019-20, Government proposed Rs 133 crore (US$ 19 million) for the erection of 220/33 KV Gas Insulated Sub Station at Tuem
along with 220KV double circuit line from 400/220 KV Colvale S/S to Tuem, and 50 MVA, 220/33 KV power transformer at 220 KV Ponda Sub-Station at a
total cost of Rs 133 crores (US$ 19 million).
The industrial sector is the largest consumer of electricity, followed by the domestic sector. Goa Electricity Department controls power infrastructure in the
state.
Note: MW- megawatt, KV- kilovolt, MVA- mega vollt ampere
Source: Central Electricity Authority
20 GOA For updated information, please visit www.ibef.orgPHYSICAL INFRASTRUCTURE – TELECOM
Goa is among the few states in the country to have 100 per cent Telecom Statistics – January 2020(1)
automatic telephone systems with a good network of telephone Wireless subscribers (mn)
exchanges. 93.39
Wireline subscribers (mn)
Goa has a fibre-optic cable network spread through the state; it 1,377,119
provides high-speed access for a wide range of internet-related Internet subscribers*(as of September
57.59
services. All the gram panchayats in the state of Goa are connected 2019) (mn)
with optical fiber. Tele-density (%)
109.03
By January 2020, Goa had 93.39 million wireless subscribers and
1.37 million wireline subscribers. Tele density stood at 109.03 per
cent.
Some of the major telecom service providers
Bharat Sanchar Nigam Limited (BSNL)
Bharti Airtel
Reliance Jio
Note: 1Denotes Maharashtra including Goa,
Source: Economic Survey of Goa, Telecom Regulatory Authority of India
21 GOA For updated information, please visit www.ibef.orgPHYSICAL INFRASTRUCTURE - URBAN
DEVELOPMENT
Panaji is one of the 65 cities identified under the Jawaharlal Nehru Smart City Proposal: List of projects in Panaji
National Urban Renewal Mission (JNNURM). Two projects costing
around US$ 15.6 million have been sanctioned for Panaji.
Service improvement for urban poor in Mala
Area Based
Fontain; Integrated Urban Water Management;
As of 2018-19, the state had catered water supply demand through Development
Provision of basic services in entire area
seven regional water supply schemes, the Salaulim water supply
scheme is the largest amongst all the reginal water supply scheme
having capacity of 160 million litres per day.
Digital Enabled System for Public Bike Share
Smart
As per State Budget 2019-20, Government will provide 150 litre per Transportation and
System, Air Quality monitoring stations, Smart
capita per day (LPCD) for urban areas. Parking, Smart Component for buses (GPS,
Eco Mobility
automated fare collection etc.), etc
Under Smart City Mission, Goa Intelligent City Management System
for Panaji City, Smart Radios Wireless Network with Mast Towers for Smart Trolley Bins with RFID tags, Biometric
Panaji are close to completion. Environmental Attendance in 12 Zonal Offices, CCTV
Services Surveillance of black spots, etc
Source: JNNURM, Ministry of Urban Development, Public Works Department of Goa, Goa Indicators of Scio-Economic Development 2018
22 GOA For updated information, please visit www.ibef.orgGOA SOCIAL INFRASTRUCTURE
SOCIAL INFRASTRUCTURE – EDUCATION
Higher Educational Statistics 2018-19 School Educational Statistics 2017-18
Universities 3 Primary schools 1,157
Middle schools 64
Colleges 57
Secondary schools 408
Stand Alone Institutions 11
Higher secondary schools 100
Gross Enrolment Ratio 28.0 Primary level and Middle level
1:24
teacher – pupil ratio
Secondary level and Higher
Teacher Pupil Ratio 1:15 1:21
secondary level teacher – pupil ratio
Goa has a number of leading engineering, business management, medical and legal institutes. The Maritime School, under the Captain of Ports
Department, Government of Goa, is among the first of its kind in the country.
Goa College of Pharmacy, set up in 1842, is one of the oldest institutes in India. It offers bachelor’s, master’s & diploma courses in pharmacy. The
institute has 60 seats for bachelor's degree, 60 seats for diploma & 36 seats for master’s degree in various fields of pharmacy.
During 2018-19, the total enrolments in schools were recorded to be 239,834.
As per State Budget 2019-20, Goa Government has allocated Rs 22.40 billion (US$ 320.50 million) to the Education sector.
Source: Educational Statistics at a Glance 2017-18, Government of Goa, AISHE 2018-19
24 GOA For updated information, please visit www.ibef.orgSOCIAL INFRASTRUCTURE – HEALTH
Goa has some very renowned hospitals including Apollo Victor Healthcare Infrastructure (May 2020)
Hospital in Margao, Manipal Hospital in Panaji and Vrundavan
Shalby Hospital in Mapusa. As of April 2020, the number of primary Primary Health Centres 50
health centres and sub centres in Goa were recorded to be 50 and
222, respectively. Sub Centers 222
Community Health Centres 14
The ‘Prime Minister Jan Aarogya Yojana - Ayushman Bharat’ was
launched in the state in September 2018.
District Hospitals 3
Further, the State Government has also made a provision of US$
Sub-District Hospitals 2
2.43 million for buildings, US$ 0.18 million for books & periodicals &
US$ 0.70 million for various equipment for Goa Medical College.
As per Budget 2019-20, State Government has allocated Rs Health indicators (2017)
1,333.39 crore (US$ 190.78 million) to the Health Services sector.
1
Birth rate 13.34
As per the State Budget 2019-20, Government will focus on 1
construction of new premises for CHC Tuem, Health Center at Death rate 8.49
Cansaulim and Health center at Cacora. Construction of 100 bedded 2
Infant mortality rate 11.82
hospital for IPHB has been taken up by end of 2019.
Note: 1Per thousand persons, 2Per thousand live births
Source: Economic Survey of Goa, State Budget 2019-20, NRHM,
25 GOA For updated information, please visit www.ibef.orgGOA INDUSTRIAL INFRASTRUCTURE
INDUSTRIAL INFRASTRUCTURE
Goa Industrial Development Corporation (Goa-IDC) is the nodal agency established for setting up of industrial estates & offering developed plots
to industrial units in the state. As of 2017-18, 1,563 factories were registered in state.
Goa-IDC has established 20 industrial estates, spread across the state’s talukas & is currently working on the expansion of existing industrial
estates as well as establishing new ones.
Seven ITIs (Industrial Training Institutes) in the state of Goa are covered under the World Bank Assisted Vocational Training Improvement Project
(VTIP) while one ITI in the state has been taken up by the central Government for upgradation through public private partnership.
Industry clusters Industries
Verna Rubber, plastics, petroleum products, pharmaceuticals, electronics and telecommunication equipment.
Bicholim Engineering, oil products, plastics, leather, textiles, food processing, soaps and agro products.
Kundaim Rubber, plastics, petroleum products, pharmaceuticals, steel fabrications and aluminum furniture.
Margao Printing, plastics, herbal hair oils, cosmetics, ice blocks, engineering items and industrial diamond tools.
Mormugao Shipbuilding and repair.
Metal works, engineering, cold storage, food processing, electronic products, paper products, chemicals, paints
Corlim
and varnishes.
Vasco Shipbuilding and repair.
Source: Goa Industrial Development Corporation
27 GOA For updated information, please visit www.ibef.orgSEZ AND INDUSTRIAL ESTATES
As of February 2020, Goa had seven formally approved and three Sector-wise formally approved SEZs
notified special economic zones (SEZs). However, there are no
operational SEZs in the state and no in-principle approved SEZ. Number Area
Sector Developer
of SEZs (Hectares)
On completion, the SEZs would primarily cover knowledge-based
industries such as biotechnology and IT/ITeS. The Goa Industrial
IT/ITeS K. Raheja Corp Pvt. Ltd. 1 105.91
Development Corporation (Goa-IDC) assists in establishing
industries in specific industrial areas and estates. Goa-IDC has
established 20 industrial estates in various talukas of Goa. It plans to Peninsula Pharma
Biotechnology 1 20.37
Research Centre Pvt Ltd
expand eight of these existing units and establish another five
industrial estates.
Meditab Specialities Pvt
Pharmaceuticals 1 123.20
The multi-modal logistics park in Balli was made operational by Ltd
October 2018.
Paradigm Logistics and
To accommodate new investments in coastal state, Goa IT/ITeS 1 40.25
Distribution Pvt Ltd
Government has amended a law to open more space in its industrial
estates.
Gems and Planet Mercantile
1 13.28
The Government is committed to make Goa an aspirational Jewellery Company
investment destination for best-in-class manufacturing, tourism,
entertainment and other service industries, including research and
knowledge-based industries. Accordingly, the Government has set Biotechnology Inox Mercantile company 1 48.48
an ambitious target of creating 50,000 jobs by 2019, facilitating new
investments of around US$ 4.2 billion in the state during 2014-19.
Panchbhoomi
IT 1 18.5
Infrastructure
Source: Ministry of Commerce & Industry, Department of Commerce, Goa Industrial Development Corporation, Economic Survey of Goa
28 GOA For updated information, please visit www.ibef.orgGOA KEY SECTORS Mining Tourism and Hospitality Fisheries
KEY SECTORS – MINING… (1/2)
The mining belt of Goa covers an area of approximately 700 sq km & Goa mineral reserves*
is mostly concentrated in the 4 talukas of Bicholim, Salcete,
Sanguem & Quepem. Mineral Reserves (In ‘000 tonnes)
The iron ore in Goa is export oriented with average annual export
from Goa at around 30 million tonnes. Value of minerals produced Iron ore-hematite
(excluding fuel minerals) in Goa in 2018-19 reached US$ 3748.74. 6,42,113
Iron ore exports from the state reached 54.11 million tonnes in
Iron ore-magnetite 2,15,557
2018-19.
Most mines in Goa are of open-cast type, which necessitates the
removal of over burden overlying the iron ore formations. During Manganese 23,271
2015-16, the state Government created a separate District Mineral
Foundation under the MMDR Act, 1957, as per which the state’s
mining firms need to deposit an additional amount of 30 per cent of Bauxite 53,072
the royalty paid to this fund.
Quartz/silica sand 20,004
Note: * - As per latest available data
Source: Ministry of Mines, Government of India
30 GOA For updated information, please visit www.ibef.orgKEY SECTORS – MINING… (2/2)
Formally known as Sesa Goa, is one of the world's largest global diversified natural resource majors, with
operations across zinc-lead-silver, oil & gas, iron ore, copper, aluminium and commercial power.
Vedanta has large iron ore mines in Goa and Karnataka and a pig iron plant in Goa. The mining operations are
Vedanta Limited carried out at the Codli group and the Sonshi group of mines in Goa.
31 GOA For updated information, please visit www.ibef.orgKEY SECTORS – TOURISM AND HOSPITALITY
Innovative marketing strategies to project Goa as an all-time leisure Tourist
Visakhapatnam
Arrivals in
port
Goatraffic
(million)
(million tonnes)
destination have resulted in higher tourist inflows over the years. With
the continuous in-flow of tourists, Russian & European tourists, in
9
collaboration with locals from Arambol to Patnem, have started
offering yoga training classes to people.
8
During 2018, Goa witnessed arrivals of 7081,559 domestic tourists 0.93
0.89
and 933,841 foreign tourists. 7
7.08
For the year 2019-20, the State Government had made an allocation 6.90
of Rs 2,189.22 crore (US$ 34.06 million) to the tourism sector. 6 0.68
5.65
5 0.54
4.76
4 0.49
0.51
3.70
3.54
3
0.49
0.45
2.62
2 2.33
1
0
2012 2013 2014 2015 2016 2017 2018 2019*
Domestic Foreign
Note: *- Till August 2019
Source: Department of Tourism, Government of Goa, Economic Survey of Goa 2019-20
32 GOA For updated information, please visit www.ibef.orgKEY SECTORS– FISHERIES
Goa has a coastline of about 104 kms and inland waterways of about
250 km. The coast is full of creeks and estuaries formed by rivers; In Marine Fish Production in Goa (‘000 tonnes)
September 2018, milkfish harvesting stood at 1.4 tonnes.
140.00
120.00
As per budget 2019-20, Fisheries** has been allotted an annual fund 120.40
100.00 116.09
of Rs 534.73 crore (US$ 76.51 million). 101.10
80.00
Exports of marine products from Goa reached US$ 81.68 million 60.00 72.09
between 2018-19 and US$ 44.27 million during April-December 40.00
2019. 20.00
0.00
2016 2017 2018 2019*
Annual fish catch (‘000 tonnes)
87.9 128.1 105.7
140.0 86.6 120.4 6.0
120.0 86.1 101.1
91.1 88.7 87.0 89.3 5.0
100.0 80.6
5.3 4.0
80.0 4.4 3.0
60.0 3.7 4.1
40.0 3.0 3.2 3.3 4.6 2.0
2.4 3.5 3.8 4.6 1.0
20.0
0.0 0.0
2018*
2007
2008
2009
2010
2011
2012
2013
2014
2015
2016
2017
Marine (LHS) Inland (RHS)
Note: ** Including Agriculture, Animal Husbandry & Veterinary Services, *- Till December 2019
Source: Department of Animal Husbandry, Dairying and Fisheries,, Ministry of Agriculture, Government of India, State Budget 2019-20, Economic Survey 2018-19
33 GOA For updated information, please visit www.ibef.orgGOA KEY PROCEDURES AND POLICIES
KEY INVESTMENT PROMOTION OFFICES
Agency Description
Goa Industrial Development It has been established with the purpose of securing land and assisting in fast and orderly establishment of
Corporation (Goa-IDC) industries in the 20 designated industrial areas and estates.
This is a state Government-promoted financial institution to operate and manage government-promoted
Economic Development financial schemes.
Corporation It acts as an investment company and provides financial assistance to entrepreneurs for starting as well as
expanding business units.
The Goa State Infrastructure This was set up as a Special Purpose Vehicle (SPV), with the basic aim to develop infrastructure in a time-
Development Corporation bound manner.
It promotes traditional arts and crafts, fashioned by the state’s artists and artisans.
Goa Handicrafts Rural and Small It performs functions related to procurement and distribution of indigenous and imported raw material,
Scale Industries Development especially for small scale units.
Corporation It has been instrumental in starting the ‘Deen Dayal Swayamrojgar Yojana’, a scheme to develop self-
employment opportunities for the youth.
It promotes tourism and related activities in Goa.
Goa Tourism Development
Corporation It focuses on developing eco-tourism, heritage tourism, adventure tourism, medical tourism and event
tourism.
It promotes investments in export-oriented projects, especially for the cultivation of exotic fruits and
vegetables, floriculture, etc.
Goa Horticulture Corporation
It is entrusted with the development of horticulture estates and establishment of sales outlets for local
produce through establishments called ‘Krishi Ghars’.
Info Tech Corporation of Goa Ltd It looks after the development of IT-related infrastructure, ITeS and implementation of the government’s
(ITG) e-governance objectives.
35 GOA For updated information, please visit www.ibef.orgCONTACT LIST
Directorate of Industries, Trade and Commerce Goa Chamber of Commerce & Industry
Udyog Bhavan, Narayan Rajaram Bandekar Bhavan, T.B Cunha Road,
Panaji- 403 001 Goa P.O. Box 59, Panaji - 403 001
Phone: 91-832-2226377 Phone: 91-832-2424252
Website: http://www.goaditc.gov.in/ E-mail: goachamber@goachamber.org
Website: http://www.goachamber.org/
36 GOA For updated information, please visit www.ibef.orgKEY APPROVALS REQUIRED
Approvals and clearances required Departments to be consulted Estimated time in days
Incorporation of company Registrar of Companies N.A.
High Powered Coordination Committee (HPCC) for large
Registration, Industrial Entrepreneurs Memorandum (IEM),
and medium-sized projects, Director of Industries, Trade N.A.
Industrial Licences
and Commerce for small and micro projects
Allotment of land Goa-IDC 8 to 15
Permission for land use Goa-IDC 8 to 15
Goa State Pollution Control Board and Ministry of
Site environmental approval 60
Environment and Forests
No objection certificate and consent under Water and
Goa State Pollution Control Board 7 to 14
Pollution Control Acts
Approval of construction activity and building plan Town and Country Planning Authority 30
Sanction of power State Electricity Department Up to 60
Registration under the State Sales Tax Act and Central Sales Tax Department and Central and State Excise
N.A.
and Excise Act Department
N.A. – Not Available
37 GOA For updated information, please visit www.ibef.orgAPPROVAL PROCESS … (1/2)
The Goa Industrial Policy 2003 has revamped the single-window clearance mechanism in the state.
HPCC, chaired by Goa’s Chief Minister, has been appointed responsible for dealing with large projects. Members of the committee include senior-
most officers of concerned state departments.
The Director of Industries, Trade and Commerce handles small scale industries. The Goa-IDC and the District Industries Centre act as nodal
agencies for various projects in the state. Goa-IDC handles the creation of SEZs in the state.
Under the
Investment handled Chairmanship of Nodal agency
Goa Industrial
Greater than US$ Development
HPCC The Chief Minister
1.09 million Corporation
(Goa-IDC)
Department of Director of
Below US$ 1.09 District Industries
Industries, Trade Industries, Trade
million Centre
and Commerce and Commerce
38 GOA For updated information, please visit www.ibef.orgAPPROVAL PROCESS … (2/2)
Goa Investment Policy 2013, which laid a special thrust on development of Special Investment Regions, aims to kick start investment in Goan
economy.
This policy aims to articulate various initiatives being undertaken to make Goa a preferred and aspirational investment destination.
It aims to create an institutional framework for facilitating investments in the thrust areas as well as other areas decided upon by the Investment
Promotion Board (IPB)/Government of Goa on an ongoing basis.
Process for industrial set up in Goa
15 days Rejection Land not available
Evaluation and Detailed
Preliminary Project recommendation by Check on land
templatised
Report submitted to satellite expert availability in
proposal submitted
IPB consultant industrial estates
IPB Land to IPB
approval earmarked
30 days
Rejection
Receipt of all Nodal officer IPB decision on
Evaluation and
clearances for unit to approval who would investment proposal
recommendation by
establish facility and assist with all along with all
Approval approving authorities satellite consultant
start operations approvals
30 days 30 days 30 days
39 GOA For updated information, please visit www.ibef.orgCOST OF DOING BUSINESS IN GOA
Cost parameter Cost estimate
Industrial land (per sq ft) US$ 10–50
Office space rentals (per sq ft per month) US 60 cents to US$ 2
Residential rentals (for a 2,000 sq ft house per month) US$ 800–1,300
Five-star hotel room (per night) US$ 160–800
Power cost (per kWh) Industrial: US 4.7–7.3 cents
Labour cost (minimum wage per day) US$ 3.9–5.5
Source: Industry sources, Goa-IDC, Ministry of Labour and Employment, Government of India, Electricity Department, Government of Goa
40 GOA For updated information, please visit www.ibef.orgSTATE ACTS & POLICIES … (1/2)
The Government has notified the Goa Start-up Policy 2017 with the following objectives:
• Make Goa a hub of high value start-ups.
• Attract entrepreneurial talent to the state and build a robust start-up eco-system in Goa
• Provide assistance to local entrepreneurs and start-ups
• Create at least 100 successful start-ups in the next five years
The Government of Goa has introduced the new Goa Investment Policy 2014 in order to boost investor confidence and attract new industries to Goa.
Main objectives of the new policy include: making Goa an aspirational investment destination by making business a pleasure, for best in class
manufacturing, knowledge-based, tourism, entertainment and other service industries, while improving the environmental and social indicators of the
state.
The state Government is working on the new tourism policy with a vision of overall tourism development and to engage with private players to invest
and develop infrastructure in the state.
41 GOA For updated information, please visit www.ibef.orgSTATE ACTS & POLICIES … (2/2)
Objectives
Goa IT Policy 2018 To make state of Goa a preferred place for investment in high end software products and services .
Read more
Goa State Solar Policy To aid the development of solar power projects in the state and attract new investments for capacity addition over
2017 next seven years
Read more
To ensure accelerated growth in all areas of the biotechnology sector such as education, research and economic
sectors covering healthcare, agriculture, industry, services, environment management and employment generation.
Biotech Policy 2016
Objectives of the policy include prioritisation of the thrust areas for basic and applied research and technology
development, and promotion of innovations in R&D by providing financial and infrastructural support.
Read more
Mining Lease Policy, The state Government can directly auction the leases in order to secure the best returns for the grant of leases by
2014 way of a competitive bidding process. Read more
Goa Investment Policy Creating 50,000 jobs and investing US$ 4.2 billion in new projects in the next five years.
2014 Providing 24x7 high-quality power supply and logistics infrastructure to industries. Read more
42 GOA For updated information, please visit www.ibef.orgGOA ANNEXURE
ANNEXURE…(1/2)- SOURCES

                        Data                                               Sources

                   GSDP (state)                           Directorate of Economics and Statistics, Goa

              Per capita GSDP figures                 MOSPI, Directorate of Economics and Statistics, Goa

                   GSDP (India)                                             MOSPI

           Installed power capacity (MW)                          Central Electricity Authority

             Wireless subscribers (No)                   Telecom Regulatory Authority of India, as of

             Internet subscribers (Mn)                      Telecom Regulatory Authority of India

           National highway length (km)                   Ministry of Road Transport and Highways

                  Number of Ports                                   India Ports Association

                    Airports (No)                                 Airports Authority of India

                  Literacy rate (%)                                      Census 2011

          Birth rate (per 1,000 population)                     SRS Bulletin, September 2017

     Cumulative FDI equity inflows (US$ billion)   Department for Promotion of Industry and Internal Trade

           Operational PPP projects (No)               DEA, Ministry of Finance, Government of India

44    GOA                                                                   For updated information, please visit www.ibef.org
ANNEXURE…(2/2) - EXCHANGE RATES
Exchange Rates (Fiscal Year) Exchange Rates (Calendar Year)
Year INR INR Equivalent of one US$ Year INR Equivalent of one US$
2004–05 44.95 2005 44.11
2005–06 44.28 2006 45.33
2006–07 45.29 2007 41.29
2007–08 40.24 2008 43.42
2008–09 45.91
2009 48.35
2009–10 47.42
2010 45.74
2010–11 45.58
2011 46.67
2011–12 47.95
2012 53.49
2012–13 54.45
2013 58.63
2013–14 60.50
2014 61.03
2014-15 61.15
2015 64.15
2015-16 65.46
2016-17 67.09 2016 67.21
2017-18 64.45 2017 65.12
2018-19 69.89 2018 68.36
2019-20 70.49 2019 69.89
Source: Reserve Bank of India, Average for the year
45 GOA For updated information, please visit www.ibef.orgDISCLAIMER
India Brand Equity Foundation (IBEF) engaged TechSci Research to prepare this presentation and the same has been prepared by TechSci
Research in consultation with IBEF.
All rights reserved. All copyright in this presentation and related works is solely and exclusively owned by IBEF. The same may not be reproduced,
wholly or in part in any material form (including photocopying or storing it in any medium by electronic means and whether or not transiently or
incidentally to some other use of this presentation), modified or in any manner communicated to any third party except with the written approval of
IBEF.
This presentation is for information purposes only. While due care has been taken during the compilation of this presentation to ensure that the
information is accurate to the best of TechSci Research and IBEF’s knowledge and belief, the content is not to be construed in any manner
whatsoever as a substitute for professional advice.
TechSci Research and IBEF neither recommend nor endorse any specific products or services that may have been mentioned in this presentation
and nor do they assume any liability or responsibility for the outcome of decisions taken as a result of any reliance placed on this presentation.
Neither TechSci Research nor IBEF shall be liable for any direct or indirect damages that may arise due to any act or omission on the part of the user
due to any reliance placed or guidance taken from any portion of this presentation.
46 GOA For updated information, please visit www.ibef.orgYou can also read