IPAP 2016/17 2017/18 - Economic Sectors, Employment & Infrastructure Development Cluster Presentation to the Portfolio Committee on Trade and ...
←
→
Page content transcription
If your browser does not render page correctly, please read the page content below
IPAP 2016/17 – 2017/18
Economic Sectors, Employment & Infrastructure
             Development Cluster
  Presentation to the Portfolio Committee on
       Trade and Industry, 24 May 2016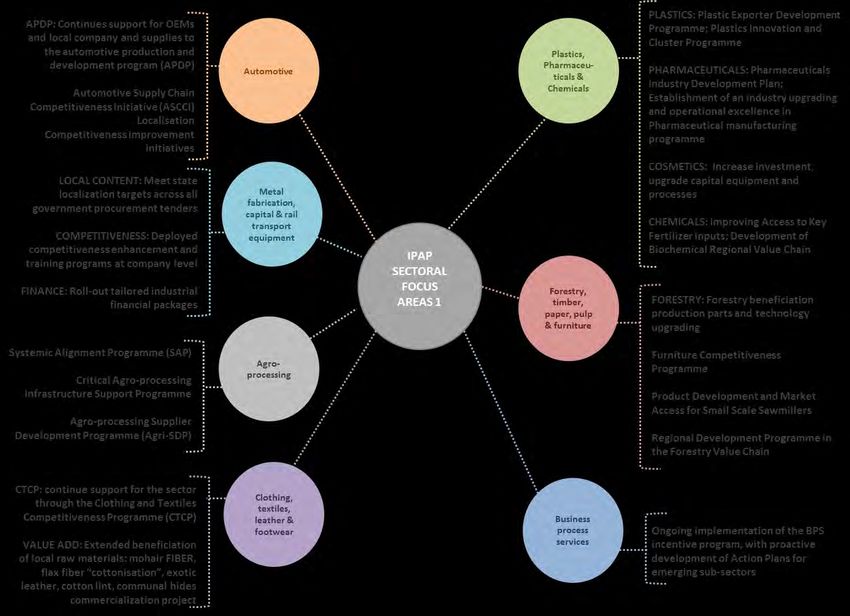
CONTENTS
•   Objectives
•   Selected sectoral highlights 2015/16
•   Selected transversal highlights 2015/16
•   Themes for 2016/17
•   Up-scaled IPAP: Key observations
•   Cross-cutting and sector specific programmes
•   Overcoming challenges
•   Global context – with supporting data
•   Domestic context – with supporting data

                                                   2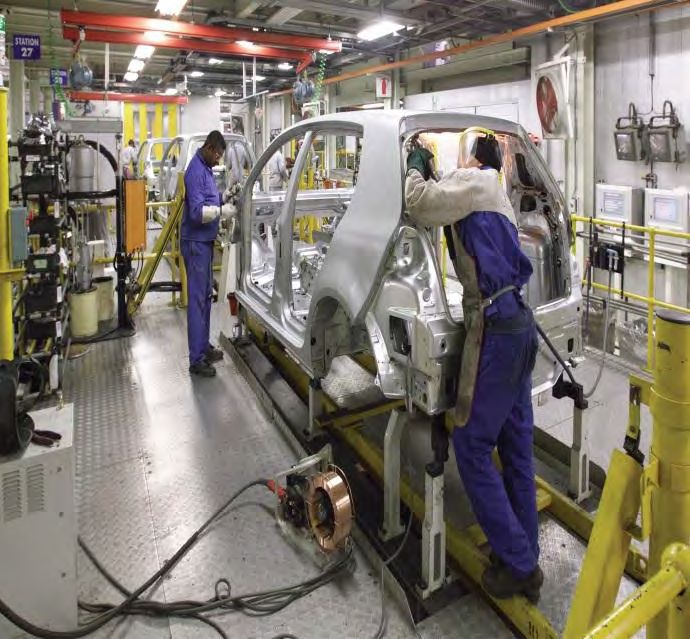
Policy context for the IPAP
• The Industrial Policy Action Plan (IPAP) 2016/17 is informed by the vision set
  out for South Africa’s development provided by the National Development
  Plan (NDP). The IPAP is a key pillar of the Presidents Nine Point Plan.

• IPAP 2016/17 – 18/19 is aligned with the Medium Term Strategic Framework
  (MTSF) and the Medium Term Expenditure Framework, (MTEF.

• Its policy foundation is provided by the National Industrial Policy Framework
  (NIPF) adopted in 2007.

• Government policy identifies industrial development as one of the key
  pillars required to catalyse inclusive growth with an emphasis , on value-
  addition, labour intensive sectors.

                                                                               3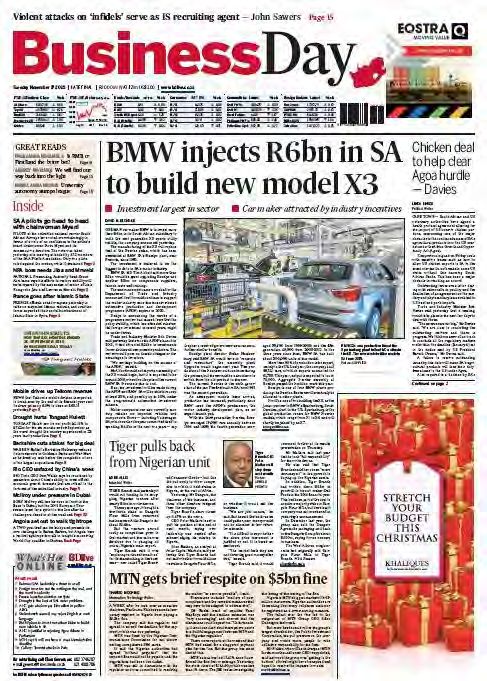
Policy context for the IPAP
•   IPAP programmes are underpinned by an understanding that the domestic
    economy has deep structural fault lines which require longer term solution. IPAP is
    also informed by a process which seeks identify key constraints to manufacturing
    growth in the domestic economy and a problem solving, collaborative approach to
    the solution of these constraints.

•   IPAP 2016/17 – 18/19 seeks to build upon the successes achieved and lessons
    learnt where industrial policy which is well designed; the subject of stakeholder
    engagement and collaboration and is adequately resourced has been successful –
    auto’s and CTLF

•   Successive annual iterations of IPAP have introduced new themes and focus areas
    to achieve a higher impact industrial policy. e.g. IPAP 2016 introduces an export
    focus leveraging a devalued currency.

•   Successive iterations of IPAP take into account the need to adjust and strengthen
    the range of policy instruments at governments disposal in a very dynamic global
    and domestic market
                                                                                        4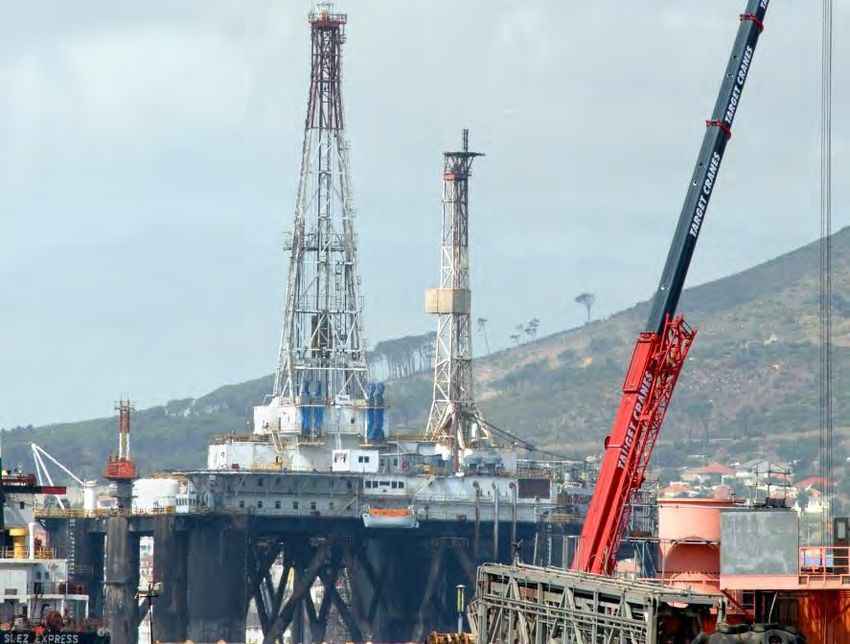
Core Objectives of the IPAP

                              5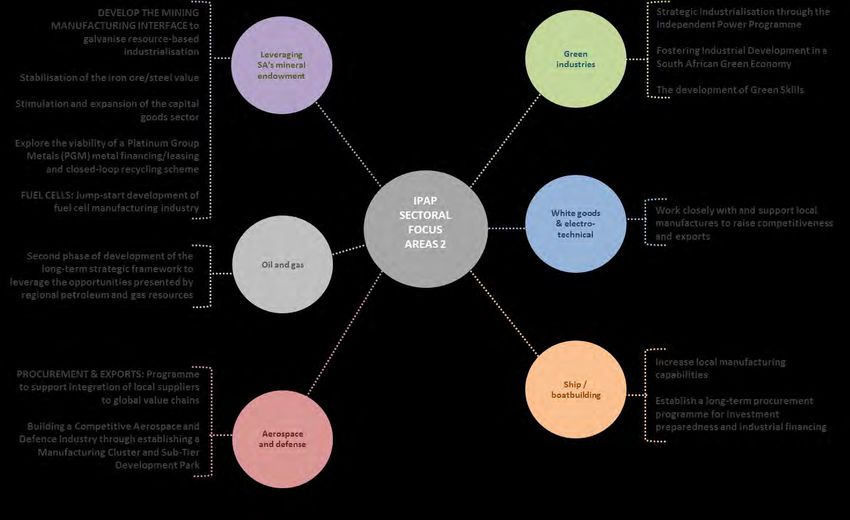
Selected Highlights: CTFL
•   The dti's support for the sector amounts to R3.5 billion,
    through the Clothing and Textiles Competitiveness
    Programme (CTCP) - saving over 67,000 jobs, and an estimated
    7,000 new decent jobs
•   The Competitiveness Improvement Grant (CIP) supports a
    number of national and sub- national clusters which promote
    world class manufacturing processes and principles e.g:
     − National: Leather & Footwear Cluster at Vaal University of
       Technology
     − Sub-national: Eddles – Foschini Footwear Cluster; Sub-
       national KZN Footwear & Leather Goods Cluster (Mr Price
       Cluster); SAFLEC/ Regional Footwear Cluster. The Foschini
       Group has been investing in the local supply chain through
       its Quick Response Initiative since 2009 (e.g. the Maitland
       facility, employing 560 people)
•   A R150 million eco-friendly blanket manufacturing factory
    opened in Boksburg, with 1,000 direct jobs created
•   Cape Union Mart’s K-Way factory has benefited from ongoing
    incentives and has created more than 200 new jobs

                                                                     6
Selected Highlights: CTFL

•   Transversal tenders managed and awarded by the NT
    increased from a total value of R237.9 million in FY 2014/5
    to R264.4 million in FY 2015/16
•   The Leather and footwear sub-sector continues to register
    positive results - exports grew by 60% from 2011 to 2014
•   In addition to the 22 factories that were opened in the
    2014/15 FY, 4 new factories opened since Oct 2015
     – Ariana Footwear, Prizm Footwear, Safety Boys, Mystic
       Eyes,
•   A well established local brand called Soviet has taken 51%
    stake by investing R 18 million in the Jaraf/Kayo Shoe
•   The Centre for Social Entrepreneurship (CSE) was launched
    at Durban University of Technology, with a R15 million
    grant from the dti

                                                                  7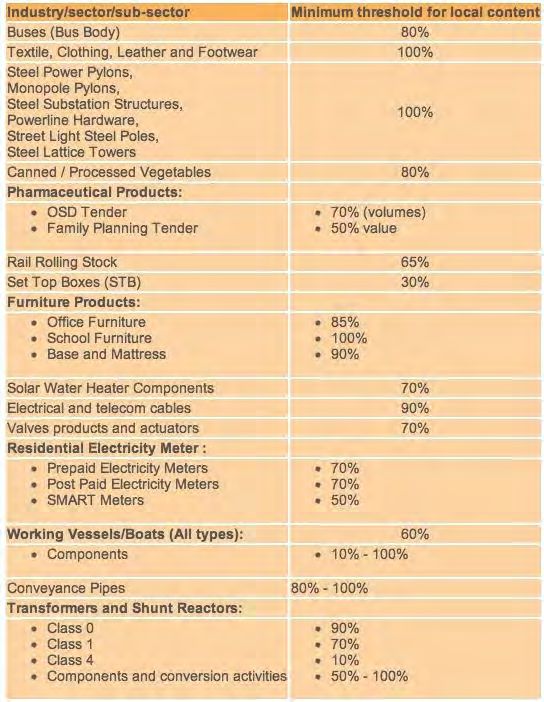
Selected highlights: Business Process Services
•   The BPS sector continues to maintain its status as a leading
    global outsourcing destination, whilst steadily moving up the
    value chain in terms of service offerings
•   Highlights include the following:
     – Investment Promotion Initiatives have resulted in new
       brands entering South Africa such as Foxtell, Coles,
       Vodafone, Easyjet, N Power, Quantas and Royal Mail Group
     – FY 2015/16: of the 18,000 offshore jobs which were
       created through BPS incentive, 9,077 were created
       between 2011 and 2014
     – 13,000 unemployed youth underwent sector-specific
       training through the Monyetla Work-Readiness Programme
     – A full service call centre established in Umhlanga, KZN will
       create more than 1,000 jobs over 18 months
     – The EXL Cape Town delivery centre, officially commissioned
       by Minister Rob Davies, currently employs 60 people, but is
       expected to create 3,000 jobs over the next three years

                                                                      8
Selected highlights: Film

•   Since the dti’s introduction of its first film incentive programme in 2004,
    the film industry has spent R15.2 billion in South Africa
•   FY 2015/16: 87 film and TV productions were supported by the dti, total
    investment of R887 million, supporting 81 000 jobs along the value
    chain
•   8 productions were showcased at the 2015 Cannes Film Festival's
    Marche du Film (film market) incl. South African/Angolan action cop
    drama, Dias Santana
•   In conjunction with the National Film and Video Foundation, the
    Gauteng Film Commission and Africa Magic, the dti supported local
    feature films Shushh and Ayanda
•   Other dti funded film projects were Cuckold (supported by the South
    African Emerging Black Filmmakers Incentive Scheme) and The Crash,
    film project from Julia Smuts Louw (Sparks Flew Development Studio)
•   “Of Kings & Prophets” - direct production spend in SA is R490m, of            “Of Kings & Prophets”
    which R391m is expenditure that qualifies for a 20% rebate from
    government

                                                                                                          9
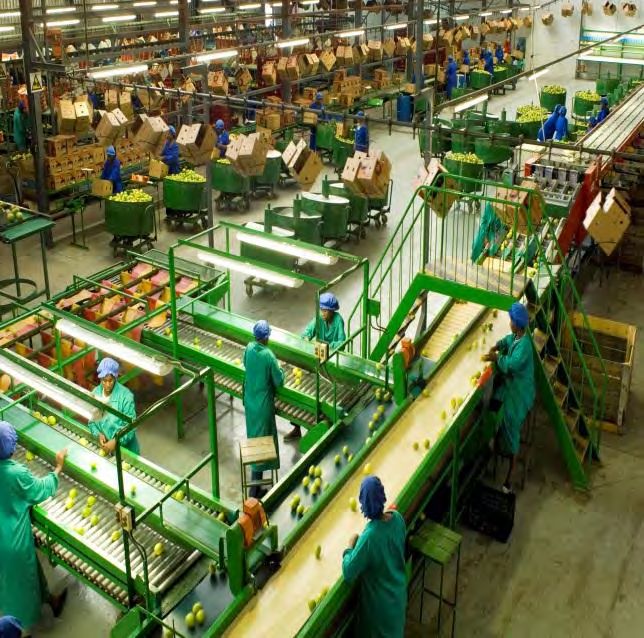
Selected Highlights: Agro-processing
• Nestlé has committed to help revive SA’s chicory industry by
  increasing its local sourcing of the plant for use in its Nescafé
  Ricoffy (chicory-based) coffee brand, in a move that will
  create 870 new jobs by 2019
• Ice Cream: A R600 million Unilever Ice Cream factory was
  opened in Midrand, supported by the dti to a value of R350
  million
• Grain staples: FABCOS was funded by the dti to establish and
  market the Home Grown brand
• Small enterprise development: Through a partnership
  between DAFF and EDD, MoUs have been signed with Tiger
  Brands, Nestlé and Massmart for enterprise development
  from the grass-roots upward

                                                                      10
Selected Highlights: Metal Fabrication, Capital And Rail
Transport Equipment
• Cutting tools manufacturer Renlaw announced a yearly growth
increase of 35%, owing to reinvestment of funds granted
under MCEP
• R100 million gold loan scheme launched
• Grindrod Rail showcased their ‘Proudly SA’ AC diesel-electric
shunting locomotive
• Guestro Foundry awarded contract for the supply of castings
components to Knorr-Bremse
Grindrod AC locomotive
• Duvha Foundry awarded largest rail bogie castings contract by
Transnet
• Aberdare Cables launched its latest production line for cables
for PRASA and Transnet’s combined R100 billion locomotive
build programmes
Helio Microfinish Foundry
11Selected Highlights: Green Industries
• South Africa’s Renewable Energy Independent Power Producer Procurement
Programme (REIPPPP) has proved to be the fastest growing renewable energy
programme in the world and is currently the leading infrastructure
development programme in South Africa.
• Since the 2012/13 FY the dti has facilitated investments to the value of R1,7
billion in the manufacturing of equipment and components for the renewable
energy industry
• The Minister of the dti, Dr Rob Davies, officially launched the R5-billion
Bokpoort concentrated solar plant in the Northern Cape. This project is the
largest investment by a Saudi company, ACWA Power.
• Investments in renewable energy generation include the following:
− The US Overseas Private Investment Corporation (OPIC), approved
funding for a $400-million solar farm in South Africa
− Eternity Power Thermal Harvesting Project received a R30 million
($2.134m) grant from the dti
− Gestamp Renewable Industries (GRI) opened a R300 million wind tower
factory in Atlantis, with 200 jobs initially created
− Kouga wind farm became operational at Oyster Bay in the E. Cape
12Selected Highlights: Green Industries
− SMA Solar Technology SA launched a multimillion-rand
manufacturing facility in Cape Town
− Amplats, together with Vuselela Energy and H1 Holdings,
unveiled a R150 million co-generation power plant at its
Waterval Smelting Complex in Rustenburg
− Technology group Abengoa announced a $660-million
investment in the 100 MW Xina Solar One project
Supply side measures include: Wind farm, Western Cape
− The National Cleaner Production Centre (NCPC) - working
with UNIDO - assisted 153 industrial plants; R1.54 billion saved
in energy costs; 5,700 jobs created/preserved
− NCPC has trained over 2,400 professionals since 2010
− A Thermal Test Chamber (TTC) for refrigerated vehicles was
established at the SABS in order to improve energy efficiency
and reduce greenhouse gas emissions
13Selected Highlights: Automotives
14Selected Highlights: Automotives
• The revised Automotive Production and Development
Programme (APDP) is the critical lever that has supported
investment by global OEMs to SA
• The APDP has leveraged private sector investment of
more than R25.7 bn over the last 5 years
− Daimler announced its decision to make South Africa
the regional base for its new global truck and bus
strategy. This is expected to bring significant business
to Mercedes Benz SA and ultimately result in new
investments in its East London plant.
− Beijing Automobile International Corporation - R11
billion 2 500 direct and 7,500 indirect jobs to be
created
− BMW - R6 billion for the production of BMW X3
15Selected Highlights: Automotives
− Nissan SA Rosslyn – only African manufacturing base for
relaunched Datsun Go, creating 225 new jobs
− VOLVO invested R60 million on a regional parts and
distribution centre in Benoni, Ekurhuleni
− Goodyear South Africa - R670-million to increase production of
high-value-added (HVA) consumer tyres
− VWSA invested R4.5 billion for new models and infrastructure
− Sumitomo Rubber Industries announced a second and final
phase of a R2bn investment. Sumitomo Rubber SA received
R300m through the dti’s automotive incentive scheme.
o This investment will ensure that the Ladysmith factory
retains its current 900 jobs and creates an additional 300
jobs.
16Selected highlights: Chemicals, Cosmetics, Plastics,
Pharmaceuticals
• A multi-million Rand Unilever Khanyisa household care factory was
launched in Boksburg.
• the dti supported the investment in the Khanyisa plant
under the 12i Tax Allowance Incentive scheme, with a
qualifying investment value of R1.2 billion, an investment
allowance of R350 million and a training allowance of R7 Unilever factory, Boksburg
million
• SA companies won 61.1% of the R2.7 billion Oral Solids Dosage
(OSD) tender
• A R940 million Anti-TB tender was awarded to local companies
• Cipla will invest R800 million into a new facility for the cost-effective
manufacture of biosimilars for supply into both public and private
sector markets Oral solid dosage
• European API manufacturer Sterling has confirmed an investment
€25 million (Euros) in the manufacture of low-volume, high-margin,
niche APIs for the local and international markets.
17Selected Highlights: Beneficiation
Steel industry
• Government is working closely with all stakeholders to save the
steel industry and steel value chain
• Fuel cell technology
• Working in conjunction with key stakeholders in government and
industry, the dti has made significant progress in accelerating the
development of the fuel cell industry
• the dti provided support for a 100kW static fuel cell
demonstration.
• Further plans for developing a 1.8MW hydrogen fuel cell project
are at an advanced stage, through a collaborative project
between the dti, IDC and Impala at the Chamber of Mines,
launched March 2015
18Selected Highlights: Beneficiation
• Isondo Precious Minerals (IPM) acquired the rights to
manufacture, use, market and sell licensed fuel cell
components worldwide, using a portfolio of membrane-
electrode assembly and membrane design, formulation and
manufacturing technology. the dti has provided R15 million
towards the feasibility phase of the project
• A demonstration fuel cell forklift with on-board metal
hydride storage was developed by the DST’s HySA initiative
for Impala Platinum Refineries. The forklift has been Membrane electrode assembly
operating since October 2015
• The Anglo-American Fuel Cell Project is powering the Naledi
Trust Community in Kroonstad (comprising an initial 34
households) through a 60kVA peak power fuel cell system
• Plans are well under way for the development of an
industrial park for fuel cell and battery production, linked to
Naledi Trust Community Fuel Cell
the current OR Tambo Industrial Development Zone
19Selected Highlights: Upstream Oil and Gas and
Boatbuilding
• TNPA identified projects valued at R16.8-billion to
facilitate the growth of the local ship-repair, ship-building
and oil and gas sectors
• the dti supported the opening of a R660 million Burgan
Terminals fuel storage project in Cape Town: 350 jobs to
be created Offshore rig, West Coast
• UK company Hunting PLC established a new R300 million
manufacturing facility in the WC to supply the African Oil
and Gas market
• R650 million invested in Coega and Saldanha Bay for
refining of used oil: 100-150 initial jobs to be created
• Chevron South Africa invested R450 million in the
construction of a multipoint ground flare in Milnerton,
Multipoint ground flare
Western Cape
20Selected Highlights: Upstream Oil and Gas and
Boatbuilding
• Southey Holdings and Nautic Africa have invested
R289.9 million and R63.4 million respectively,
supported under the 12i tax incentive and expected to
create 355 direct jobs
• Smit Amandla Marine partnered with Damen Smit Amandla support vessel
Shipyards Cape Town to build two new vessels in an
overall investment package worth R150 million
21Selected Highlights: Localisation
Local procurement has been identified as a
key lever for re-industrialisation.
Essential to secure greater compliance
with procurement prescripts across
government and SOE’s – audit function
Programmes are in place to build capacity
and improve strategic sourcing and
supplier development across government
departments; spheres of government and
State owned companies (SOC).
Private sector support for local
procurement has been slow to materialise
– but progress is being registered e.g.
mining
22Selected Highlights: Localisation
• Metals industry:
• Progress with the R50 billion Transnet contract for the building of 1064 locomotives includes:
o Locomotives being built at Transnet Engineering’s plants in Koedoespoort, Pretoria and
Durban
o IEC Holden assembled the first SA-made AC Traction motors, demonstrating rapidly
improving local capabilities
o In the General Electric supply to Transnet
o 1300 candidates trained in lean manufacturing and engineering
o Local content over 55% for fleet procuremnt
o Over 100 parts and components qualified for 27 local suppliers who have been certified
o Green field traction motor established
• PRASA signed a R51 billion deal with Gibela Consortium:
o Construction of a R1 billion factory complex at Dunnottar commenced
o The project - which will see 580 of the 600 trains manufactured in SA - is expected to
create about 1,500 direct jobs
o 19,000 artisans to be trained and job opportunities created with the launch of the
company’s latest production line
23Selected Highlights: Localisation
• Green industries
• The local content spend as at 30 June 2015 was R21.7 billion; and the planned
local content spend for the first 92 projects amounts to a total of R65 billion
• Automotives - Buses
• Since the implementation of local content regulations more than 700 bus
bodies have been manufactured and buses assembled in South Africa.
Beneficiaries to date include:
o Busmark 2000: received an order to assemble 700 buses for the City of
Cape Town
o Mercedes-Benz SA: successful tender to provide 134 buses for phase 1B
of Johannesburg’s Rea Vaya BRT system
o Volvo SA: successful tender to provide 40 new vehicles to the City of Cape
Town for its extended MyCiti bus routes, at a cost of R180m
o MAN: supplying 80 new commuter buses to Great North Transport,
Limpopo’s largest public transit operator
24Selected Highlights: Localisation
• Pharmaceuticals
• SA companies won 61.1% of the R2.7 billion Oral Solids Dosage (OSD) tender
• A R940 million Anti-TB tender was awarded to local companies
• Boatbuilding
• The company SAS is currently building 7 tugboats as part of a R1.4 billion
tender awarded by TNPA in 2014
o The contract has to date created approximately 200 additional jobs More
than 60 apprentice artisans are in training as well as three marine
engineers
o More than R700 million has been earmarked for the Supplier
Development Plan entered into by SAS and Transnet local suppliers,
employees and graduates
o Vee Craft was awarded a tender worth R23 million to build workboat
ferries for the Navy
25Selected Highlights: Industrial Financing
Industrial Development Corporation (IDC)
• FY 2015/16: The IDC disbursed R6 billion, supporting 4,753 new jobs and securing
4,126 jobs
Development Bank of Southern Africa (DBSA)
• The DBSA contributed more than R21 billion to government's infrastructure rollout and
municipal support, while DBSA’s total loan book increased to R56.7-billion
National Empowerment Fund (NEF)
• The NEF approved 700 transactions worth more than R6.9 billion for black-empowered
businesses across the country, supporting over 84,000 jobs
Manufacturing Competitiveness Enhancement Programme (MCEP)
• In the period April to December 2015, the MCEP approved funding for 232 entities.
R1.7 billion has been committed to support manufacturers, with a total investment
value of R8.8 billion, sustaining 52,466 jobs
26Selected highlights: Industrial Financing
Automotive Investment Scheme (AIS)
• For the period April to December 2015, the AIS approved 39 projects with total incentives
of R978 million and an estimated investment value of R3.7 billion
Enterprise Development Programme
• The dti launched a R22 million two-year pilot programme to uplift SA’s Industrial Parks
• In an initial step, the dti will spend more than R44 million on the revitalisation and
refurbishment of two state-owned industrial parks in the Eastern Cape
12i Tax Allowance Incentive Scheme
• FY 2015/16: 26 projects with an investment value of R9.5 billion were approved
Aquaculture Development and Enhancement Programme (ADEP)
• FY 2015/16: ADEP supported 11 projects, with an incentive value of R 49 million.
Investment leveraged was R206 million and 291 new jobs are expected to be created
27Selected Highlights: Foreign Investment
• FY 2015/16: An investment pipeline of R 31.9 billion achieved
• A number of Multinationals have affirmed SA as a regional
manufacturing hub, investing in new plant, machinery and
technology and upgrading existing plant capacity:
− Unilever - R 4 billion
− Nestlé - R99.8 million
− Samsung - R228 million
− Johnson & Johnson - R300 million
28Selected Highlights: Industrial Development Zones (IDZs)
• To date IDZs have created 73,000 jobs - 6,896
(9.6%) direct and 65,637 (90.4%) indirect
• Coega IDZ has attracted R151 billion since its
inception
• Ngqura Port unveiled two new berths and
associated port operating equipment costing R2
billion
• Two SEZs - Dube Trade Port and Maluti-a-Phofung -
Coega aerial view
have been designated since the establishment of
the programme
29Selected Highlights: Ports
• The Ports Regulator decided on an average tariff increase of 0%, for the
tariff year 2016/17. This will be applicable as follows:
o All cargo dues for 2016/17 shall increase by 0%, except marine
services and related tariffs which are to increase by 3.0%.
o Full container exports will, in support of the under-threat to the
South African manufacturing sector, decrease by 10%.
o Automotive volume discounts shall be equalised for all users at the
maximum 60% level discount
o Maize will receive a 50% discount on cargo dues, capped at 5
million tonnes, for the 2016/17 tariff year as part of the holistic
approach to limit the impact of the drought on the people of South
Africa
30IPAP 2016/17 - Key Themes
• Build on the policy platforms, learnings and achievements of existing programmes – e.g. Autos, CTLF,
BPS, Renewable Energy:
Continue to utilise and strengthen the ‘toolbox’ of industrial policy instruments across and
within sectors where SA has built competitive advantages and capabilities and where new
capabilities can be built working closely with global OEM’s and domestic champions.
Increase focus on labour-intensive sectors like agro-processing and component suppliers in key
value chains
• Boost new growth sectors like Oil and Gas, Locomotives, Capital Equipment, Heavy Commercial
Vehicles and Shipbuilding
• Strengthen public procurement to support the local manufacturing sector and the growth of world-
class industries
Stronger emphasis on compliance and enforcement
Closer alignment of all policy levers – Designation; CSDP, NIP to achieve higher levels of
localisation and supplier development and raise competitiveness
• Continue efforts to secure a higher-impact set of industrial financing and incentive instruments to
build and support key industrial sectors and capabilities
Design sector specific incentives for agro-processing and metals sectors
Stronger export credit support and sector-specific incentives, including the roll-out of the Black
Industrialists Incentive Scheme
31Key Themes for IPAP 2016/17
• Leverage the competitive advantage that a devalued currency
provides for the productive sectors of the economy - particularly
manufacturing:
Stronger engagement and support for existing exporters and a
programme to support companies to be ‘export ready’ with a focus on
African opportunities.
The promotion of Special Economic Zones and Cluster Programmes to
support investment and exports.
Close collaborative work with the Department of Science and Technology
to secure support for technology acquisition and innovation. E.g.
Technology Localisation Unit at the CSIR
• Minimise regulatory and red tape barriers – real or perceived – which
hinder investment and expansion and tighten up intra-governmental
coordination required to underpin the new One-Stop Investment
Centres
32Key Themes for IPAP 2016/17
• Provide ongoing support for less energy-intensive and carbon-mitigating
production methods e.g the work of the National Cleaner Production Centre and
• Secure stronger localisation criteria and investment in component manufacture for
SA renewable energy generation programme.
• Strengthen the important economic linkages between the primary agriculture,
mining and manufacturing sectors in order to secure much greater downstream
beneficiation and maximise upstream linkages
Arising from the Mining Phakisa, ensure that “Mining Cluster” programmes are
carried forward expeditiously
• Scale up work to develop and roll out a gas-based industrialisation programme.
This includes:
Developing a robust and diversified market for gas; and
Rollout critical gas dependant projects such as the Fuel-cell Technology
Programme
33Overcoming Challenges
A solutions-based approach to key challenges has been adopted by the
Economic Sectors, Employment and Infrastructure Cluster. This must be directly
applied to:
1. Overcoming electricity supply constraints and elevated prices - including
creating an enabling environment for own- and co-generation, with a
particular focus on renewable energy and fuel cell technology
opportunities
2. A continuing effort to secure port and rail network reforms to overcome
inefficiencies and associated high costs - with a particular emphasis on
supporting export competitiveness
3. Concerted efforts to address deep-seated and serious skills deficits and
mismatches that impact on the capacity of the economy to grow faster and
diversify more effectively
4. Careful and attentive management of the operational environment in the
steel sector across the entire value chain to secure stability and growth
34Securing a higher impact IPAP : Key Observations
• IPAP is one of the Presidents 9 Point Plans. A focussed national industrial
effort characterised by policy coherence and certainty and a close
collaborative effort between government, the private sector and labour is
required.
• IPAP is a product of the Economic and Employment Sectors Cluster of
government and assigns a leading and supporting role to key government
departments and institutions. IPAP is a very important tool to secure
stronger industrial planning, intra-government co-ordination and oversight.
• It is critical that compliance across and between national government
departments, provincial and municipal spheres of government and SOCs is
secured in a collaborative national industrial effort eg; localisation in the
public procurement system.
• There are few short-cuts and ‘overnight’ impacts: continuous improvement,
learning-by-doing, strengthening the capacity of the state and deepening
stakeholder engagement are the critical factors
35IPAP 2015/2016 TRANSVERSAL FOCUS AREAS
Monitor and ensure compliance with Strategic, coordinated, integrated
sector designation and localization industrial financing system, combining the
requirements in state procurement joint efforts of state and development
finance institutions
Monitor expenditure and implements of
local content requirements Integration of DST innovation and
Public Industrial commercialization support measures with
Increasing aggregate demand through procurement Financing roll out of Black Industrialist program
“Buy Local” campaign
Priority processing for dynamic firms –
Further designation of products for local with greater selective/strengthened
procurement conditionalities
Flexible/strategic tariff setting Expansion of existing Industrial
Development Zones: creation of new
Further development of enabling Special Economic Zones
standards and compulsory specifications SEZs and
IPAP
Developmental Regional Develop SEZs as dynamic platforms for
Closer and more detailed collaboration trade policy TRANSVERSAL Economic foreign direct investment (FDI) and for
with Custom to prevent illegal imports FOCUS AREAS Clusters the deepening of strategic industrial and
export capacity, both in the SEZs
Continued realignment of technical themselves and in associated regional
infrastructure activities in support of key industrial clusters
IPAP sectors
Coordinated development of African
regional infrastructure, support for
Regional
Ongoing review of incentives and Innovation
Integration complementary industrialisation,
and integrated of value chains and expanded
instruments for Science, Technology and
technology
Innovation (STI) to finalise an STI trade
system, aligned to incentives and
industrial financing
Formalise and R&D-led industrial
development approach through
implementation of the Emerging
Industries Action Plan (EIAP)
Develop a portfolio of R&D projects
aimed at scaling up industrial growth
36IPAP 2016/2017 SECTORAL FOCUS AREAS 1
37IPAP 2016/2017 SECTORAL FOCUS AREAS 2
38Global Context 1
• The lingering effects of the great global recession continue to be felt worldwide;
reflected in stagnant demand from developed and developing countries alike
• Seven years after the global financial crisis and the great global recession that
followed, successive aftershocks have impacted the domestic economy including
weak aggregate demand, falling commodity prices and increasing financial market
volatility in major economies
• The contraction and ‘rebalancing’ of the Chinese economy towards a greater focus
on domestic demand has had significant and negative consequences for
commodity exporting countries
• Forecasts indicate that many African countries’ growth will likely fall below
expectations, mainly as a result of the slump in primary commodity prices
• Against the backdrop of falling commodity prices, increased capital outflows from
developing countries and diverging monetary policies, exchange rate volatilities
have become more pronounced and many emerging-market currencies have
devalued amid significant capital outflows
39Commodity prices
Source: IMF
40China’s imports of selected commodities
Source: UN
41Comparison of export basket to China in
2011 vs 2015
SA export basket to China in 2011 SA export basket to China in 2015
Non-ferrous Paper Agriculture
metal products Processed
1.4% Industrial
Other products 1.4% food Other manuf.
manuf. 1.7%
Other chemicals 1.3% 0.7% Other
1.8% 1.3% 3.0%
1.8% PGMs
PGMs 3.1%
Agriculture Iron ore
1.8% Industrial
chemicals 3.5% 35.7%
1.9% Paper
Iron and products Non-ferrous
steel 4.3% metal
9.5% Coal products
10.9% 5.1%
Iron ore Iron and
Other steel
49.8%
mining 18.5% Other mining
18.0% 23.4%
Source: IDC
42South African produced export commodity prices (excl. gold)
Source: SARB
43Domestic context
• The domestic economy has continued to be impacted by the
lingering effects and successive ‘after-shocks’ of the great global
recession
• Mining and steel industries have been severely impacted
• The sharp downturn in mining - a direct effect of the generalised
slump in commodity demand and prices - carries with it significant
knock-on effects for the domestic economy in general
• A steel crisis occasioned by massive over-capacity in the global steel
industry has hit South African producers very hard, threatening the
competitiveness and sustainability of many domestic producers
• The prolonged and severe drought in many parts of the sub-region is
having a severe impact on agricultural production of staple goods
and will result in a significant increase in agricultural imports as well
as driving a switch to cheaper alternatives.
44Sector contribution to GDP
45Real GDP by industry, percentage change
Manufacturing
Mining
Agriculture
-25 -20 -15 -10 -5 0 5 10 15
Source: SARB
Q4 2015 Q3 2015 Q2 2015 Q1 2015
46Mining GDP, Employment, Export, Investments
25
Mining GDP 300 10
Mining employment 900
800
20 250 8 700
600
Number ('000)
Rand bn
Per cent
Per cent
15 200 6
500
400
10 150 4
300
5 100 2 200
Mining GDP as % of SA GDP (Lhs) Mining employment as % of SA jobs (Lhs)
100
Mining GDP at 2010 prices (Rhs) Mining employment (Rhs)
0 50 0 0
1970 1975 1980 1985 1990 1995 2000 2005 2010 2015 1970 1975 1980 1985 1990 1995 2000 2005 2010 2015
Mining exports Mining investment (GFCF)
70 350 16 80
60 300 14 70
50 250 12 60
10 50
Rand bn
Per cent
Rand bn
Per cent
40 200
8 40
30 150
6 30
20 100
4 20
Mining exports as % of SA exports (Lhs) Mining GFCF as % of SA GFCF (Lhs)
10 50 2 10
Mining exports at 2010 prices (Rhs) Mining GFCF at 2010 prices (Rhs)
0 0 0 0
1970 1975 1980 1985 1990 1995 2000 2005 2010 2014 1970 1975 1980 1985 1990 1995 2000 2005 2010 2015
47
Source: SARBAgriculture GDP, Employment, Export, Investments
9 Agriculture GDP 80 20 Agriculture employment 3.0
8 70
2.5
7 60 15
Number (million)
2.0
Rand bn
6 50
Per cent
Per cent
5 40 10 1.5
4 30
1.0
3 20 5
2 Agriculture GDP as % of SA GDP (Lhs)
10 Agriculture employment as % of SA jobs (Lhs) 0.5
Agriculture GDP at 2010 prices (Rhs) Agriculture employment (Rhs)
1 0 0 0.0
1970 1975 1980 1985 1990 1995 2000 2005 2010 2015 1970 1975 1980 1985 1990 1995 2000 2005 2010 2015
Agriculture exports 8 Agriculture investment (GFCF) 35
12 40
Agricultural exports as % of SA exports (Lhs)
Agricultural exports at 2010 prices (Rhs) 35 7 30
10
30 6 25
8 5
Rand bn
Per cent
25
Rand bn
Per cent
20
6 20 4
15
15 3
4 10
10 2 Agriculture GFCF as % of SA GFCF (Lhs)
2 1 5
5 Agriculture GFCF at 2010 prices (Rhs)
0 0 0 0
2014
1970 1975 1980 1985 1990 1995 2000 2005 2010 1970 1975 1980 1985 1990 1995 2000 2005 2010 2015
Source: SARB
48Manufacturing GDP, Employment, Export, Investments
Manufacturing GDP Manufacturing employment
26 400 18 2.0
24 350 16 1.8
22 300 14 1.6
Number (million)
Rand bn
Per cent
20 250
Per cent
12 1.4
18 200 10 1.2
16 150 8 1.0
14 Manufacturing GDP as % of SA GDP (Lhs) 100 Manufacturing employment as % of SA jobs (Lhs)
6 0.8
Manufacturing GDP at 2010 prices (Rhs)
Manufacturing employment (Rhs)
12 50 4 0.6
1970 1975 1980 1985 1990 1995 2000 2005 2010 2015 1970 1975 1980 1985 1990 1995 2000 2005 2010 2015
Manufacturing exports Manufacturing investment (GFCF)
70 600 30 120
Manufacturing exports as % of SA exports (Lhs)
60 Manufacturing exports at 2010 prices (Rhs)
500 25 100
50
400 20 80
Rand bn
Per cent
Rand bn
Per cent
40
300 15 60
30
200 10 40
20
10 100 5 Manufacturing GFCF as % of SA GFCF (Lhs) 20
Source: SARB Manufacturing GFCF at 2010 prices (Rhs)
0 0 0 0
2014
1970 1975 1980 1985 1990 1995 2000 2005 2010 1970 1975 1980 1985 1990 1995 2000 2005 2010 2015
49Appendix A: List of leather and footwear factories
opened since 2014/15
New Employer Sector Location
1 Ihlobo Footwear Footwear CMT KwaZulu-Natal
2 Lugro Ostrich General Goods & HB South West
3 Phoenix Industrial Footwear Gauteng
4 Salsa Footwear Footwear Pietermaritzburg
5 Hot Chocolat General Goods & HB Western Cape
6 Phipps Exotic Belts General Goods & HB Western Cape
7 Ubergruvi Footwear Western Cape
8 Rarity Bags General goods & HB Western Cape
9 Le Croc Tanning North West
10 Pontevecchio Footwear Gauteng
11 Hurrican Shoe Footwear Western Cape
12 Comorant Manufacturers Tanning Eastern Cape
13 Jozi Footwear Footwear KwaZulu-Natal
50Appendix A: List of leather and footwear factories
opened since 2014/15
New Employer Sector Location
14 Fusion Leather World Tanning Western Cape
15 Value Footwear Footwear Pietermaritzburg
16 Deano Shoes Footwear KwaZulu-Natal
Frisbee Trade % Invest 1029
17 cc Footwear KwaZulu-Natal
18 King Victoria Shoes Footwear KwaZulu-Natal
19 Arena Trims Footwear KwaZulu-Natal
Van & Van Shoe South Western
20 Components Footwear CMT Districts
21 Chimpel cc General Goods & HB Western Cape
22 Bright Idea Projects 179 cc Footwear KwaZulu-Natal
23 Ariana Footwear Footwear KwaZulu-Natal
24 Prizm Footwear Footwear KwaZulu-Natal
25 Safety Boys Footwear KwaZulu-Natal
26 Mystic Eyes Footwear CMT KwaZulu-Natal
51Thank You
52You can also read