Layers of possibilities - KGHM Group Investor Presentation

Page created by Donald Sullivan
 
CONTINUE READING
Layers of possibilities - KGHM Group Investor Presentation
Layers of possibilities

                          KGHM Group
                          Investor Presentation
                          December 2019
Layers of possibilities - KGHM Group Investor Presentation
Cautionary statement

    This presentation was prepared by KGHM Polska Miedź S.A. (KGHM). The presentation is strictly of an informational nature and should
    not be construed as containing investment advice. The users of this presentation are solely responsible for their own analysis and
    assessment of the market situation and of the potential future results of KGHM based on the information contained in this presentation.
    The presentation is not, and should not be construed to be, an offer to sell, or to submit an offer to purchase, any of the securities of
    KGHM. The presentation is also neither in whole nor in part the basis for concluding any agreement or contract whatsoever or for
    undertaking any liabilities whatsoever. Moreover, this presentation does not represent a recommendation to invest in the securities
    of KGHM.
    Neither KGHM nor any of its subsidiaries shall be held liable for the results of any decisions taken based on or utilizing the information
    contained in this presentation or arising from its contents. The market-related information contained within this presentation was
    partially prepared on the basis of data arising from those third parties mentioned in this presentation. Furthermore, certain declarations
    contained in this presentation may be of a forward-looking nature – in particular, such declarations may be in the nature of projections,
    developed based on actual assumptions, reflecting known and unknown types of risk as well as a certain level of uncertainty. The actual
    results, achievements and events which occur in future may significantly differ from the data directly contained or understood to be
    contained within this presentation.

    In no case whatsoever should the information contained within this presentation be considered as a clear or understood declaration,
    or as any type of assertion whatsoever by KGHM or persons acting in its behalf. Neither KGHM nor any of its subsidiaries are required
    or obligated to update this presentation or to provide its users with any additional information whatsoever. KGHM furthermore hereby
    notifies the users of this presentation, that the sole reliable source of data on its financial results, forecasts, events and company
    indicators are the current and periodic reports published by KGHM in performance of the informational obligations arising from Polish
    law.

1
Layers of possibilities - KGHM Group Investor Presentation
Representatives
    KGHM Polska Miedź S.A.

    Radosław Stach                      Janusz Krystosiak               Stephen Marks

    Vice President of                   Director,                       Manager,
    the Management Board (Production)   Investor Relations Department   Investor Relations Department

2
Layers of possibilities - KGHM Group Investor Presentation
Agenda

     1. Key information about      2. The KGHM Group       3. Production and financial
         the KGHM Group                vs the sector      results of the KGHM Group –
                                                                   annual data

     4. Production and financial    5. Advancement of         6. Additional slides,
    results of the KGHM Group –    the Group’s Strategy               Q&A
            9M 2019 data

3
Layers of possibilities - KGHM Group Investor Presentation
Key information about the KGHM Group
Layers of possibilities - KGHM Group Investor Presentation
KGHM Group in brief

        One of the world’s largest                                            A diversified portfolio of assets
                                               634 thousand tonnes
     producers of copper and silver                                          at various stages of development
                                         of payable copper production by
    with nearly 60 years of experience                                           located in mining-friendly
                                             the KGHM Group in 2018
         in mining and metallurgy                                                       jurisdictions

                                         A stable and competitive position
    Member of the prestigious indices                                          An organisation with strong
                                                 in a key sector for
      Respect Index & FTSE4Good                                              values-based roots, focused on
                                                the global economy
     published by the WSE and LSE                                             corporate social responsibility
                                          - copper mining and processing

5
Layers of possibilities - KGHM Group Investor Presentation
KGHM: a top ten copper producer and a leading Polish exporter
    The Group has a global reach and plays a significant role on the global copper and silver markets

                                                                                                      Eighth            Cu     Third             Ag
                                                                                                      largest                  largest
                                                                                                      copper                   silver
                                                                                                      producer                 producer

                                                                                                       Other KGHM Group products:
                                                                                                          Molybdenum    Platinum     Copper
                                                                                                          Lead          Rhenium       sulphate
                                                                                                          Nickel        Sulphuric    Nickel
                                                                                                          Gold           acid          sulphate
                                                                                                          Palladium     Selenium
      Legend:      Mining projects of KGHM   Mines of KGHM   Metallurgical facilities of KGHM

                Geology                                         Mining                                                  Metallurgy

                Exploration and                                                                               Smelting and
                                                Ore extraction                       Ore enrichment                                    Casting
                  evaluation                                                                                    refining
6
Layers of possibilities - KGHM Group Investor Presentation
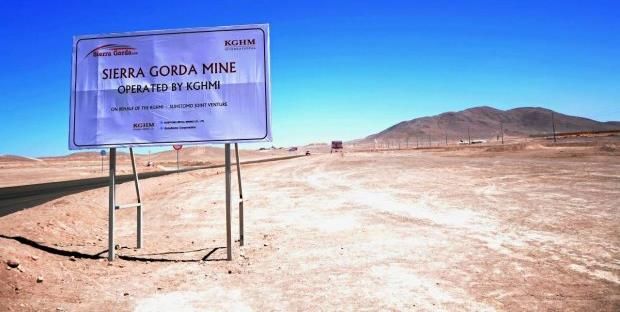
KGHM among the biggest copper and silver producers

         Mined Copper production 2018 1)                                               Silver production 2018 2)

                                                                               1 771                                                       1 807

                                                                       1 440                                                    1 086

                                                                   1 344                                                        1 054 3)

                                                               1 105                                                      815

                                                         892                                                             787

                                                   674                                                                    771

                                                567                                                                      762

                                               521                                                                  613

                                              498                                                                   610

                                             476                               [kt]                                538                     [kmt]

    1)    Copper Market Outlook, CRU, April 2019
    2)    World Silver Survey 2019
7   3)    KGHM results as reported in its consolidated financial statement 2018
Layers of possibilities - KGHM Group Investor Presentation
A proud history of mining and metallurgy

     Discovery of the copper deposit brought about a fundamental change in the region’s economy thanks
     to the growth of KGHM Polska Miedź S.A. As a result of M&A activities, capped by the acquisition of
     Quadra FNX, KGHM became a truly global copper producer aimed at continued growth

      1957       1960–70       1968–78        1969–74         1977–80          1993          1997          2012           2014            2015        2018–19

     Discovery   Founding of      Start of    Completion     Construction     Start of     IPO - KGHM    Acquisition      Start of        Level of    Start-up of
       of the     the Lubin    construction   of the Rudna       of the      precious        joins the      of the      production     commercial         flash
      copper         and        of Głogów         mine       Sieroszowice   metals plant      Warsaw      Canadian     by the Sierra    production      furnace
    deposit by    Polkowice       smelter                        mine       – silver and       Stock       mining      Gorda mine       reached by    technology
        Jan         mines        /refinery                                      gold        Exchange      company                      Sierra Gorda      at the
    Wyżykowski                                                                                           Quadra FNX                                    Głogów I
                                                                                                                                                        smelter

8
Layers of possibilities - KGHM Group Investor Presentation
Core production assets in Poland – stable output and earnings
    Underground mines, fully integrated production

                                        Lubin Mine                                      Legnica Smelter and Refinery
                                        27 years LOM                                    LME grade A-registered cathodes
                                        2018 production stats:                          Capacity of ~120 kt electrolytic Cu/year 1)
                                         Cu production (payable): 70 kt                 Other metals produced: Ag, Au, Pb, Re
                                         Copper Grade: 0.95%                            2018 Cu production: 115 kt

                                        Polkowice-Sieroszowice Mine                     Głogów I Smelter and Refinery
                                        37 years LOM                                    LME grade A-registered cathodes
                                        2018 production stats:                          Capacity of ~239 kt electrolytic Cu/year 1)
                                         Cu production (payable): 196 kt                Other metals produced: Ag, Au, Pb, Re
                                         Copper Grade : 1.71%                           2018 Cu production: 183 kt

                                        Rudna Mine                                      Głogów II Smelter and Refinery
                                        22 years LOM                                    LME grade A-registered cathodes
                                        2018 production stats:                          Capacity of ~223 kt electrolytic Cu/year 1)
                                         Cu production (payable): 186 kt                Other metals produced: Ag, Au, Pb, Re
                                         Copper Grade: 1.63%                            2018 Cu production: 204 kt

                                        Deep Głogów Project
                                         Extension of Rudna and Polkowice-             Cedynia Copper Wire Rod Plant
                                          Sieroszowice mines
                                                                                        Contirod and Upcast technology
                                         DG production figures are included in Rudna
                                          and Polkowice-Sieroszowice mines’              2018 Cu wire rod production: 266 kt
                                          production stats

9   1)   Capacity excluding cyclical planned maintenance shutdowns
Key international assets
     Existing operations and growth potential from projects

                      Producing assets                                    Potential growth projects

                           Sierra Gorda (55% stake), Chile                        Sierra Gorda Oxide, Chile
                           25 years LOM         2018 production stats:            10 years LOM
                            Open-pit mine        Cu production                   The project aims at processing the oxide ore
                            Porphyry               (payable): 53 kt               The oxide ore is currently stored separately for
                                                                                     later heap leaching
                                                                                   Oxide ore will be transported to a permanent
                                                                                     heap, where it will be processed via leaching
                           Robinson Mine, USA
                           7 years LOM          2018 production stats:
                            Open-pit mine        Cu production
                            Porphyry/              (payable): 49 kt              Victoria, Canada
                              Skarn orebody                                       14 years LOM
                                                                                   The projects assumes building an underground
                                                                                     copper-nickel mine
                           Sudbury, Canada                                         Current development scenario assumes
                                                                                     exploiting the deposit via 2 shafts
                           8 years LOM        2018 production stats:
                                                                                   18 kt Cu p.a., 16 kt Ni p.a.
                            Underground mine  Cu production
                            Footwall/            (payable): 7.4 kt
                              Contact orebody

                                                                                  Ajax (80% stake), Canada
                           Franke Mine, Chile                                     19 years LOM
                                                                                   The project assumes building an open-pit
                            2 years LOM         2018 production stats:
                                                                                     copper-gold mine and processing plant with
                             Open-pit mine       Cu production: 20 kt
                                                                                     associated infrastructure.
                             IOCG orebody          (cathodes: SX-EW)
                                                                                   53 kt Cu p.a., 114 k troz Au p.a.

10
Sierra Gorda

          Sierra Gorda is an open pit copper and molybdenum mine
          located in Chile’s Antofagasta region in the Atacama desert.
          Sierra Gorda is a Joint Venture of:
                KGHM Polska Miedź S.A. – 55% share
                Sumitomo Metal Mining – 31.5% share
                Sumitomo Corporation – 13.5% share

          Schedule of Sierra Gorda development

          2006           2007          2008        2009       2010      2011                  2014          2015      2016     2017 2018
                                                                                                                                                   2042

              Discovery of mineralization     Scoping Study            Start of          First production    Commercial
              and start of the exploration     completion            construction            of copper       production
                        program                                                            concentrate

          Life of mine based on documented                       Sierra Gorda end products are         Cu production in 2018          96.9 kt1)
                  resources is 25 years                   copper concentrate and molybdenum
                                                                                   concentrate         Mo production in 2018       26.7 mn lbs1)

11   1)    Data on a 100% basis for Sierra Gorda
The KGHM Group vs the sector

Macroeconomic environment
     Commodities and currencies prices

     The average PLN-expressed copper price since                                                          A strong USD offsets weaker copper prices in USD/t
     the start of the year at levels similar to prior year                                         [USD]            Price (USD/t)                     Annual av. (USD/t)         [PLN]

                                                                                                                    Price (PLN/t)                     Annual av. (PLN/t)
                                                                                                   8 000                                                                         28 000
         In Q3 2019 the USD-expressed copper price decreased (–5% yoy) compared to
          the corresponding period of 2018 alongside a 13% higher silver price and a               7 500                                                                         26 000

          slightly higher molybdenum price                                                                                                                                       24 000
                                                                                                   7 000
                                                                                                                                                                                 22 000
         Copper prices expressed in PLN remained at a similar level to Q3 2018 (-0.4%             6 500
                                                                                                                                                                                 20 000
          yoy), although in terms of the change versus the prior quarter (Q3 to Q2 2019)
                                                                                                   6 000
          they were lower (-3.4% q/q), mainly due to a decrease in the USD-expressed                                                                                             18 000
                                                                                                   5 500                                                                         16 000
          copper price, which was only partially offset by the USD/PLN exchange rate
                                                                                                   5 000                                                                         14 000
         The main factors affecting metals prices and exchange rates in the past quarter
                                                                                                       Jan-18    May-18      Sep-18      Jan-19       May-19        Sep-19
          were mainly aspects of the on-going uncertainty in the global economy (trade
          war, Brexit)                                                                                                                   Source: Thomson Reuters, KGHM Polska Miedź S.A.

      Copper price                            Silver price                            Molybdenum price                                Exchange rate
      [USD/t]                                 [USD/koz t]                             [USD/lb]                                        [USD/PLN]

                 6 105           5 802                                  16.98                                       12.18
                                                                                                  12.07                                        3.70                   3.88
                                                       15.02

                Q3 2018        Q3 2019                Q3 2018          Q3 2019                   Q3 2018           Q3 2019                   Q3 2018                Q3 2019

13
Record amount of uncertainty in the global economy
     World Uncertainty Index (WUI) 1996 – 2019

              Światowy Index Niepewności
                World Uncertainty         (WUI)
                                  Index (WUI)
                                                                                                                                 US fiscal cliff and
                Average
              średnia   1996Q1 – 2010Q4
                      1996Q1-2010Q4                                                                                              sovereign debt crisis               Uncertainty concerning Brexit
                                                       Iraq war and                                                              in Europe                              and USA trade policy
                                                                                                     Sovereign debt crisis in
                                                       outbreak of                                   Europe
                               Possible US             SARS
        300                    military
                               action in Iraq                                  Ongoing turmoil                                                         US presidential elections,
                                                                                                         Sovereign credit                               and aftermath of Brexit
                                                                               in global financial       risk in Europe
        250                                                                    markets
                         US recession
                         and 9/11
                                                                       Financial
        200                                                            credit crunch

                     Global economic
                     slowdown
        150

        100

                                                                                                                                                            Brexit
         50
                                                                                                                FED tightening and political risk in               Political uncertainty in Europe
                                                                                                                       Greece and Ukraine                         related to the threat of Catalan
                                                                                                                                                                        secession from Spain
         0
       Q1 1996Q1
          1996                Q1 1999Q1
                                 1999             Q1 2002Q1
                                                     2002             Q1 2005Q1
                                                                         2005              Q1 2008Q1
                                                                                              2008                 Q1 2011Q1
                                                                                                                      2011                 Q1 2014Q1
                                                                                                                                              2014                   Q1 2017Q1
                                                                                                                                                                        2017              Q1 2020

14   Source: H. Ahir, N. Bloom, D. Furceri „World Uncertainty Index” (2018)
By 2030 the demand for copper is forecasted to be higher by over 20%
     Industries related to electromobility and renewable energy sources will be a crucial element in higher
     demand, with supply under pressure

       Forecasted copper consumption (2018-2030)
       [kt]                                                              Stable growth of demand for copper is expected
                                                                          to 2030
                                                                         During that time China will remain the main
       38 000
                           CRU                                            market for copper, but dynamic growth of
                           Wood Mackenzie
                                                                          demand is seen in other Asian economies
       36 000                                                            Forecasted growth will result from the dynamic
                                                                          increase in demand from industries related to
       34 000
                                                                          electromobility and renewable energy sources
                                                                         Transportation will show the strongest growth rate
                                                                          among copper-oriented industries
       32 000
                                                                         It is expected that by 2030 the yearly demand
                                                                          resulting from development of the electromobility
       30 000                                                             industry will increase 8-fold in comparison to 2017
                                                                         During this period the alignment of demand for
       28 000                                                             copper coming from electric vehicles and from
                 2018     2019     2020     2021   2022   2025   2030     traditional combustion vehicles will be seen

15   Source: Wood Mackenzie, CRU
Stable production outlook for KGHM

      Production of electrolytic copper and metallic silver
      [Data for KGHM Polska Miedź S.A.]
                                                                                                                                                       Metallic silver
        800                                                                                                                                                        [t]      1 500
        600
                                                                                                                                                                            1 000
        400
                   Electrolytic copper                                                                                                                                      500
        200        [kt]

           0                                                                                                                                                                0
                 2000     2001   2002       2003   2004    2005    2006     2007   2008   2009   2010   2011   2012     2013    2014   2015     2016      2017     2018

      Forecast
       800
               mine production by the KGHM Group                                                                       Potential projects:
      [kt Cu in ore]                                                                                                   – Sierra Gorda Oxide
                                                     Robinson                                                          – Victoria
        600                                                                                                            – Ajax
                                                                         Sierra Gorda
        400
                                                                                     KGHM assets in Poland
        200

           0
            2018          2020            2022      2024          2026        2028        2030      2032        2034           2036      2038            2040            2042

16   Based on the most recent resources & reserves report, updated by current production results
Copper consumption by geographical region and industry sector
     2018-2030

       Copper consumption by geographical region                                      Copper consumption by industry sector
       [Mt]                                                                           [Mt]

                                                     36.1                                                                     36.1
                                                     4.3          +3.2%                                                        3.6              +1.3%
                        29.5                         2.4          +1.2%
                                                                                                      29.5
                                                                                                                               4.9              +3.2%
                          2.9                                                                          3.1
                                                     5.7          +0.7%
                          1.2                                                                          3.4
                                                                                                                               8.5              +1.5%
                          5.3
                                                     8.3          +3.2%                                7.1
                          5.7
                                                                                                                               8.8              +1.6%
                                                                                                       3.7

                         13.6                        15.5         +1.1%
                                                                                                       8.8                    10.3              +1.4%

                         2018                        2030                                             2018                    2030

                        China                  Asia excl. China                               Machinery industry       Transport
                        Europe                 USA                                            Electrical grid          Customer goods & other
                        Other              %   CAGR                                           Infrastructure       %   CAGR

17   Numbers may not sum up accurately due to rounding; Source: Wood Mackenzie, CRU
Mining production (1)
     Despite a clear increase in investment expenditures, analysts still anticipate a deficit in the market

       Many years of underinvestment will affect supply                                      In recent years, mining companies have developed less
       in the coming years                                                                   capital-intensive projects
       [kt]
       23 000                                                                       5.0
                                                                                    5,0%     185                                                                                     1.1%
                                                                                                                                                                                     1,10%

       22 000
                   3.7%                                                             4.0
                                                                                    4,0%
                                                                                             175                                                                                     1.0%
                                                                                                                                                                                     1,00%
       21 000                            3.0%
                                                             2.7%                   3.0
                                                                                    3,0%
       20 000                                      2.4%
                                                                                             165                                                                                     0.9%
                                                                                                                                                                                     0,90%
       19 000                                                                       2.0
                                                                                    2,0%
                                                                        1.1%
       18 000                                                                                155                                                                                     0.8%
                                                                                                                                                                                     0,80%
                             -0.6%                                                  1.0
                                                                                    1,0%
       17 000
                                                                                             145                                                                                     0,70%
                                                                                                                                                                                     0.7%
                   20 719

                              20 590

                                         21 203

                                                    21 714

                                                             22 305

                                                                         22 556
                                                                                    0.0
                                                                                    0,0%
       16 000

       15 000                                                                       -1.0
                                                                                     -1,0%   135                                                                                     0,60%
                                                                                                                                                                                     0.6%
                  2018       2019       2020       2021      2022      2022                        Aug-10       Feb-12         Aug-13            Mar-15       Aug-16        Mar-18

                  Mining production
                 Produkcja           (conc.=SX/EW)
                           górnicza (konc. + SX/EW)(lhs)
                                                    (l.oś)      Changerdr
                                                               zmiana  yoy(p.oś)
                                                                            (rhs)                     Averageproject
                                                                                                     Average  size ofsize
                                                                                                                      the Tier
                                                                                                                          project
                                                                                                                               1 (in(kt,
                                                                                                                                      kt lhs)
                                                                                                                                          Cu,…            The size of the project as a %
                                                                                                                                                          of global supply

18   Source: Macquarie, Wood Mackenzie, CRU International, ICSG, KGHM Polska Miedź           Source: CRU International, KGHM Polska Miedź
Mining production (2)
     Despite a clear increase in investment expenditures, analysts still anticipate a deficit in the market

       CRU anticipates a nearly 12.5% increase in costs this year                                        The increase in supply will remain limited, which will be
                                                                                                         affected by a slight increase in scrap use
                                                                                                         [mn t]

       3 000                                                                                                             A decrease in scrap consumption in 2018 (-1.2% = 60 kt)
                                                                                           +43
                                                                                    +125                  35                                                                                3.5%
                                                                                                                                                                                            3,5%
                                                                                                                                                      3.2%
       2 800                                                         +71 +6
                                                           +39 +21                                        30                         2.6%
                                                                                                                                                                                            3,0%
                                                                                                                                                                                            2.5%
                                                     +70
       2 600                                    +1                                                        25
                                                                              -62                                                                                                           2,5%
                                                                                                                  2.1%                                                                      2.0%
                                                                                                          20                                 1.7%
                                                                                                                            1.5%                                                            2,0%
       2 400                                                                                                                                                  1.4%
                                                                                                          15                                                                                1.5%
                                                                                                                                                                        1.4%
                                                                                                                                                                                  1.2%      1,5%
                                                                                                          10
       2 200                                                                                                                                                                                1.0%
                                                                                                                                                                                            1,0%
                2 968

                        2 500

                                2 511

                                        2 514

                                                                                                 2 827
                                                                                                           5

       2 000                                                                                               0                                                                                0.5%
                                                                                                                                                                                            0,5%
                                                                                                                  2016      2017    2018     2019    2020     2021      2022      2023

                                                                                                                 Scrapzłomu
                                                                                                               Zużycie consumption
                                                                                                                            (l. oś) (lhs)                World
                                                                                                                                                        Świat powith exception
                                                                                                                                                                wyłączeniu Chinof China (rhs)
                                                                                                                                                                                (p.oś)
                                                                                                                 China
                                                                                                               Chiny     (lhs)
                                                                                                                     (l.oś)                              Increase
                                                                                                                                                        Wzrost     in refined
                                                                                                                                                               produkcji      production
                                                                                                                                                                         rafinowanej (p.oś)(rhs)

19   Source: CRU International, KGHM Polska Miedź
Copper market balance
     The balance expected to turn into deficit in the medium term, with a potentially larger gap in 5-10 years

      Copper mining and potential mining projects                                                 Copper market balance
      [kt]
                         Możliwe
                          Possibleprojekty
                                   projects                Prawdopodobne   projekty
                                                            Base case production capability
                         Potwierdzona  produkcja
                          Highly probable  projects         Primary demand
                                                           Pierwotne zapotrzebowanie
                                                                                                   200
      40 000
                                                                                                   100
      30 000
                                                                                                     0
                                                                                         11 mn
      20 000                                                                             tonnes
                                                                                                   -100
      10 000                                                                                       -200

             0                                                                                     -300
                 2010   2013    2016    2019     2022   2025   2028   2031    2034                        2016   2017   2018   2019   2020   2021    2022    2023

                                                           Source: Wood Mackenzie                                                            Source: CRU International

            Although global copper resources are extensive, most of them are in difficult locations (with water or energy scarcity, political instability, social
             unrest against mining investment)
            Production from currently operating assets will decrease, with mine depletion and lower copper grades
            While the rate of growth in demand is slowing, it remains stable, which is expected to result in a potential supply-side gap
            Despite the fact that there are new projects in the development pipeline, most of them are merely related to the expansion and development of
             existing assets; this means that a number of new, greenfield projects would be needed to fill the supply gap

20
The deficit on the refined copper market is not always reflected in
     the metal price level…

        1 200                                                                                                                                                          10 000
                                       Market balance (lhs)                      Market balance forecasts (lhs)                     Copper price (rhs)
        1 000                                                                                                                                                          9 000

          800                                                                                                                                                          8 000

          600                                                                                                                                                          7 000

          400                                                                                                                                                          6 000

          200                                                                                                                                                          5 000

             0                                                                                                                                                         4 000
                  2003

                         2004

                                2005

                                       2006

                                              2007

                                                     2008

                                                            2009

                                                                   2010

                                                                          2011

                                                                                   2012

                                                                                          2013

                                                                                                 2014

                                                                                                        2015

                                                                                                               2016

                                                                                                                      2017

                                                                                                                             2018

                                                                                                                                    2019

                                                                                                                                           2020

                                                                                                                                                  2021

                                                                                                                                                         2022

                                                                                                                                                                2023
         -200                                                                                                                                                          3 000

         -400                                                                                                                                                          2 000

         -600                                                                                                                                                          1 000

         -800                                                                                                                                                          0
                  [kt]                                                                                                                                   [USD/t]

21   Source: KGHM Polska Miedź, market forecasts
…or in the red metal’s stocks level

         [kt]
                                      LME          COMEX          SHFE          Copper price [USD/t] (rhs)          [USD/t]

       1 000                                                                                                        12 000

         900
                                                                                                                    10 000
         800

         700
                                                                                                                    8 000
         600

         500                                                                                                        6 000

         400
                                                                                                                    4 000
         300

         200
                                                                                                                    2 000
         100

           0                                                                                                        0
            2010           2011           2012   2013      2014   2015   2016          2017         2018     2019

22   Source: Reuters, KGHM Polska Miedź
Production and financial results of the KGHM Group

5 years data
Key production data – 5 years
     KGHM Polska Miedź S.A.

      Ore extraction                 Production of copper                 Production of                        Metallic silver
      [mn t dry weight]              in concentrate                       electrolytic copper                  production
                                     [kt]                                 [kt]                                 [t]

                                                                                 577   574                                   1 283
                                                                                             536   522               1 256
                                            421   426   424   419                                        502                         1 191 1 218 1 189
          31.0 31.6 32.0 31.2 30.3                                  401

         2014 2015 2016 2017 2018       2014 2015 2016 2017 2018                 2014 2015 2016 2017 2018            2014 2015 2016 2017 2018

24
Key production data – 4 years (since production start)
     Sierra Gorda1)

          Payable copper production                                           Silver production
          [kt]                                                                [t]
                                                                                          7.7         14.1   14.0   14.5

                                          53.4         53.3                              2015         2016   2017   2018
                            51.5
                 46.3
                                                                              TPM2) production
                                                                              [koz t]
                                                                                                      22.9   74     23.2
                                                                                         12.8

                                                                                         2015         2016   2017   2018

                                                                              Molybdenum production
                                                                              [mn lbs]
                                                                                                             19.7
                                                                                         6.2          12.2          14.7

                 2015       2016         2017          2018
                                                                                         2015         2016   2017   2018

     1)     Pursuant to interest held (55%)
25   2)     TPM – Total Precious Metals, comprising gold, platinum and palladium
Key production data – 5 years
     KGHM International

      Payable copper production                 Silver production
      [kt]                                      [t]
                                                           1.9      1.6           1.6    1.6
                                                                           1.7

                                                           2014     2015   2016   2017   2018

                    98                          TPM production
             86            90                   [koz t]
                                  81     79                70.1     95.3
                                                                           92.1
                                                                                  74     67.7

                                                           2014     2015   2016   2017   2018

                                                Molybdenum production
                                                [mn lbs]
                                                                    1.0    0.8     0.7
                                                           0.7                           0.6

             2014   2015   2016   2017   2018
                                                           2014     2015   2016   2017   2018

26
Sales revenue and net profit – 5 years
     KGHM Group

         Revenues                                                                             Net profit
         [mn PLN]                                                                             [mn PLN]

               20 492        20 008                     20 358        20 526
                                           19 156

                                                                                                     2 451

                                                                                                                                                             1 658
                                                                                                                                               1 525
                                                                                                                           *             *
                                                                                                                   1 202         1 225

                2014          2015         2016          2017          2018                           2014         2015          2016          2017          2018

     *    Net profit of 2015 and 2016 excluding impact of impairment of non-current assets, loans and impairment recognised in the loss from the valuation
27        of joint ventures using the equity method
EBITDA and EBITDA margin – 5 years
     KGHM Group

          EBITDA by segments 1)                                                               EBITDA margin
          [mn PLN]                                                                            [%]

                     KGHM Polska Miedź S.A.           KGHM INTERNATIONAL                                                                         26
                     Sierra Gorda (55%)               Others                                            24
                                                                                                                     23            23
                                                                                                                                                                 22

                                                          5 753
                4 890         4 710                                    4 972
                                              4 666

                 2014          2015           2016        2017          2018                          2014          2015          2016          2017         2018

28   1)     Sum of segments; adjusted EBITDA = EBITDA (profit/(loss) on sales + depreciation/amortisation) adjusted by impairment losses on non-current assets
Net debt and net debt/EBITDA ratio – 5 years
     KGHM Group

      Net debt                                      Net debt/adjusted EBITDA
      [mn PLN]                                      [ratio]

                            7 262
                                            7 000
                    6 554           6 577

                                                                               1.6           1.6
            4 335                                                    1.4
                                                                                      1.3

                                                              0.9

            2014    2015    2016    2017    2018              2014   2015      2016   2017   2018

29
Basic items of the consolidated financial statements
     KGHM Group

          KGHM Group – consolidated data                                                             2014     2015     2016     2017     2018
          Sales revenue                                                                   [mn PLN]   20 492   20 008   19 156   20 358   20 526
          Profit/(loss) for the period                                                    [mn PLN]    2 451   -5 009   -4 449    1 525    1 658
          Total assets                                                                    [mn PLN]   40 374   36 764   33 442   34 122   37 237
          Liabilities and provisions                                                      [mn PLN]   14 844   16 350   17 531   16 337   18 012
                                       1)
          Earnings per share (EPS)                                                        [PLN]       12.25   -25.06   -21.86     7.84     8.29
          Share price of the Company 2)                                                   [PLN]      108.85    63.49    92.48   111.20    88.88
                            3)
          Net debt/EBITDA                                                                              0.90     1.40     160      1.30     1.60
          Payable copper production 4)                                                    [kt]         663      718      677      656      634
                                        4)
          Payable silver production                                                       [t]         1 258    1 299    1 207    1 234    1 205
          Concentrate production cost C1 4)                                               [USD/lb]     1.89     1.59     1.41     1.59     1.81
          Cash expenditures on property, plant and equipment & intangible assets          [mn PLN]    3 434    3 939    3 251    2 796    2 875

     1)    Attributable to shareholders of the Parent Entity
     2)    At the end of the period
     3)    Adjusted EBITDA for the year, excluding EBITDA of the joint venture Sierra Gorda S.C.M.
30   4)    Comprises Sierra Gorda S.C.M. pursuant to interest held (55%)
Production and financial results of the KGHM Group

9M 2019
Summation of the first 3 quarters of 2019 in the KGHM Group
     Main events and factors affecting the results of the Group1)

     Macroeconomic environment                                 Production and C1 cost                   Financial results

              -9%                                                    +14%
              Lower copper price                                     Higher copper production
                                                                                                              +14%
                                                                                                              Higher revenues:
                                                                                                              PLN 16 869 million
              -1.7%                                                  +22%
                                                                                                              +8%
              Lower silver price                                     Higher silver and TPM production

              +7.6%                                                  -7%                                      Higher EBITDA:
                                                                                                              PLN 4 112 million
              Stronger USD vs the PLN                                Lower C1 cost

32   1)   Compared to the results of the first nine months of 2018
Metals production
     KGHM Group

                                         Payable copper production                      Silver production
      Production of electrolytic        [kt]
                                                                                        [t]
                                                                                                             +22%
                                                                                                                     1 031
       copper exceeded the target set                                                                848
                                                          +14%
       for KGHM Polska Miedź S.A.                                        530
       due to improved availability of
                                                 465
       production equipment                                                       44
                                                                                                   9M 2018          9M 2019
                                                            38                    58
      Lower production by KGHM                                                         TPM production
                                                            61
       INTERNATIONAL due to lower                                                       [koz t]
       production by the Sudbury                                                                     129
                                                                                                             +22%    157

       Basin, Franke and the
       Robinson mine                                                              428
                                                            366
      Higher payable copper
                                                                                                   9M 2018          9M 2019
       production by the Sierra Gorda
                                                                                        Molybdenum production
       mine thanks to higher                                                            [mn lbs]
       extraction and ore processing            9M 2018                 9M 2019                      11      –21%
                                                                                                                       9
       as well as the processing of
       better quality ore than in the              Sierra Gorda (55%)
                                                   KGHM INTERNATIONAL
       first nine months of 2018                                                                   9M 2018          9M 2019
                                                   KGHM Polska Miedź S.A.

33
Production and sales in the first 3 quarters of 2019
     Execution of annual targets
                                                                                                                                                              2019E
                                                                                                                                                             Budget

     Production                                        Copper in concentrate [kt]                              305                                                397
     KGHM Polska Miedź S.A.                               Silver in concentrate [t]                            952                                                1 238
                                     Electrolytic copper from own concentrate [kt]                             313                                                406
                               Electrolytic copper from purchased materials [kt]                              115                                                 153
                                                                 Metallic silver [t]                          1018                                                1 341

                                                                                       0%   10%   20%   30%        40%       50%   60%   70%   80%   90%   100%

     Sales                                                    Payable copper [kt]                             415                                                 601
     KGHM Polska Miedź S.A.                                      Payable silver [t]                           1029                                                1 454

                                                                                       0%   10%   20%   30%        40%       50%   60%   70%   80%   90%   100%

     Production                                               Payable copper [kt]                              58                                                 75
     KGHM INTERNATIONAL                                                TPM [koz t]                            63                                                  88

                                                                                       0%   10%   20%   30%        40%       50%   60%   70%   80%   90%   100%

     Production                                               Payable copper [kt]                                  45                                             57
     Sierra Gorda (on a 55% basis)                          Molybdenum [mn lbs]                                          9                                        11

                                                                                       0%   10%   20%   30%        40%       50%   60%   70%   80%   90%   100%
34
Production results
     KGHM Polska Miedź S.A.

     Ore extraction                                                 Production of copper                                      Electrolytic copper                                       Metallic silver
     [mn t dry weight]                                              in concentrate [kt]                                       production [kt]                                           production [t]

                          –0.6% 9M/9M                                                   –0.4% 9M/9M                                             +17% 9M/9M                                               +22% 9M/9M
               23.0                     22.8                                    306                   305                                                     428
                                                                                                                                          366
                                                                                                                                                                          From                                        1 018
                                                                                                                                                                          purchased
                                                     Silver                                                                                                   115         metal-bearing          836
                                                                                                                                                                          materials
                                                     grade                                                                                85
                   48.7                 48.7         in ore [g/t]

                                                     Copper
                                                                                22.9                  22.7
                                                                                                                  Copper content
                                                                                                                                          282                 313
                                                     grade                                                        in concentrate                                          From own
              1.503                  1.507           in ore [%]                                                   [%]                                                     concentrate

             9M 2018                9M 2019                                9M 2018               9M 2019                             9M 2018              9M 2019                              9M 2018            9M 2019

             7.7      7.3     7.6    7.5       7.7                                                                                                           145    141                       358                 384
                                                                                                                                    139     135     142                                              353
                                                                                                            105                                                                                             321           313
                                                                          101      95      99    101
                                                                                                                                     28        32   38       42     35

            Q3'18 Q4'18 Q1'19 Q2'19 Q3'19                                Q3'18 Q4'18 Q1'19 Q2'19 Q3'19                              Q3'18 Q4'18 Q1'19 Q2'19 Q3'19                            Q3'18 Q4'18 Q1'19 Q2'19 Q3'19

         Ore extraction results from                                  Slightly lower production due                             Higher production due to higher                         Higher production due to
          areas selected for mining                                     to lower extraction                                        concentrate processing thanks to the                     better availability of charge
                                                                                                                                   work of the copper concentrate                           materials thanks to higher
                                                                                                                                   roasting installation                                    processing of concentrate

35
Change in inventories
     KGHM Polska Miedź S.A.

     Inventories of copper in concentrate at the smelters
     amount of Cu [t]
                                                                                                   –13% Q3/Q2

                                                                               36 606
                                                                                         34 248                 29 946
        A further decrease in the level of inventories due to the better
         availability of equipment and the proper functioning of the copper
         concentrate roasting installation
        In subsequent quarters, concentrate inventories will decrease
         according to plan                                                     Q1 2019   Q2 2019                Q3 2019

     Inventories of copper anodes at the smelters
     amount of Cu [t]                                                                              -7% Q3/Q2
                                                                               32 396
                                                                                         26 849                 24 915
        The decrease in copper anodes inventories resulted from the adopted
         production plan and from higher electrolytic copper production

                                                                               Q1 2019   Q2 2019                Q3 2019

36
Production results
     Sierra Gorda1)

      Payable copper production                                                     Silver production
      [kt]                                                                          [t]                               +5% 9M/9M

                                               +16%   9M/9M
                                                                                                                   10.4      10.9
                                                                                                4.1       3.8                          Higher extraction
                                                          44
                                             38                                                                                         by the Sierra Gorda
                                                                                              Q3 2018   Q3 2019   9M 2018   9M 2019     mine led to higher
                                                                                                                                        copper, silver and
                 14            15                                                   TPM Production 2)                                   gold production
                                                                                    [koz t]                           +44% 9M/9M
                                                                                                                                       The drop in
                                                                                                                   15.8
                                                                                                                              22.8      molybdenum
                                                                                                6.5       8.3
              Q3 2018       Q3 2019      9M 2018       9M 2019                                                                          production was due to
                                                                                                                                        extraction in areas
                                                                                              Q3 2018   Q3 2019   9M 2018   9M 2019
          Higher-than-planned copper production in the                                                                                  with lower
          first three quarters of 2019                                              Molybdenum production                               molybdenum content
                                                                                    [mn lbs]                          –23% 9M/9M        compared to ore
       Higher payable copper production due to higher
                                                                                                                                        extracted in prior
        extraction and ore processing                                                                              10.7       8.2
                                                                                                3.1       2.6
                                                                                                                                        years
       In the first 9 months of 2019 ore with a higher
        copper content was extracted compared to the
        first 9 months of 2018                                                                Q3 2018   Q3 2019   9M 2018   9M 2019

37   1)      On a 55% basis
     2)      TPM – Total Precious Metals, comprising gold, platinum and palladium
Production results
     KGHM INTERNATIONAL

     Payable copper production                       Silver production
                                                                                       +52% 9M/9M
     [kt]                                            [t]                                                  The silver production
                                                                                                  1.74     target was exceeded in
                                                                                     1.14
                                       -5% 9M/9M                 0.44      0.61                            the Sudbury Basin due to
                                                                                                           a change in the region
                                  61                                                                       being mined (different
                                              58
                                                               Q3 2018    Q3 2019   9M 2018    9M 2019
                                                                                                           nature of the deposit in
                                                                                                           the McCreedy mine)
                                                     TPM production                    +23% 9M/9M
                                                     [koz t]                                              Higher TPM production
                        22                                                                                 both in the Sudbury
              18                                                                     51.2        62.9
                                                                 16.7      24.0                            Basin and the Robinson
                                                                                                           mine
                                                               Q3 2018    Q3 2019   9M 2018    9M 2019
                                                                                                          Higher molybdenum
            Q3 2018   Q3 2019   9M 2018    9M 2019
                                                                                                           production by the
                                                     Molybdenum production                                 Robinson mine due to
                                                     [mn lbs]                          +43%   9M/9M
      The decrease in production in the current                                                  0.59     a substantial increase
       period was due to a temporary drop in mined                                   0.41
                                                                                                           in the recovery of this
                                                                 0.223
       copper ore grade at the Robinson mine and                           0.097                           metal thanks to an
       to a change in the area being mined in the                                                          improvement in the
       Sudbury Basin                                            Q3 2018   Q3 2019   9M 2018    9M 2019     production process

38
Sales revenue
     KGHM Group

      Revenues from contracts with customers                                                Revenues from contracts with customers
      [mn PLN]                                                                              [mn PLN]
                                                  +14%   9M/9M
                                                                                                                                16 869
                         +1 397                            +1 073       +427    16 869
           14 787                                                                                      14 787                                  1 508

                                           -815                                                                     1 423                      2 311

                                                                                                                    2 047

          Revenues    Change in sales Change in prices    Change in     Other   Revenues
                                                                                                                                              13 050
          9M 2018    volumes of basic of basic products   USD/PLN               9M 2019
                                                                                                                    11 317
                         products                       exchange rate

       Higher revenues by PLN 2 082 million (+14%) compared to the corresponding period               9M 2018                  9M 2019

        of 2018, including higher revenues in KGHM Polska Miedź S.A. (+PLN 1 733 million)
       The higher revenues of KGHM Polska Miedź S.A. were mainly due to higher sales           KGHM INTERNATIONAL           Other segments and

        volumes of copper (+13%) and silver (+18%) and to a more favourable exchange rate       KGHM Polska Miedź S.A.
                                                                                                                             consolidation adjustments

        alongside lower copper and silver prices

39
Sales revenue
     KGHM Polska Miedź S.A.
                                                              Higher revenues from sales by PLN 1 733 million (+15%) in the first 9M of 2019
      Sales revenue                                           compared to the first 9M of 2018 due to:
      [mn PLN]
                                                                 higher sales volumes (copper by 13% and silver by 18%)
                             +15% 9M/9M                          a more favourable USD/PLN exchange rate (+8%)
                                          13 050
                   11 317                                     alongside less favourable prices of copper (-9%) and silver (-2%)
                                                     1 000
         Other                  864                  2 004
          Silver                1 613                           Sales of copper                                   Silver sales
                                                                and copper products                               [t]
                                                                [kt]
                                8 840
                                                     10 046                            +13% 9M/9M                                       +18% 9M/9M
     Copper and
                                                                                                    415                                           1 029
         copper
                                                               of which:        367                              of which:
                                                                                                                                  869
       products
                                                               - concentrate             18                      - concentrate              67
                   9M 2018                9M 2019             - wire rod and
                                                              OFE rod                     198             202

                                                                               9M 2018          9M 2019                          9M 2018         9M 2019
                    4 440       4 316       4 515    4 219
         4 128

                                                                         137     148      135       145   135            383      359             380
                                                                                                                                           325             323

       Q3 2018     Q4 2018     Q1 2019    Q2 2019   Q3 2019            Q3 2018 Q4 2018 Q1 2019 Q2 2019 Q3 2019          Q3 2018 Q4 2018 Q1 2019 Q2 2019 Q2 2019

40
Stable and safe financial situation of the KGHM Group
                                                                                                                                                                      2019E
                                                                                                                                                                      Budget

     Total unit production cost
     Of electrolytic copper from own concentrate
     KGHM Polska Miedź S.A.1)                                                                                                                                         ≤20.0
     [k PLN/t]
                                                                                                                                                      18.2

      Investments
      KGHM Polska Miedź S.A.2)
                                                               Capital expenditures                     1 556                                                         2 516
      [mn PLN]                                                  Equity investments         210                                                                        1 074
                                                                                      0%   10%   20%     30%    40%     50%     60%     70%     80%     90%    100%

      Financial leverage of the KGHM Group
                                                                                                                                                                              3)
      [Net debt / adjusted EBIDTA]
                                                                                                                                                                      ≤ ×2
                                                                                                                                                      x1.8

     1)   Sum of costs of extraction, floatation and metallurgical processing per cathode, together with support functions and cathode selling costs, adjusted by the value of inventories
          of half-finished products and work in progress, less the value of anode slimes and divided by the volume of electrolytic copper production from own concentrates
     2)   Capital expenditures – excluding Development work – uncompleted; Equity investments – Loans granted and acquisition of shares and investment certificates of subsidiaries
          together with loans for these subsidiaries
41   3)   Level of net debt/EBITDA ≤ 2 related to the Financial Liquidity Policy adopted by the Company and is not part of the budget assumptions of KGHM for 2019
C1 unit cost1)
     KGHM Group

                                                                   C1 – KGHM Polska Miedź S.A.
          C1 – Group                                               [USD/lb]
                                                                                                                                      The decrease in C1 cost in KGHM
          [USD/lb]                                                                                                                     Polska Miedź S.A. versus the
                                                                                  1.87      -8% 9M/9M     1.71     including

                                                                                  0.55
                                                                                                                   the minerals
                                                                                                                   extraction          corresponding period of 2018 was
                                                                                                          0.48     tax

                            -7% 9M/9M                                                                                                  mainly due to a weakening of the
                                                                                  1.32                    1.23
                                                                                                                                       PLN vs the USD by 8%
                                                                               9M 2018                  9M 2019
                     1.81                                                                                                             The 4% decrease in this cost in
                                        1.69
                                                                   C1 – KGHM INTERNATIONAL                                             KGHM INTERNATIONAL was due
                                                  including
                     0.43                         the minerals     [USD/lb]                                                            among others to higher revenues
                                        0.37      extraction                                -4% 9M/9M
                                                  tax                            1.87                    1.79                          from the sale of associated metals
                                                                                                                                       (which decrease this cost)

                                                                               9M 2018                  9M 2019                       The 15% increase in C1 cost in Sierra
                     1.38               1.32                                                                                           Gorda was due to a lower volume of
                                                                  C1 – Sierra Gorda
                                                                                                                                       sales of molybdenum (lower Mo
                                                                  [USD/lb]
                                                                                           +15% 9M/9M                                  grade in ore), and consequently
                                                                                 1.21                    1.39                          lower by-product credit revenues
                                                                                                                                       which are deducted when
                9M 2018             9M 2019                                                                                            calculating C1 cost
                                                                               9M 2018                  9M 2019

     1)     C1 cost - cash cost of concentrate production reflecting the minerals extraction tax, plus administrative expenses and smelter treatment and refining
42          charges (TC/RC), less depreciation/amortisation and the value of by-product premiums, calculated for payable copper in concentrate
Expenses by nature
      KGHM Polska Miedź S.A.

                                                                                         Expenses by nature were higher by PLN 1 025 million (10%) mainly due
         Expenses by nature                                                               to higher consumption of purchased metal-bearing materials by PLN 710
         [mn PLN]                                            +10% 9M/9M                   million (a higher volume of purchased metal-bearing materials used by
                                          11 125                                          30 thousand tonnes of copper alongside a similar purchase price)
                                                            Minerals extraction tax
                        10 100                              recognised in expenses       Expenses by nature, excluding purchased metal-bearing materials and
                                                    1 192
                                                            by nature
                                                                                          the minerals extraction tax, were higher by PLN 420 million (6%) mainly
                                  1 297
                                                                                          due to higher labour costs (+PLN 139 million ), costs of other materials
                                                            Purchased metal-
                                                    2 888
                                                            bearing materials
                                                                                          and energy due to higher production (+PLN 105 million), depreciation/
                                  2 178
                                          7 045                                           amortisation (+PLN 95 million ) and external services (+PLN 87 million)
         Other taxes,   6 625                       375       +6% 9M/9M
     charges & costs              381
        Depreciation                                963
       /amortisation
                                  868
                                                    1 281                                               3 533      3 677      3 756      3 692     Minerals extraction
            External              1 194
                                                            Expenses by nature
                                                                                             3 337                                                 tax recognised in
            services                                                                                                                               expenses by nature
                                                            excluding purchased
                                                    1 768   metal-bearing materials                                                                Purchased metal-
     Other materials              1 663                                                                                                            bearing materials
                                                            and the minerals
         and energy
                                                            extraction tax
                                                                                                                                                   Expenses by nature
                                                                                                                                                   excluding purchased

                                  2 519             2 658                                    2 239                                       2 466     metal-bearing
                                                                                                                                                   materials and
                                                                                                                                                   the minerals
      Labour costs
                                                                                                                                                   extraction tax

                        9M 2018           9M 2019                                           Q3 2018    Q4 2018    Q1 2019    Q2 2019     Q3 2019

43
Operating results
     KGHM Group

          Change in adjusted EBITDA                                                                                           Adjusted EBITDA
                                                                                                                              [mn PLN]
          [mn PLN]
                                                          +8% 9M/9M

                                  +280                               +38               +17              4 112                                               4 112
                3 790
                                                                                                                                     3 790
                                                                                                                                                                            207
                                                    -13
                                                                                                                                                    190                     522
                                                                                                                                                    484
                                                                                                                                                                            515
                                                                                                                                                    528

                                                                                                                                                                            2 868
              9M 2018            KGHM             KGHM              Sierra            Other            9M 2019                                     2 588
                            Polska Miedź S.A. INTERNATIONAL         Gorda

      The increase in EBITDA of the Group 1) (+PLN 322 million) was mainly                                                         9M 2018                9M 2019
       due to increases in KGHM Polska Miedź S.A. (+PLN 280 million; +11%
                                                                                                                                  KGHM INTERNATIONAL       Other segments
       9M/9M) and Sierra Gorda (+PLN 38 million; +8% 9M/9M)                                                                       KGHM Polska Miedź S.A.   Sierra Gorda (55%)

44   1)     Sum of segments; adjusted EBITDA = EBITDA (profit/(loss) on sales + depreciation/amortisation) adjusted by impairment losses on non-current assets
Financial results
     KGHM Group

      Profit for the period
      [mn PLN]                                              1 666 mn PLN                           consolidated net profit in the first 9M of 2019
                                                             The increase in net profit by the Group by PLN 690 million (+71%) was mainly due to:
      + 71% 9M/9M
                                                               an improvement in the operating result
                     +2 082                                    a higher result on involvement in joint ventures
                                                               a more favourable FX effect
                                                               a lower cost from the recognition/release of provisions in other operating costs

                                                                                                                 +168                                1 666
                                                                                                  +253                                    +30
                                                                                    +152
                                     -1 227                               +5
          976                                                                                                                  -142

                                                        -631

                        Improvement in the operating result by PLN 229 million

        Profit for   Change in       Change in        Change in         Other        Result on    Exchange     Recognition/   Change in   Other      Profit for
        9M 2018      revenues        expenses        inventories,      operating   involvement   differences    release of       CIT                 9M 2019
                                     by nature          work in          costs        in joint                  provisions
                                                       progress                      ventures

45
EBITDA and profit for the period
     KGHM Polska Miedź S.A.

      Higher standalone                   Adjusted EBITDA                                     Profit for the period
      EBITDA and profit for               [mn PLN]                                            [mn PLN]

                                                             +11% 9M/9M                                          +16% 9M/9M
      the period
                                                                             2 868
                                                     2 588
      EBITDA higher by 11% than in
       the first 9 months of 2018 due                                                                                          1 663
                                                                                                       1 430
       to a higher volume of copper
       sold (higher revenues)
      Higher profit for the period by
       PLN 233 million (+16%) than in              9M 2018                 9M 2019                     9M 2018                9M 2019
       the first 9 months of 2018 due
                                                                                                                    695
       to higher EBITDA, a more              888                 999       920       949         443
                                                                                                           595                532
                                                                                                                                        436
                                                       828
       favourable result on exchange
       differences and a lower level of
       provisions recognised               Q3 2018    Q4 2018   Q1 2019   Q2 2019   Q3 2019    Q3 2018   Q4 2018   Q1 2019   Q2 2019   Q3 2019

46
Cash flow
     KGHM Group

     [mn PLN]

                                                            +511
                        +2 424

                                                                                                                +2 000

                                            -444

        957
                                                                                                                                                                            748
                                                                            -2 314
                                                                                               -172                               -2 028
                                                                                                                                                    -117         -69

       Cash as at   Profit/loss before     Change in       Other net      Acquisition of    Acquisition of     Proceeds from    Proceeds from    Interest paid   Other    Cash as at
       1 Jan 2019      income tax        working capital   cash from     property, plant   shares in a joint     the issue of   /repayments of     and other             30 Sept 2019
                                                           operating     and equipment         venture -            debt          borrowings        costs of
                                                            activities   and intangible      financing of       instruments                       borrowings
                                                                             assets         Sierra Gorda

47
Net debt of the KGHM Group
     As at the end of Q3 2019

     Net debt / adjusted EBITDA 1)                                                                                     Main factors affecting interest-bearing debt in the first
                                                                                                                       9 months of 2019
                      1.6                                1.6                               1.7                         (Increases in debt)

                                                                                                                              Cash expenditures on property, plant and equipment (PLN 2 314 million)
                                                                                                                              The minerals extraction tax (PLN 1 187 million)
                                                                                                                              Negative exchange differences (an increase in debt by PLN 480 million)
                    9M 2018                        12M 2018                           9M 2019
                                                                                                                              Change in trade and other receivables (an increase by PLN 397 million)
                                                                                                                              The financing of inventories (an increase by PLN 261 million)
     KGHM Group net debt 2)                                                                                                   Equity increase for Sierra Gorda (PLN 169 million)
     [mn USD]                                                  [mn PLN]                                                       Change in trade and other liabilities (an increase by PLN 133 million)
                                                                                                                              Borrowing costs (PLN 106 million)
          2 024     1 862    1 971     1 939     1 945                                        7 238      7 781
                                                                 7 439     7 000   7 563                               (Decreases in debt)

                                                                                                                              Positive cash flow from operating activities, excluding the change in working capital
                                                                                                                               and the minerals extraction tax (PLN 4 470 million)

          9M'18     12M'18   3M'19     6M'19     9M'19          9M'18     12M'18   3M'19      6M'19      9M'19         In accordance with the adopted financing strategy of KGHM Polska Miedź S.A., the basic currency in
                                                                                                                       which debt is incurred is the USD (natural hedging)

     Change in net debt
     [mn PLN]
                                                                     +11                     +480                +75                         7 781                     +626                        8 407
                   7 000                  +215

                  12M 2018               Impact of                 Net change              Exchange              Other                   9M 2019                  Implementation                 9M 2019
                                     change in cash on           in borrowings             differences                              excluding the impact            of IFRS 16             including the impact
                                          net debt                                                                                       of IFRS 16                                             of IFRS 16

     1)    Excludes the impact of IFRS 16 with respect to leasing. Taking into account the impact of IFRS 16, the ratio as at 30.09.2019 would amount to 1.8.
48   2)    The presented data do not reflect the impact of IFRS 16 with respect to leasing. Taking into account the impact of IFRS 16, net debt as at 30.09.2019 would amount to
           PLN 8 407 million.
Debut of bonds on the Catalyst market
     3rd October 2019

          Highlights of the Catalyst debut                                               Quotations of KGHM’s bonds on the Catalyst market2)
          and bond quotations
                                                                                                                           Total daily turnover [k PLN] (right-hand axis)
           Total value of issue series A and B - PLN 2 billion                                                            Series A bond quotations (left-hand axis)
           144 issuers on the Catalyst market                                              101.5
                                                                                            101,5                          Series B bond quotations (left-hand axis)
           6th debut in 2019                                                                                                                                                        14 000

           Designated market maker to ensure liquidity                                     101.3
                                                                                            101,3
                                                                                                                                                                                     12 000
           During the period 3-31 October turnover on
                                                                                            101.0
                                                                                            101,0                                                                                    10 000
            KGHM’s bonds accounted for 22% of total
            corporate bonds turnover on the Catalyst1) market                               100.8
                                                                                            100,8
                                                                                                                                                                                     8 000
           Average daily turnover in both bonds series during                                                                                                                       6 000
            the period 3-31 October amounted to PLN 1 486                                   100.5
                                                                                            100,5
                                                                                                                                                                                     4 000
            thousand
                                                                                            100.3
                                                                                            100,3
           To date, the highest total daily turnover in both                                                                                                                        2 000
            bonds series occurred on 10 October and
                                                                                            100.0
                                                                                            100,0                                                                                    0
            amounted to PLN 4 622 thousand                                                          3-Oct    7-Oct    11-Oct       15-Oct    19-Oct     23-Oct    27-Oct    31-Oct

49   1)       For trading sessions in all segments (GPW RR, GPW ASO, BS RR, BS ASO)
     2)       Closing prices are shown. The chart shows the daily market „clean” price (i.e. excluding accrued interest)
Diversification of borrowing sources
     Financing structure based on long-term instruments

      Sources of financing prior to the bond issue                                             Sources of financing following the bond issue
      [mn PLN] 1)                                                                              [mn PLN] 2)

                         100%
                                                                                                                        24%
                                                          Kredyty i pożyczki
                                                          Borrowings                                                                    Kredyty i pożyczki
                                                                                                                                         Borrowings
                                        0%                bankowe                                                                       bankowe
                                                          Obligacje
                                                          Bonds                                                                         Obligacje
                                                                                                                                         Bonds

                                                                                                                  76%

      As a result of changes carried out in the first half of 2019 involving the financing structure (the initiation of a new, 7-year loan in
      the amount of USD 450 million and the issuance of 5-year and 10-year bonds in the amount of PLN 2 000 million), the average
      weighted maturity period was extended by 2 years.

      With respect to managing currency risk which may arise from borrowings, the Company uses natural hedging by borrowing in
      currencies in which it has revenues.
      The Company entered into transactions forming an element of a strategy based on CIRS, or Cross Currency Interest Rate Swaps,
      aimed at securing against the currency and interest rate risk arising from the issuance of bonds.

50   1)   Balance drawn as at 31-12-2018 for the KGHM Polska Miedź S.A. Group; debt towards financial institutions (excl. leasing)
     2)   Balance drawn as at 30-06-2019 for the KGHM Polska Miedź S.A. Group; debt towards financial institutions (excl. leasing)
Advancement of the KGHM Group’s strategy
4 strategic
     Pokłady     directions for KGHM’s development
              możliwości
     The review of the Strategy of KGHM Polska Miedź S.A. for 2019-2013

            #        4E
                                                          ELASTICITY,          EFFICIENCY
                                                            FLEXIBILITY

                                                          ECOLOGY,
                                                      SAFETY AND SUSTAINABLE   E-INDUSTRY
                                                           DEVELOPMENT

52
Strategicmożliwości
     Pokłady  priorities

      #1 Higher         #2   Energy          #3   International
                                                  assets 2.0
                                                                  #4   Long-term
         production          independence                              financial
                                                                       strategy

      #5   Ecosystem    #6   Technologies    #7   New quality
           innovation        of the future        Safety and
           for KGHM                               development

53
Strategy możliwości
     Pokłady  in practice
     Selected key operating initiatives (1)

                AREA         MAIN TARGET                                       SELECTED EFFECTIVENESS MEASURES

                              Maintenance of
                               cost-effective
                            domestic and foreign
                                production             Level of production in Poland of            Average yearly               Yearly average of daily ore
                                                      mined Cu in ore with an annual C1      metallurgical production in        processing in Sierra Gorda
                                                      cost not higher than 3,800 USD/t in      the years 2019-2023                      from 2020
                                                             the years 2019-2023

                             Increased efficiency
                             and flexibility of the
                               KGHM Group in
                             managing its Polish             Level of metallurgical          An increase in the share of       Amount by which the needs of
                              and international                production from                 highly processed copper             KGHM Polska Miedź for
                                    assets                        purchased                    products in the Group’s              electricity from its own
                                                          copper-bearing materials,         total sales by the end of 2030      sources of energy generation
                                                           including scrap, to 2030                                           and renewable energy sources
                                                                                                                             will be satisfied by the end of 2030

54
Strategy możliwości
     Pokłady  in practice
     Selected key operating initiatives (2)

                AREA         MAIN TARGET                                  SELECTED EFFECTIVENESS MEASURES

                            Increase the efficiency
                             of the KGHM Group
                              through innovation        Increase expenditures on        Ensure that all of the innovation     Level of funds for R&D and
                                                        innovation and R&D work      projects are realised, pursuant to the     innovation in the years
                                                       to the level of 1% of KGHM        rules of a coherent model of           2019-2023 to meet the
                                                           Polska Miedź S.A.’s      innovation management and research        challenges faced by KGHM
                                                            revenues by 2023          and development work (R&D) in the        Polska Miedź S.A. in the
                                                                                     KGHM Group, in the years 2019-2023              Core Business

                               Ensure long-term
                             financial stability and
                              the development of
                                 mechanisms              Basing of the Group’s                  Shorter cash                      Efficient management
                                  supporting            financing on long-term                conversion cycle                     of market and credit
                                                             instruments                                                        risk by the KGHM Group
                             further development

55
Strategy możliwości
     Pokłady  in practice
     Selected key operating initiatives (3)

                AREA         MAIN TARGET                                    SELECTED EFFECTIVENESS MEASURES

                                Implementation
                             of systemic solutions
                              aimed at increasing     Ensure financial stability of     Increase in the efficiency of   Minimum level of achievement
                              the KGHM Group’s         the Polish-based Group          support functions as a result    of key strategic targets and of
                                     value            companies, on the basis of           of centralisation and         the yearly goals assigned to
                                                         their own activities               digitalisation of key       them, in each of the years the
                                                                                       back-office processes by 2023          strategy is in force

                             Growth based on the
                              idea of sustainable
                               development and
                                safety as well as
                                 enhancing the          Minimum level of annual           Maintain a participation        Level of commitment and
                               Group’s image of      improvement of LTIFR (Polish       budget at the level of 20% of      satisfaction of the KGHM
                             social responsibility   assets) and TRiR (International   the amount of deductions for      Group’s employees based on
                                                                 assets)                donations from the minerals       measures defined during
                                                                                           extraction tax by 2020          implementation, by 2023

56
Consistent advancement of the strategy
     Key areas – 4E

                                                              Rational management of the Company’s resources
                         Adaptation of the operating          Optimisation of metallurgical production
      Elasticity/
                         model for the KGHM Group             Exploration projects in Poland
      Flexibility
                         to market conditions                 Optimisation of the international assets portfolio
                                                              Optimisation of the financing structure

                              Improved efficiency                   Programs to reduce energy consumption
           Efficiency                                               Replacement and availability of mining machinery
                              in the use of resources               Innovative solutions to optimise production processes; CuBR program
                              and production processes              Work on increasing the use of factoring

                                                                        Compliance with BAT conclusions
                                    Integration of the KGHM Group       Program to Improve Occupational Health and Safety
                    Ecology
                                    around the idea of sustainable      Circular economy – Closed-Circuit Industry Program
                                    development                         Development of the Żelazny Most Tailings Storage Facility
                                                                        Electromobility

                                       Transformation of                     Work on projects comprising the KGHM 4.0 Program
                       E-Industry
                                       technology under the                  Advancement of projects related to automation of the production line
                                       KGHM 4.0 Program                        in the mining and metallurgical divisions

57
A consistent and rational investment program
     Capital expenditures by KGHM Polska Miedź S.A. in the first three quarters of 2019

     Main projects financed in the first 3 quarters of 2019
                                                                                                  2 516                  mn PLN         1 611                  mn PLN
     Deposit Access Program                                                                       CAPEX budget targets for 2019         CAPEX execution, 9M 2019
      Individual projects in the categories of maintaining mine production and development

                                                                                                                                        1 232
       with respect to mining, mine shafts, air conditioning and power-related infrastructure
       projects, are being systematically advanced.                                               2 670         mn PLN                                mn PLN

     Copper concentrate roasting installation                                                     CAPEX budget targets for 2018         CAPEX execution, 9M 2018
      The installation was successfully commissioned and brought on-line at the Głogów
       Copper Smelter and Refinery. Work is underway to optimise the investment and
       conclude commissioning procedures.                                                         by area                               by category
     RCR furnace at the Legnica Copper Smelter and Refinery                                            Mining (75%)                          Replacement (30%)
                                                                                                       Metallurgy (21%)                      Maintaining mine production (31%)
      The installation was successfully commissioned and brought on-line at the Legnica
       Copper Smelter and Refinery. Work is underway to optimise the copper scrap                      Other activities (1%)                 Mine development (36%)
       processing technology, being one of the Company’s most important goals.                         Leasing IFRS 16                       Leasing IFRS 16
                                                                                                       Development work - uncompleted        Development work - uncompleted
     Development of the Żelazny Most Tailings Storage Facility
      Individual phases of the work to build the facility’s southern quarter is advancing
       according to plan. Work is also underway on constructing the tailings segregation and                         1203                                 483
       thickening station.
                                                                                                  4                                     4
     Program to adapt the technological installations of KGHM to the requirements
     of BAT Conclusions                                                                           51              [mn PLN]              51               [mn PLN]      497
      Under this Program, projects are being advanced at the Głogów and Legnica Copper
       Smelters/Refineries. In 2019 work was completed on sealing the conveyor belts and          21
       belt pulling stations at the Głogów facility. Nearing completion are the construction of               332
       an off-gas desulphurisation instalation for the Kaldo furnace at the Głogów facility and                                                        576
       modernisation of the dedusting unit for the shaft furnaces at the Legnica facility.

58
Additional slides
Transparent Group structure

                                                                General Shareholders Meeting

                 Supervisory Board
                                                                       Management Board
                                                                     KGHM Polska Miedź S.A.
                                                                             (Lubin, Poland)
                                                                 (Listed on Warsaw Stock Exchange since 1997)

               KGHM International Ltd.
                                                            Production                         Development             Group of subsidiaries
                (Vancouver, Canada)
                                 Development
                                                             divisions                           projects
            Operations                                                                                                    Role in KGHM Group
                                   projects

         Robinson Mine       Victoria (Ontario)      Lubin Mine                         Deep Głogów               Core-Services
          (Nevada)            Ajax (BC)               Polkowice-Sieroszowice Mine        Exploration Projects      Multi Utilities
         Carlota Mine        Exploration             Rudna Mine                                                    Knowledge (R&D)
          (Arizona)            Projects                                                                               CSR
                                                       Concentrators Division
         Morrison Mine       Sierra Gorda                                                                           Non-core
          (Ontario)            Oxide                   Głogów I Smelter/Refinery
         Sierra Gorda                                 Głogów II Smelter/Refinery
          (Chile)                                      Legnica Smelter
         Franke (Chile)                               Cedynia Wire-Rod Plant

60
Committed to solid corporate governance

          Independent directors on the board                                        KGHM’s Corporate Governance is guided by
                                                                                    international standards and follows best practices:
                                                                                       All members of KGHM’s Supervisory Board are appointed by
                                               Independent Directors
                3                                                                       the General Shareholders Meeting
                                               Other Directors
                                                                                       All of KGHM’s shares have equal voting rights (no preferred stock)
                                 6             Employee Elected                        6 independent members of the Supervisory Board 1)
                1
                                                                                       Committees of the Supervisory Board:
                                                                                               – Strategy Committee
                                                                                               – Audit Committee
                                                                                               – Remuneration Committee
          KGHM meets the top quality Corporate Governance                              Internal audit structure implemented across the KGHM Group -
          standards of the Warsaw Stock Exchange                                        consistent with the best international practices
          (compliant with EU/OECD guidance)                                            Code of Ethics – implemented in 2015

          In 2018 KGHM joined the FTSE4Good index. Being a member of the FTSE4Good index series confirms
          KGHM’s efforts in the field of environmental protection, social responsibility and corporate governance. KGHM perceives
          joining the FTSE4Good index as an award for its solid performance in complying with demanding ESG standards.

61   1)     According to criteria for independence set forth in point II.Z.4. of the Code of Best Practice for 11 WSE Listed Companies 2016
Shareholder structure of KGHM Polska Miedź S.A.

       Ownership structure                                                                     Geographical ownership structure
                                                                                               [% of shares]

                                                No. of Percentage                Share in
            Shareholder                        shares/    of share         total number
                                                 votes     capital               of votes
                                                                                               Rest of the Americas
            Polish State Treasury           63,589,900        31.79%             31.79%
                                                                                               0.4%

            Nationale-Nederlanden OFE       10,104,354         5.05%              5.05%        Germany
                                                                                               0.5%                   Unidentified
            Aviva OFE                       10,039,684         5.02%              5.02%                                  10.7%
                                                                                               Norway
                                                                                               0.7%
            Other shareholders            116,266,062         58.14%             58.14%
                                                                                                                                     Poland
                                                                                               Netherlands                           63.6%
            Total                         200,000,000       100.00%            100.00%         1.2%                    UK
                                                                                                                      7.3%
                                                                                               Rest of Europe
                                                                                                                           USA
                                                                                               1.9%
                                                                                                                          11.1%
                Polish State                                   Other
                                 Aviva
                                  OFE

                                 OFE
                                  NN

                 Treasury                                   shareholders                       Rest of the World
                                                                                               2.6%

       0%               20%           40%             60%              80%              100%

62   Source: KGHM Polska Miedź; geographical ownership structure – November 2019
Sensitivity of results to metal prices and the FX rate

                  The economic results of KGHM Polska Miedź S.A. are highly sensitive to changes in
                                           metals prices and the FX rate1)

                                                                 Copper price

                    Cu price decrease by 100 USD/t                              Cu price increase by 100 USD/t
                    = approx. PLN 68 million lower net profit                   = approx. PLN 75 million higher net profit

                                                                 Silver price

                    Ag price decrease by 1 USD/oz t                             Ag price increase by 1 USD/oz t
                    = approx. PLN 120 million lower net profit                  = approx. PLN 119 million higher net profit

                                                            USD/PLN exchange rate

                    FX rate decrease by PLN 0.10                                FX rate increase by PLN 0.10
                    = approx. PLN 156 million lower net profit                  = approx. PLN 169 million higher net profit

63   1)   Estimates based on market conditions of Q1 2019
Share price performance

       Basic quotes                                                           Strong correlation with copper and silver
                                                                              [change in %]
                                                                                                      KGHM                    Ag             Cu
           WSE debut                                  10th July 1997                  20

           GPW ticker                                           KGH                    0
           Bloomberg/Reuters ticker               KGH PW / KGH.WA
                                                                                   -20
           Share price [PLN]                                  90.42
           Capitalization [bn PLN]                            18.08                -40

           No. of shares                               200 000 000                 -60
           Share capital [PLN]                        2 000 000 000                   2014     2015        2016               2017           2018          2019

                      Max/min share price [PLN]           112/73.76
                      Spread min/max [PLN]
                                                                              …as well as WIG20 index
                                                              38.24
           52 weeks

                      Avg. share price [PLN]                  92.20               [pts]                                                                       [PLN]
                                                                                                               WIG20           KGHM
                      Avg. volume                           578 763
                                                                                 3 000
                      Avg. turnover [mn PLN]                  53.15                                                                                               125
                                                                                 2 500

        The Company’s shares are a component of the indices: WIG,                                                                                                 75
                                                                                 2 000
        WIG20, WIG20TR, WIG30, WIG30TR, WIG-GÓRNICTWO, WIG-
        Poland, WIG.MS-BAS, RESPECT/WIG-ESG, CEEplus. In 2018 KGHM               1 500                                                                            25
        joined the prestigious FTSE4Good index.                                       2014    2015      2016           2017           2018          2019

64   Source: KGHM Polska Miedź, Bloomberg, infostrefa.com, as of 22nd November 2019
Market risk management
     Hedged positions on the copper and silver markets (as at 30 September 2019)

       Copper                                                Hedged position – as at 30 September 2019   The fair value of derivatives in KGHM Polska
       [tonnes]
                                                                                                         Miedź S.A. as at 30 September 2019
                                                 45 000                                                  amounted to PLN 173 million
                    34 500
                                                                               27 000                       In the first three quarters of 2019, KGHM Polska
                                                                                                             Miedź S.A. recorded a result on derivatives and
                                                                                                             hedges in the amount of PLN 97.2 million, of
                                                                                                             which:
                   Q4 2019                      H1 2020                       H2 2020                        –   PLN 170 million increased revenues from
                                                                                                                 contracts with customers (transactions settled
       Silver                                                Hedged position opened in Q3 2019                   to 30 September 2019)
       [troy ounces]
                                                                                                             –   PLN 55.2 million decreased the result on
                                                                                                                 other operating activities
                                               1 800 000                     1 800 000
                                                                                                             –   PLN 17.6 million decreased the result on
                                                                                                                 finance activities
                                                                                                            The revaluation reserve on cash flow hedging
                                                                                                             instruments as at 30 September 2019 amounted
                                                                                                             to -PLN 198.5 million
                  Q4 2019                       H1 2020                       H2 2020

65   Details regarding the hedged position on all markets may be found in the financial statements
Market risk management
     Hedged positions on the currency and interest rate markets (as at 30 September 2019)

       USD/PLN                                                     Hedged position – as at 30 September 2019
       [mn USD]                                                    Hedged position opened in Q3 2019
                                                                                                                In the third quarter of 2019 the
                                   120                                                                           Parent Entity entered into CIRS,
                                                                                                                 or Cross Currency Interest Rate
                                                                                                                 Swaps, in the notional amount
                                                       120                                                       of PLN 2 billion, securing against
                                                                           120                  120
                                                                                                                 the market risk related to the
                                                                                                                 issue of bonds in PLN with
                                                                                                                 variable interest rates
                                   540                                                                          In addition, on 30 September
                                                       360
                                                                                                                 2019 the Parent Entity held open
                270                                                        270                  270              derivatives CAP positions on the
                                                                                                                 interest rate market for 2020 as
                                                                                                                 well as borrowings with a fixed
             Q4 2019             H1 2020            H2 2020             H1 2021              H2 2021             interest rate

66   Details regarding the hedged position on all markets may be found in the financial statements
Challenges facing KGHM Polska Miedź S.A.
     In the period 2019 - 2023

                            Production
                                Adapt currently-applied mining technology to potentially-difficult working conditions
                                Maintain domestic production at the current level – gain access to new areas of the mines
                                Improve operational efficiency
                                Improve safety – Zero Harm
                                Ensure Energy supplies at optimal prices

                            Żelazny Most                                                           Pyrometallurgy modernisation
                                                                                                   Modernisation of Głogów and Legnica plants
                            Ensure the long-term ability to
                            store mine tailings                                                         Ramp-up of new production units at the Głogów
                                                                                                         metallurgical plant (Głogów 1 smelter, roaster)
                                                                                                        Ramp-up of the scrap processing unit at
                                                                                                         the Legnica metallurgical plant

                            Sierra Gorda                                                           Stabilise the level of debt
                            Bring the Sierra Gorda to                                                   Improve the security of the Company’s operations
                            operational maturity                                                         by reducing debt
                                                                                                        Keep the Net Debt/EBITDA ratio under 2.0

67
Reasons to invest in KGHM

       A leading player on the copper
     and silver market in terms of mine   A diversified portfolio of assets at        PLN 21.5 bn paid out
      output and size of documented       various stages of development to         as dividend to shareholders
        resources, in mining-friendly     guarantee continued operations                in the last 15 years
                jurisdictions

                                                                                    A rational leveraging policy
         Experienced management                      A solid outlook                 with a safe level of the net
         with a proven track record              for the copper market           debt/EBITDA ratio and long-term
                 of success                  in the medium-to-long term           financing ensured through the
                                                                                        Bond Issue Program

68
Thank you
Follow us on:
                Investor Relations Departament
                kghm.com/en/investors
                ir@kghm.com
                +48 76 74 78 280
You can also read