Using a Tablet Computer Application to Advance High School Students' Laboratory Learning Experiences: A Focus on Electrical Engineering Education ...
←
→
Page content transcription
If your browser does not render page correctly, please read the page content below

sustainability

Article
Using a Tablet Computer Application to Advance
High School Students’ Laboratory Learning Experiences:
A Focus on Electrical Engineering Education
Pao-Nan Chou *          and Shu-Tzu Feng
 Department of Education, National University of Tainan, Tainan 70005, Taiwan; maker.nutn@gmail.com
 * Correspondence: pnchou@gm2.nutn.edu.tw; Tel.: +886-6-2133111 (ext. 765)

 Received: 29 November 2018; Accepted: 8 January 2019; Published: 13 January 2019

 Abstract: This study proposed an innovative instructional strategy for pre-college engineering
 education. Learning topics on electrical engineering education in a laboratory setting were selected
 for further exploration. Specifically, the study investigated how tablet computers with one adopted
 application influenced student engineering learning. The study adopted a quasi-experimental pretest
 and posttest research design. The educational experiment lasted for 6 weeks. The research participants
 comprised 57 ninth-grade students from a public high school in Taiwan. The students employed
 either a tablet computer or laptop computer to engage in weekly 3-h laboratory studies. A criterion
 test was developed to measure student knowledge of electrical engineering. The results revealed
 that the instructional effectiveness was identical for all the students, regardless of whether they used
 a tablet or laptop computer. However, those using the tablet computers achieved greater learning
 improvement. In addition, the qualitative data indicated that the tablet computers facilitated student
 learning in various engineering learning activities. The results of the study suggested that engineering
 educators in different educational levels might consider similar instructional methods to inspire
 students’ engineering learning.

 Keywords: laboratory mobile learning; tablet computer application; electrical engineering education;
 pre-college engineering education; industry 4.0

1. Introduction
     To embrace the concept of industry 4.0, Dallasega [1] stated that “the entailing increased degree of
digitization and automation requires a dramatic change for engineering education.” From a radical
change perspective, Ricardo et al. [2] even proposed the idea of engineering education 4.0, in which a
curriculum renovation for engineering education is necessary. However, within this trend, the current
research practice of innovation in engineering education (e.g., Jeganathan et al. [3]) tends to emphasize
higher education. Theoretical discussions regarding pre-college (or K–12) engineering education
remain uncommon. Since pre-college engineering education is closely related to students’ choices for
college engineering majors [4], advancing students’ engineering learning experiences though a new
pedagogical approach may develop their competence preparation for pre-service engineers [5].
     To verify theoretical knowledge received in traditional classrooms, laboratories in high school
settings provide students with valuable opportunities to use scientific machines and technological
gadgets for science and engineering experiments [6]. In some instructional cases, students in
laboratories might be provided with desktop or laptop computers to summarize their findings after
determining experimental results [7]. However, according to Huang et al.’s [8] scientific report, current
teaching practices in laboratories tend to focus on paper-based documentation after students have

Sustainability 2019, 11, 381; doi:10.3390/su11020381                    www.mdpi.com/journal/sustainability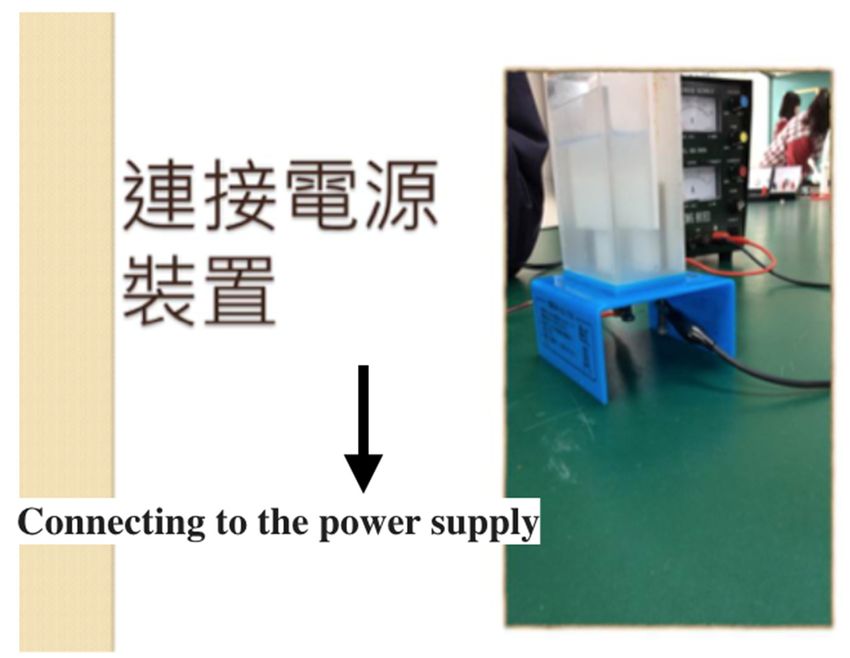
Sustainability 2019, 11, 381                                                                         2 of 14

completed experiments. In other words, after using gadgets to observe specific scientific phenomenon,
students are often instructed to summarize their findings in written laboratory reports.
     According to Huang and Tsai’s [9] analytic report, the integration of mobile technologies into
classrooms has confirmed instructional benefits for supporting student learning, particularly for active
learning behaviors and better learning performances. For this reason, Rogado et al. [10] proposed
that mobile learning has the potential to advance students’ engineering learning experiences in a
laboratory setting. In the current study, diverging from the traditional teaching approach (i.e., writing
paper-based reports), the concept of mobile learning was adopted in a laboratory at a high school in
which students used one application on tablet computers to record their observations and findings in
an electrical engineering experiment.
     In the present study, the proposal of mobile learning integration in the science laboratory can fit
well into the role of engineering education in the industry 4.0 Era, which emphasizes digitization and
automation [1]. Regarding digitization, the tablet computers with one adopted application empowered
students to digitally document their experimental findings in a manner other than relying on written
reports, and enabled the teacher to simultaneously digitally observe students’ progress. As for automation,
after students completed their digital scientific reports, their work would be automatically saved to
a cloud computing server. Subsequently, the teacher provided instant feedback by accessing the
students’ works. Overall, the digitization and automation process in the science laboratory might
advance and facilitate students’ engineering learning.
     The purpose of this study was to investigate how using tablet computers with one adopted
application influenced students’ engineering learning. The tablet computers employed in the study
were iOS-based mini tablets (i.e., iPad Minis). A 6-week educational experiment was conducted at a
public high school in Taiwan. Electrical engineering knowledge was selected as the main instructional
theme. Fifty-seven high school students voluntarily engaged in engineering learning activities in a
laboratory. The main research question was as follows:

•     Do significant differences exist between engineering learning achievements of students using
      tablet computers or laptop computers to facilitate their laboratory learning process?

2. Literature Review

2.1. Mobile Learning in Classrooms
     Mobile learning is often defined as “using mobile technologies to facilitate learning” [9].
Mobile technologies refer to smart-phones or tablet computers that can connect wirelessly to the
Internet. Depending on the teaching strategy, mobile learning can occur in outdoor fields or indoor
classrooms [9]. Ferreira et al. [11] proposed that a critical concept in mobile learning is mobility;
students can roam freely in most practical physical settings while using mobile technologies to obtain
information. According to the Horizon Report [12], mobile learning is regarded as a crucial educational
trend that could completely change current teaching practices and influence learning styles in K–12
educational environments.
     App adoption is a critical step in implementing mobile learning. Generally, app selection
strategies may affect the educational quality of mobile learning in classrooms [13]. Apps installed
on smart-phones or tablet computers are similar to desktop computer software, and likewise can
be used for various purposes. Depending on the mobile device operating system (e.g., Android
or iOS), mobile learning users can download free or paid apps from unique app stores through a
wireless communication. In the literature, some empirical studies have reported the benefits of apps
in student engineering learning. For example, Boticki et al. [14] used an Android-based app to teach
computer engineering concepts, reporting that app adoption efficiently facilitated student learning of
sorting algorithms.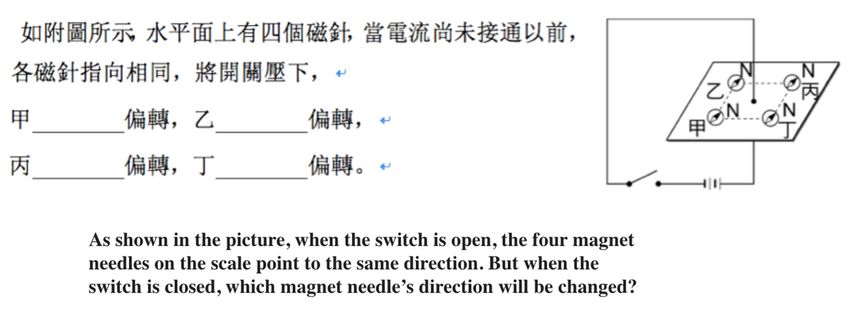
Sustainability 2019, 11, 381                                                                         3 of 14

2.2. Tablet Computers in Engineering Education
      Tablet computers are mobile computers with more compact features than laptop computers.
The most popular type of tablet computers are A4 sized and without physical keyboards. Users can
employ a stylus or directly use their fingers to create handwritten notes and drawings. For engineering
pedagogy purposes, Walker et al. [15] argued that tablet computers combine several multimedia
functions that could replace other instructional aids such as electronic white boards and digital slides.
Amelink et al. [16] considered that tablet computers have the potential to facilitate various learning
activities for student–instructor interaction. Casas et al. [17] proposed that tablet computers are suitable
for three specific class learning activities: note taking, slide annotation and group discussion. However,
regarding the use of tablet computers in teaching practice, previous studies have tended to focus on
traditional classroom settings rather than science laboratories.
      From an empirical perspective, previous studies have evidenced the educational benefits of tablet
computers in various engineering courses. Fang [18] used a tablet computer to facilitate student
learning in engineering dynamics, reporting that it increased learning interactions. Chegenizadeh and
Nikra [19] adopted a tablet computer for a geotechnical engineering class, finding that it increased
student engagement, productivity, and satisfaction. In a study by Johri and Lohani [20], students
appreciated the tablet computer’s visual representations, which aided knowledge construction and
management in an engineering exploration course. However, although previous related studies have
revealed several positive learning outcomes, a lack of an experimental research design is a potential
problem for verifying the effect of tablet computers in classrooms.

2.3. Advancing the Laboratory Learning Experience
     Because of increasing emphasis on K–12 engineering education, science education curricula in
schools worldwide have begun incorporating engineering knowledge [5,21]. For example, a new K–12
science education framework, outlining engineering design as a feature of crucial science learning
tasks, has been proposed in the United States to promote engineering learning [22]. Under such
an educational reform, the science laboratory in K–12 learning environments becomes critical in
learning engineering concepts. Therefore, designing an innovative instructional strategy for advancing
laboratory learning experiences is necessary [7].
     Because of the advantage of mobility, Markey et al. [23] and Rogado et al. [10] have proposed
that mobile technologies might be suitable for laboratory learning. For field observation purposes,
Benson et al. [24] suggested that tablet computers represent a superior instructional solution
for replacing traditional teaching practices (e.g., paperwork) in science laboratories. However,
the number of studies investigating mobile learning in laboratory settings is still limited.

3. Research Method

3.1. Research Design
     This study adopted a quasi-experimental pretest and posttest research design to investigate
the research question. The research focus was the effect of different instructional tools on the
engineering learning achievements of students. The independent variable was the type of educational
technology (tablet computer or laptop computer) that students used to facilitate engineering learning
in the science laboratory. The dependent variable was student learning outcomes in electrical
engineering. The rationale for not assigning a traditional control group (i.e., only without the
technology intervention) was that students in such a group would not gain the same potential
learning advantages as students who were provided with technological tools would [25], resulting in
a meaningless comparison. In addition, because engineering pedagogy involves complex abstract
knowledge, one research assumption was that the technological tools used in both groups were more
effective for engineering learning. Table 1 presents the research design of the study.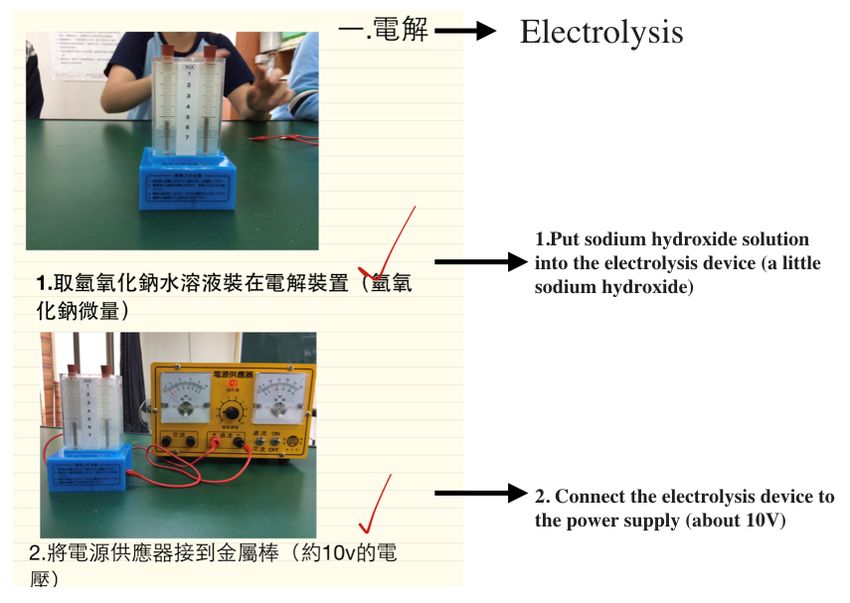
Sustainability 2019, 11, 381 4 of 14
Sustainability 2019, 11, x FOR PEER REVIEW 4 of 14
Table 1. Quasi-experimental study design.
Group
Group Pretest
Pretest Experiment * *
Experiment Posttest
Posttest
Experimental
Experimentalgroup
group(Class
(Class A)
A) OO11 X1 X1 O
O33
Control group
Control group(Class
(Class B)
B) OO22 X2 X2 O44
X1: Students using
X1 : Students usingtablet
tablet computers with
computers with adopted
adopted apps
apps inscience
in the the science laboratory.
laboratory. X2: Students
X2 : Students using
using laptop
computers
laptop with PowerPoint
computers in the science
with PowerPoint in thelaboratory. O1 ~Q4 : Criterion
science laboratory. O1~Qtest on electrical
4: Criterion testengineering.
on electrical
* The educational experiment lasted for 6 weeks.
engineering. * The educational experiment lasted for 6 weeks.
Students
Students in inboth
boththethe
experimental
experimentaland and
control groups
control engaged
groups in a teamwork-learning
engaged scenario.
in a teamwork-learning
The studyThe
scenario. teams comprised
study four or five
teams comprised students;
four or five each teameach
students; member
teamcollaboratively used the given
member collaboratively used
technological tool to complete engineering learning assignments. To improve
the given technological tool to complete engineering learning assignments. To improve learning learning results in
a science laboratory setting, Chou et al. [26] suggested the heterogeneous group
results in a science laboratory setting, Chou et al. [26] suggested the heterogeneous group principle principle as an
appropriate teamwork
as an appropriate strategy
teamwork for highfor
strategy school
high students. Therefore,
school students. according
Therefore, to the mean
according scores
to the meanof
three sectional science and technology examinations, the students in the present study
scores of three sectional science and technology examinations, the students in the present study were were assigned to
different
assigned heterogeneous groups in which
to different heterogeneous individual
groups abilities
in which were divergent.
individual abilities The
werestudents received
divergent. The
a
students received a pretest one week before the experiment, and a posttest one week after the
pretest one week before the experiment, and a posttest one week after the completion of the
experiment,
completion ofwhich was completed
the experiment, whichinwas30 min. Figure
completed in130shows a photograph
min. Figure 1 showsofa aphotograph
team workingof a
in
teamtheworking
experimental
in thegroup.
experimental group.
Figure 1. Students
Students in
in aa team
team using a mini tablet computer in the laboratory.
3.2. Experimental Control
3.2. Experimental Control
To
To prevent
prevent extraneous
extraneous factors
factors from
from influencing
influencing the
the validity
validity ofof the
the experiment,
experiment, strategies
strategies for
for
experimental
experimental control
control were
were adopted
adopted [27].
[27]. Table
Table 22 summarizes
summarizes the
the strategies
strategies applied
applied in
in the
thestudy.
study.
Table 2.
Table Strategies for
2. Strategies for experimental
experimental control
control in
in the
the study.
study.
ControlFactor
Control Factor Description
Description
1. Class instructor The same
Theinstructor taught thetaught
same instructor course,the
which was entitled
course, Science
which was and Technology.
entitled Science
1. Class instructor
and
Both the Technology.
experimental and control groups received the same class time
2. Class time
(60 minBoth
per class).
the experimental and control groups received the same class
2. Class time
time
The same (60 min
learning per class).
material and textbook were employed for imparting engineering
3. Learning contents
knowledge.
The same learning material and textbook were employed for
3. Learning contents
imparting engineering knowledge.
4. Class setting All learning activities occurred in the same science laboratory.
The pretest and posttest were administered on the same day of the
5. Test implementation
week. The same concepts were measured in both tests.Sustainability 2019, 11, 381 5 of 14
Table 2. Cont.
Control Factor Description
Sustainability 2019, 11, x FOR PEER REVIEW 5 of 14
4. Class setting All learning activities occurred in the same science laboratory.
The pretest and posttest were administered on the same day of the week.
5. Test implementation Students completed the same learning tasks in the laboratory. Taking
6. Learning activity The same concepts were measured in both tests.
the task outside the classroom was not permitted.
Students completed the same learning tasks in the laboratory.
6. Learning activity The pretest employed a covariance variable to control student initial
Taking the task outside the classroom was not permitted.
7. Initial behavior
learning behaviors.
The pretest employed a covariance variable to control student initial learning
7. Initial behavior The same rubrics for assignments were created for both the
8. Assignment rule behaviors.
experimental and control groups.
The same rubrics for assignments were created for both the experimental and
8. Assignment rule
control groups.
3.3. Research Instruments
3.3. Research Instruments
3.3.1. GoodNote (Experimental Group)
3.3.1.GoodNote
GoodNote is (Experimental
an iOS-based Group)
app that allows users to create digital notes by using a tablet
computer. The is
GoodNote main functionsapp
an iOS-based of this
thatapp include
allows users picture
to createtaking,
digital word processing,
notes by and computer.
using a tablet drawing.
Furthermore, the advanced function of synchronic editing enables users to co-edit
The main functions of this app include picture taking, word processing, and drawing. Furthermore, the same
document simultaneously. For teaching purposes, the instructor was able to observe
the advanced function of synchronic editing enables users to co-edit the same document simultaneously. students’
document-editing
For process
teaching purposes, theby accessingwas
instructor the able
students’ notes.students’
to observe Overall, the students had noprocess
document-editing problemsby
using the app to create colorful multimedia-based notes. In the experimental group, each
accessing the students’ notes. Overall, the students had no problems using the app to create colorful student
team was given two
multimedia-based smallIntablet
notes. computers togroup,
the experimental engageeachin the app-based
student team waslearning
givenactivity.
two small Figure
tablet2
shows a screenshot of GoodNote.
computers to engage in the app-based learning activity. Figure 2 shows a screenshot of GoodNote.
Figure 2. A page with teacher annotation in GoodNote. (The teacher read over the students’
Figure 2. A page with teacher annotation in GoodNote. (The teacher read over the students’
assignments with marks).
assignments with marks).
3.3.2. PowerPoint (Control Group)
3.3.2. PowerPoint (Control Group)
In contrast to the experimental group, each student team in the control group was given two
laptopIncomputers
contrast towith
the experimental group,
a digital camera each student
to complete team in the
the laboratory control group
assignments. The was given
purpose of two
the
laptop camera
digital computers
waswith a digital camera
to compensate for thetopicture-taking
complete the laboratory
function ofassignments. The purpose
GoodNote. Students of the
employed
digital camera
PowerPoint to was to compensate
document for the
their group picture-taking
project. function requirements
The assignment of GoodNote. for
Students employed
the multimedia
PowerPoint to document their group project. The assignment requirements for the multimedia
content of the PowerPoint presentation were the same as those for GoodNote. Because the students
could not co-edit PowerPoint files simultaneously, they had to organize each of their files to
compose a final project. To maintain progress, the instructor moved around the laboratory to
examine the group projects. Figure 3 is a screenshot of a PowerPoint project completed by a studentSustainability 2019, 11, 381 6 of 14
content of the PowerPoint presentation were the same as those for GoodNote. Because the students
could not co-edit PowerPoint files simultaneously, they had to organize each of their files to compose a
final project. To maintain progress, the instructor moved around the laboratory to examine the group
projects. Figure
Sustainability 3 is
2019, 11, a screenshot
x FOR of a PowerPoint project completed by a student group.
PEER REVIEW 6 of 14
Figure 3.3.Screenshot
Screenshotof aofPowerPoint projectproject
a PowerPoint documenting student findings.
documenting student (Students
findings. used PowerPoint
(Students used
to document their laboratory findings: connecting to the power supply).
PowerPoint to document their laboratory findings: connecting to the power supply).
3.3.3. Criterion Test
3.3.3. Criterion Test
In the study, a criterion test on electrical engineering was developed. The test covered six learning
In the study, a criterion test on electrical engineering was developed. The test covered six
domains: (a) battery introduction, (b) chemical reaction of circuit, (c) the relationship between magnetic
learning domains: (a) battery introduction, (b) chemical reaction of circuit, (c) the relationship
field and magnetic line of force, (d) magnetic effect of circuit, (e) interaction between circuit and
between magnetic field and magnetic line of force, (d) magnetic effect of circuit, (e) interaction
magnetic field, and (f) electromagnet effect. The test contained 20 short-answer question items.
between circuit and magnetic field, and (f) electromagnet effect. The test contained 20 short-answer
The score range of the test was between 0 and 100. Higher test scores represented higher student
question items. The score range of the test was between 0 and 100. Higher test scores represented
learning achievement in electrical engineering.
higher student learning achievement in electrical engineering.
This study adopted a three-stage process to ensure the validity and reliability of the test. First,
This study adopted a three-stage process to ensure the validity and reliability of the test. First,
two high school teachers of science and technology and one university professor of engineering
two high school teachers of science and technology and one university professor of engineering
examined a draft of the test. Next, a revised version of the test was distributed to 10 high school
examined a draft of the test. Next, a revised version of the test was distributed to 10 high school
students to verify the item description. Finally, the final version of the test was administered to
students to verify the item description. Finally, the final version of the test was administered to 37
37 high school students who did not participate in the educational experiment. The results of the
high school students who did not participate in the educational experiment. The results of the item
item analysis indicated that all the test items met the basic requirement of the discrimination index
analysis indicated that all the test items met the basic requirement of the discrimination index
(higher than 0.33). In addition, the results of the reliability test showed that the reliability coefficient was
(higher than 0.33). In addition, the results of the reliability test showed that the reliability coefficient
0.86. Therefore, according to basic evaluation standards suggested by Aiken and Groth-Marnat [28],
was 0.86. Therefore, according to basic evaluation standards suggested by Aiken and Groth-Marnat
the test demonstrated high validity and reliability. Figure 4 shows a representative test item on
[28], the test demonstrated high validity and reliability. Figure 4 shows a representative test item on
electromagnet effect.
electromagnet effect.analysis indicated that all the test items met the basic requirement of the discrimination index
(higher than 0.33). In addition, the results of the reliability test showed that the reliability coefficient
was 0.86. Therefore, according to basic evaluation standards suggested by Aiken and Groth-Marnat
[28], the test demonstrated high validity and reliability. Figure 4 shows a representative test item on
Sustainability
electromagnet 11, 381
2019, effect. 7 of 14
Figure 4. Test item from the criterion test on electromagnet effect. (Students should choose which item
correctly describes the electromagnet effect).
3.3.4. Qualitative Data
The qualitative data played a minor role in supporting the quantitative information. This study
collected qualitative data from: the teacher’s observation report and through informal interviews
between the teacher and students. The observation report comprised weekly class observation;
the interviews were conducted within 30 min through informal conversations (without a specific
interview guide) between the teacher and some of the students privately outside the classroom.
Two students in each team in the experimental group were randomly selected for the interviews.
The conversations in each interview were digitally recorded. Subsequently, the interview contents
were transcribed for further analysis and comparison with the teacher’s observation report.
3.4. Research Participants
In the study, the research participants comprised 57 ninth-grade students (Class A: 30, Class B: 27)
from a public high school in Taiwan (See Table 3). Because the students had taken several computer
courses in the first and second years of high school, they already possessed basic knowledge of
computer application functions such as document editing in Word and slide creation in PowerPoint.
All students had experience using desktop or laptop computers to facilitate their learning in the science
laboratory. Prior to the educational experiment, the students in the experimental group also received
instructions for using GoodNote. In both study groups, the students in each team took turns using the
learning technologies (i.e., tablet or laptop computers) to assume different group roles. For instance,
after the students used the scientific instruments in the laboratory, they took turns using the tablet
computer to document their findings.
Table 3. Research participant profiles.
Group Class n* Number of Teams Team Size
Experimental Class A 30 6 5
Control Class B 27 6 4 or 5
* The sample size meets the basic requirement of GPower.
3.5. Research Procedure
In the study, the major learning activity in the science laboratory was a report on engineering
learning. Regardless of which team the students were assigned to, upon entering the laboratory,
each team received a document outlining the report requirements and was given several scientific
instruments for engineering learning. Subsequently, the instructor held a class related to a specific
unit to impart laboratory knowledge. Upon completing the class, each group began manipulating
the scientific instruments and brainstorming on using the given technological tool (i.e., tablet or
laptop computer) to summarize their findings. Once their reports were completed, each student teamSustainability 2019, 11, 381 8 of 14
alternately used their learning devices to share their report results through a projector at the front of
the laboratory. Subsequently, the instructor provided feedback to each group. A task requirement was
that the content
Sustainability 2019, 11,in the scientific
x FOR PEER REVIEW reports had to contain multimedia elements (i.e., static images 8 ofand
14
textual descriptions of the laboratory learning process) to serve as components of student responses to
open-endedTable 4. Summary
questions devised of by
thethe
learning schedule
instructor. for the
Table weekly engineering
4 presents a summarylearning unit.
of the learning schedule
for the weekly
Learning Step engineering learning
Content * unit. Figure 5 shows the detailed research procedure.
Time Allocation
The students received an instructional document
1. Preparation Table 4. Summary of the learning schedule for the weekly engineering learning 10 min
unit.
and obtained scientific instruments
Learning Step The instructor
Content * imparted basic concepts of Time Allocation
2. Orientation 40 min
1. Preparation
laboratory learning
The students received an instructional document and obtained
10 min
scientific instruments
The students manipulated the instruments and
3. Observation
2. Orientation and usedThe instructor
varied imparted basic
technological conceptsdevices
learning of laboratory
to learning 100 40
minmin
exploration The students manipulated the instruments and used varied
document their findings
3. Observation and exploration 100 min
technological learning devices to document their findings
Students used their learning devices to share their
4. Presentation
4. Presentation 30 min
Students used their learning devices to share their report results 30 min
report results
* Students engaged in 3 h laboratory learning per week during a 6-week experiment.
* Students engaged in 3 h laboratory learning per week during a 6-week experiment.
Figure 5. Research procedure of the study.
Figure 5. Research procedure of the study.
3.6. Data Analysis
3.6. Data Analysis
In the study, both descriptive and inferential statistics were used to analyze the collected data.
The descriptive statistics were the mean and standard deviation of student learning outcomes. For the
In the study, both descriptive and inferential statistics were used to analyze the collected data.
inferential statistics, a one-way analysis of covariance (ANCOVA) was employed to observe the effect of
The descriptive statistics were the mean and standard deviation of student learning outcomes. For
the inferential
the independent variables
statistics, (i.e., varied
a one-way learning
analysis technologies)
of covariance on the student
(ANCOVA) learningto
was employed achievements.
observe the
A t-test was used to measure the learning improvement between the pretest and posttest.
effect of the independent variables (i.e., varied learning technologies) on the student learning
achievements. A t-test
4. Research Result and was used to measure the learning improvement between the pretest and
Discussion
posttest.
4.1. Quantitative Findings
4. Research Result and Discussion
Tables 5 and 6 summarize the results of the t-test with descriptive statistics and one-way ANCOVA,
respectively. TheFindings
4.1. Quantitative results in Table 5 reveal significant within-groups differences between the posttest and
pretest for the experimental (t = −9.58, p < 0.01) and control groups (t = −7.39, p < 0.01). In other words,
Table
student 5 and Table
learning 6 summarize
improved the results
in both groups. of the t-test
Regarding withdifference
the mean descriptive statistics
between theand one-way
posttest and
ANCOVA, respectively. The results in Table 5 reveal significant within-groups differences
pretest scores, the students in experimental group (47.67) exhibited superior learning improvement between
the posttest and pretest for the experimental (t = −9.58, p < 0.01) and control groups (t = −7.39, p <
0.01). In other words, student learning improved in both groups. Regarding the mean difference
between the posttest and pretest scores, the students in experimental group (47.67) exhibited
superior learning improvement compared with those in the control group (44.81). When considering
the role of the pretest, the results in Table 6 reveal no significant between-groups difference for theSustainability 2019, 11, 381 9 of 14
compared with those in the control group (44.81). When considering the role of the pretest, the
results in Table 6 reveal no significant between-groups difference for the posttest (F = 0.55, p > 0.05).
Therefore, when the effect of the pretest was controlled, the learning outcomes in both study groups
were identical.
Table 5. Results of the t-test.
Pretest Posttest
n Posttest–Pretest t df
M SD M SD
Experimental 30 47.67 9.17 10.43 56.83 22.15 −9.58 ** 55
Control 27 44.81 8.15 6.39 52.96 28.60 −7.39 ** 55
** p < 0.01.
Table 6. Results of the one-way ANCOVA.
Source SS df MS F p
Covariance: Pretest 3484.85 1 3484.85 5.88 0.02 *
Class 325.84 1 325.84 0.55 0.46
Errors 32,002.28 54 592.64
* p < 0.05.
To ensure the similar learning behaviors between two groups of students prior to the study, Table 7
reports the results of the t-test for pretest. The findings confirmed that students’ learning performances
were identical before the implementation of the educational experiment (t = 0.44, p > 0.05).
Table 7. Results of the t-test for pretest.
Experiment Pretest Control Pretest p
t df
M SD M SD
Pretest 9.17 10.43 8.15 6.39 0.44 55 0.66
4.2. Qualitative Findings
Regarding various aspects of tablet computer use with the adopted app, Table 8 lists representative
quotes from the interview results and observation report. This qualitative information indicated that
despite the few negative comments on technical problems, both the instructor and the students in
the experimental group expressed positive attitudes toward integrating the tablet computer into their
laboratory learning.
Table 8. Aspects of tablet computer use with the adopted app.
Aspects Representative Quotes
1. “The tablet computer allows me to easily grade students’ submitted reports
through the annotation function.” (Instructor)
1. Note annotation
2. “We can annotate some information on the pictures we took. It was very
easy to add descriptions for the images.” (Student)
1. “I accessed the students’ notes to observe their performance. It saved me
a lot of time.” (Instructor)
2. Learning facilitation
2. “My partner and I moved the tablet computer around the laboratory.
It was very convenient for group discussion.” (Student)Sustainability 2019, 11, 381 10 of 14
Table 8. Cont.
Aspects Representative Quotes
1. “Students were interested in using the tablet computer in their laboratory
learning. Their active engagement created a different learning atmosphere.”
3. Learning motivation (Instructor)
2. “The app was very user friendly. We enjoyed using it to document our findings.
It was very fun!” (Student)
1. “Wireless communication was a major potential problem. Sometimes,
the wireless signal from the router was not strong enough for the tablet computer,
which affected the learning process.” (Instructor)
4. Technical problems
2. “The difficult part of operating the tablet computer was typing. The lack of a
physical keyboard for typing was a challenge. We had to adjust to a new learning
style.” (Student)
4.3. Discussion
Before the experiment, the results of the pretest indicated that all students exhibited similar
learning behaviors. After the 6-week experiment, the students in both the experimental group
(i.e., tablet computer users) and control group (i.e., laptop computer users) exhibited a significant
improvement in their engineering learning in the science laboratory. However, from a learning progress
perspective, the students using the tablet computers outperformed their counterparts using the laptop
computers. In other words, the tablet computers enabled the students to develop their learning
potential, resulting in higher learning outcomes [18–20]. Therefore, in this study, the tablet computers
with adopted app were effective instructional tools that may facilitate student engineering learning in
the science laboratory [10,24].
Although the ANCOVA analysis results indicate that the students using both the tablet or laptop
computers demonstrated the same instructional effectiveness, the qualitative information reveal
several indirect learning benefits of using a tablet computer. In the experimental group, the students
perceived that the annotation function in the app benefited their report writing; the instructor expressed
the same opinion. In addition, because of their mobility, the tablet computer markedly facilitated
the student learning process and group discussions. Although minor technical problems appeared
in the educational setting, integrating the tablet computers into the students’ science laboratory
learning motivated them to actively engage in the learning activities. Thus, the results were consistent
with previous studies that have showed the potential educational benefits of implementing tablet
computer-based instruction [15–17,29].
In the present study, the use of laptop computers served as an established teaching model to
determine the learning effect of tablet computers. After the effect of the pretest was controlled,
the results of the inferential statistics revealed no significant difference between the experimental group
(i.e., tablet computer users) and control group (i.e., laptop computer users). In other words, the learning
value remained for the students using the laptop computers to document their scientific reports in the
laboratory. This phenomenon can be attributed to the size of the computer device and the multimedia
capabilities of PowerPoint. Compared with the miniature size of the tablet computer (i.e., iPad Mini),
the laptop computer provided a wider screen for editing reports, which in turn influenced the students’
knowledge acquisition. Additionally, elements of multimedia presentations, such as visual objects
in PowerPoint, still exhibited technological effects on the students’ learning outcomes [30]. Table 9
summarizes the pros and cons of two technological tools used in the present study.Sustainability 2019, 11, 381 11 of 14
Table 9. Pros and cons of tablet and laptop computers used in the science laboratory.
Type Pros Cons
1. Provides note annotation
functionality [17]
2. Easy to use for group
discussion [16–18]
3. Provides simultaneous
Tablet computer with document 1. Difficult to type
one application co-editing functionality 2. Small computer screen
4. Easy to use for instructor
supervision of the
project progress
5. Provides picture-taking
function (built-in camera)
1. Difficult to use for
group discussion
2. Lack of note
annotation functionality
1. Large computer screen
3. Lack of
Laptop computer with one 2. Easy to type
picture-taking functionality
piece of packaged software 3. Provides a lot of multimedia
4. Lack of simultaneous
elements [30]
document
co-editing functionality
5. Difficult to use for
instructor supervision
Regardless of the types of instructional tools, the findings confirmed our earlier research
assumption, showing that information technologies (tablet and laptop computer) used in both
experimental groups were effective for engineering learning in the science laboratory. However,
since the instructional method for two learning groups in the study tended to focus on student-centered
mechanisms, such constructive learning environments [31] might also facilitate students’ knowledge
acquisition for engineering learning. In other words, hands-on learning activities adopted in the
science laboratory might be a potential variable influencing the results of the study.
In Sánchez-Martín et al.’s study [32], the survey results reported that high school students did not
emotionally respond to technology learning modules in the same way. Sánchez-Martín et al. further
suggested that promoting positive learning emotions might raise high school students’ interests
in learning engineering knowledge. In the present study, although the purpose was to evaluate
the instructional effectiveness of two educational technologies on electrical engineering learning,
the qualitative data from the instructor and students still indicated one additional finding: a tablet
computer with one adopted application motivated student learning. In other words, the instructional
strategy used in the study might arouse high school students’ positive emotional responses, which
indirectly affected their learning interests in the field of engineering and technology.
Because of the nature of the experimental research design, the findings in this study cannot be
fully generalized for other research scenarios. Several research limitations that were encountered are
discussed as follows. First, the app employed in this study was suitable only for teaching practice in
the science laboratory. Alternative app selection strategies may influence overall instruction to a certain
extent. Future studies should investigate the effect of other apps on student learning performance.
Second, the research participants in this study engaged in a team-based learning activity. Whether
differences among participant abilities may affect teamwork outcomes remains unknown. Future
studies should consider emphasizing individual abilities in laboratory learning. Third, the mobileSustainability 2019, 11, 381 12 of 14
device adopted in this study was a miniature tablet computer. Other mobile technologies may create
different learning atmospheres. Smart-phones with large screens may provide an alternative approach
for future studies. Fourth, this study only focused on the combination effect of the tablet computers
with one application or the laptop computers with PowerPoint. Future studies may investigate the
single effect of hardware (tablet or laptop computer) or software (application or package software)
on students’ learning outcomes. Fifth, the learning theme in this study was electrical engineering
knowledge. Observation of the manipulation of scientific instruments related to different engineering
fields may influence the content of laboratory report. Future studies may verify the role of other
engineering learning themes. Finally, the focus of the present study was students’ overall knowledge
acquisition about electrical engineering rather than detailed learning tasks in the science laboratory.
Breaking down some learning tasks into smaller pieces of fundamental learning constructs may yield
different learning outcomes. Future studies may analyze how the tablet computers with one adopted
application influence students’ analytical skills, scientific writing and knowledge retention in the
science laboratory.
5. Conclusions and Implication
This study investigated the effect of the tablet computers with one adopted application on students’
electrical engineering learning in a laboratory setting. No significant difference in engineering learning
achievements was identified between the two experimental groups. The students in both the tablet
computer group and the laptop computer group achieved the same learning outcomes. However,
from a learning improvement perspective, the students using the tablet computers outperformed those
using the laptop computers. In addition, the qualitative data collected in the study show that the
tablet computers facilitated the students’ learning process and motivated them to actively engage in
engineering learning activities. Thus, the tablet computers provided a superior instructional solution
for engineering learning in a laboratory setting.
The findings from the proposed instructional strategy (i.e., the integration of mobile learning)
might contribute to existing knowledge base regarding engineering learning in the science laboratory.
First, mobile learning might allow students easily construct their scientific understanding through
the mobility of the tablet computers. Second, the application in the tablet computer might facilitate
student collaborative learning by providing a document co-editing function. Third, from a teaching
perspective, mobile learning might strengthen the interaction model between the teacher and students
by providing instant feedbacks. Finally, the learning cycle (preparation, orientation, observation and
exploration, and presentation) equipped with the use of the tablet computers might create a robust
laboratory learning environment.
Although the research setting in the study was a K–12 learning environment, the findings may still
provide some instructional implications for engineering educators who wish to enhance college student
laboratory learning experiences. A major task for the integration of tablet computers into laboratory
learning is the wireless communication setup. A strong wireless connection enables students to use
tablet computers to smoothly record their observation. Another instructional concern in adopting
tablet computers for engineering learning is app selection. Free and paid apps have unique features
that can be applied in teaching practices. According to the instructional goals of a course, determining
advantages and disadvantages of apps is a necessary task for engineering instructors.
Author Contributions: P.-N.C. is responsible of designing the study and writing the manuscript. S.-T.F. author is
responsible of implementing the study.
Funding: This research was funded by Ministry of Science and Technology in Taiwan [grant number:
MOST 105-2511-S-024 -001 -MY3].
Conflicts of Interest: The authors declare no conflict of interest.Sustainability 2019, 11, 381 13 of 14
References
1. Dallasega, P. The Role of Engineering Education in Industry 4.0 Era. Available online: https://www.mdpi.
com/journal/sustainability/special_issues/sus_engineering_edu (accessed on 10 October 2018).
2. Ricardo, A.R.; Ruben, M.M.; Hafiz, I.; Roberto, P.S. Engineering education 4.0: Proposal for a New Curricula.
Available online: https://ieeexplore.ieee.org/document/8363376/authors (accessed on 12 October 2018).
3. Jeganathan, L.; Khan, A.N.; Raju, J.K.; Narayanasamy, S. On a Framework of Curriculum for Engineering
Education 4.0. Available online: https://weef-gedc2018.org/wp-content/uploads/2018/11/76_on-a-frame-
work-o-curriculum-for-engineering-education-4.0.pdf (accessed on 19 October 2018).
4. Chen, W.F.; Chou, P.N. Guest editorial: Current trends of K-12 engineering education. Int. J. Eng. Educ. 2017,
33, 285–286.
5. Katehi, L.; Pearson, G.; Feder, M. Engineering in K-12 Education; The National Academies Press: Washington,
WA, USA, 2009.
6. Sorrentio, J. Science Laboratory in Elementary School. Available online: http://www.education.com/
magazine/article/Science_Labs_Elementary_School (accessed on 2 February 2016).
7. Singer, S.R.; Hilton, M.L.; Schweingruber, H.A. America’ Lab Report, Investigations in High School Science;
The National Academies Press: Washington, WA, USA, 2005.
8. Huang, B.C.; Chang, Y.T.; Cheng, S.W. Manuals for Training Biological Experimental Skills of Students
in Elementary and Middle Schools at National Taiwan Science Education Center. Available online:
https://www.ntsec.gov.tw/User/Article.aspx?a=476 (accessed on 13 October 2018).
9. Huang, G.J.; Tsai, C.C. Research trends in mobile and ubiquitous learning: A review of publications in
selected journals from 2001 to 2010. Br. J. Educ. Technol. 2011, 42, E65–E70.
10. Rogado, A.B.G.; Quintana, A.M.V.; Elorza, I.U. Mobile technology in academic laboratories in engineering.
Int. J. Eng. Educ. 2015, 31, 694–701.
11. Ferreira, J.B.; Klein, A.Z.; Freitas, A.; Schlemmer, E. Mobile learning: Definition, uses and challenges.
In Increasing Student Engagement Andretention Using Mobile Applications: Smartphones Skype and Texting
Technologies; Wanket, L.A., Blessinger, P., Eds.; Emerald Group Publishing Limited: Bingley, UK, 2013;
pp. 47–82.
12. The New Media Consortium. The Horizon Report. Available online: http://www.nmc.org/pdf/2013-
horizon-report-k12.pdf (accessed on 21 February 2016).
13. Nortcliffe, A.; Middleton, A. The innovative use of personal smart devices by students to support their
learning. In Increasing Student Engagement and Retention Using Mobile Applications: Smartphones, Skype and
Texting Technologie; Wanket, L.A., Blessinger, P., Eds.; Emerald Group Publishing Limited: Bingley, UK, 2013;
pp. 175–208.
14. Boticki, I.; Barisic, A.; Martin, S.; Drljevic, N. Teaching and learning computer since sorting algorithms with
mobile devices: A. case study. Comput. Appl. Eng. Educ. 2013, 21, E41–E50. [CrossRef]
15. Walker, D.G.; Streamler, M.A.; Johnston, J.; Bruff, D.; Brophy, S.P. Case study on the perception of learning
when tablet PCs are used as a presentation medium in engineering classrooms. Int. J. Eng. Educ. 2008, 24,
606–615.
16. Amelink, C.T.; Scales, G.; Tront, J.G. Student use of the tablet PC: Impact on student learning behaviors.
Adv. Eng. Educ. 2017, 3, 1–17.
17. Casas, I.; Ochoa, S.F.; Puente, J. Using tablet PCs and pen-based technologies to support engineering
education. In Human-Computer Interaction; Jacko, J.A., Ed.; Springer: Berlin, Germany, 2009; pp. 31–38.
18. Fang, N. Using tablet PCs to quickly assess students’ problem-solving performance in an engineering
dynamics classroom. World Trans. Eng. Technol. Educ. 2012, 10, 247–252.
19. Chegenizadeh, A.; Nikraz, H. Tablet PC application in geotechnical engineering. Int. Proc. Econ. Dev. Res.
2012, 47, 124–127.
20. Johri, A.; Lohani, V.K. Framework for improving engineering representational literacy by using pen-based
computing. Int. J. Eng. Educ. 2011, 27, 958–967.
21. Miaoulis, I. K-12 engineering-the missing core discipline. In Holistic Engineering Education: Beyond Technology;
Grasso, D., Burkins, M.B., Eds.; Springer: New York, NY, USA, 2010; pp. 37–51.
22. Quinn, H.; Schweingruber, H.; Keller, T. A Framework for K-12 Science Education: Practices, Crosscutting
Concepts and Ore Deas; The National Academies Press: Washington, WA, USA, 2012.Sustainability 2019, 11, 381 14 of 14
23. Markey, M.K.; Holmes, A.J.; Edgar, T.F.; Schmidt, K.J. Student-driven learning in integrated lecture-lab
classroom environments: The role of mobile computing. Int. J. Eng. Educ. 2007, 23, 483–490.
24. Benson, E.R.; Krawczyk, C.; Figueiredo, G.F. Evaluation of tablet and laptopcomputers in field and laboratory
settings. Int. J. Eng. Educ. 2006, 22, 1189–1196.
25. Clark, R.C.; Mayer, R.E. E-Learning and the Science of Instruction: Proven Guidelines for Consumers and
Designers of Multimedia Learning; Pfeiffer: San Francisco, CA, USA, 2007.
26. Chou, P.-N.; Chen, W.-F.; Lin, H.-L. An investigation of using wiki to facilitate group composition in learning
engineering knowledge: A quasi-experimental study. Int. J. Eng. Educ. 2015, 31, 619–626.
27. Creswell, J.W. Research design: Qualitative, Quantitative and Mixed Methods Approaches; Sage Publications Inc.:
Thousand Oaks, CA, USA, 2009.
28. Aiken, L.R.; Groth-Marnat, G. Psychological Testing and Assessment, 12th ed.; Allyn & Bacon: Boston, MA,
USA, 2006.
29. Tront, J.G. Using tablet PCs in engineering education. In Proceedings of the American Society for Engineering
Education Annual Conference & Exposition, Honolulu, Hawaii, 24–27 June 2007.
30. Chou, P.-N.; Chang, C.-C.; Lu, P.-F. Prezi versus PowerPoint: The effects of varied digital presentation
tools on students’ learning performance. Comput. Educ. 2015, 91, 73–82. [CrossRef]
31. Smith, P.L.; Ragan, T.J. Instructional Design, 3rd ed.; Wiley: Hoboken, NJ, USA, 2005.
32. Sánchez-Martín, J.; Álvarez-Gragera, G.J.; Dávila-Acedo, M.A.; Mellado, V. What do K-12 students feel when
dealing with technology and engineering issues? Gardner’s multiple intelligence theory implications in
technology lessons for motivating engineering vocations at Spanish Secondary School. Eur. J. Eng. Educ.
2017, 42, 1330–1343. [CrossRef]
© 2019 by the authors. Licensee MDPI, Basel, Switzerland. This article is an open access
article distributed under the terms and conditions of the Creative Commons Attribution
(CC BY) license (http://creativecommons.org/licenses/by/4.0/).You can also read