Oil Markets in the Post-Covid-19 World - ECONOMIC TRENDS - TRENDS Research ...
←
→
Page content transcription
If your browser does not render page correctly, please read the page content below

ECONOMIC TRENDS

     Oil Markets in the Post-
         Covid-19 World

    Mohammed Hamdaoui

September 2020                     (1)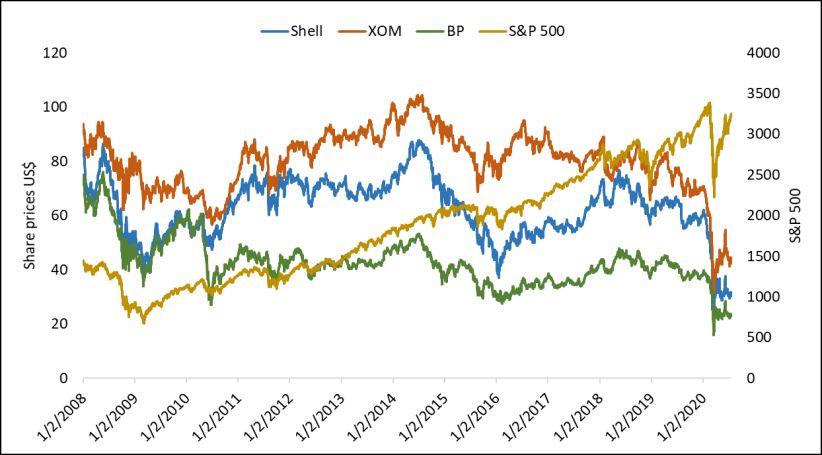
Economic TRENDS (1)
Oil Markets in the Post-
    Covid-19 World
   Mohammed Hamdaoui

       September 2020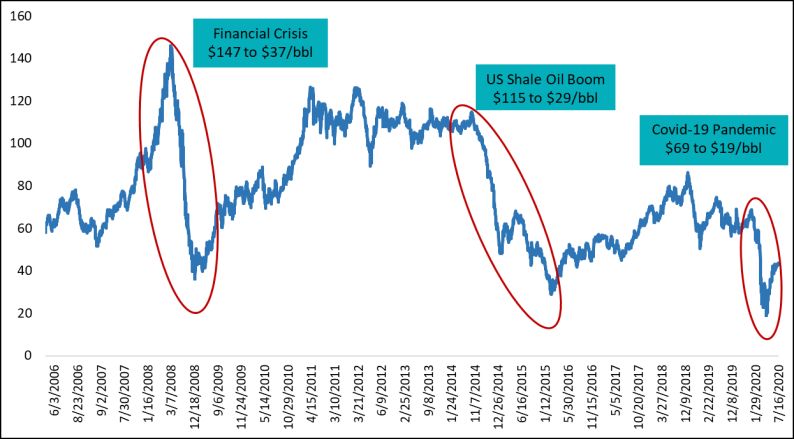
Views expressed in this study do not necessarily reflect that
                of TRENDS Research & Advisory

                  © All publishing rights reserved

                          First edition 2020
                     Order No.: MC-02-01-8774073
                       ISBN: 978-9948-25-112-5

All copyrights are owned by the publisher. This book or part thereof
shall not be reproduced in any form, translated or quoted from
without prior written permission of the publisher. These rights are
reserved worldwide. All registration and protection procedures have
been taken in accordance with international copyright treaties for
the protection of literary and artistic works.

                 © Trends Research & Advisory
                    http://trendsresearch.org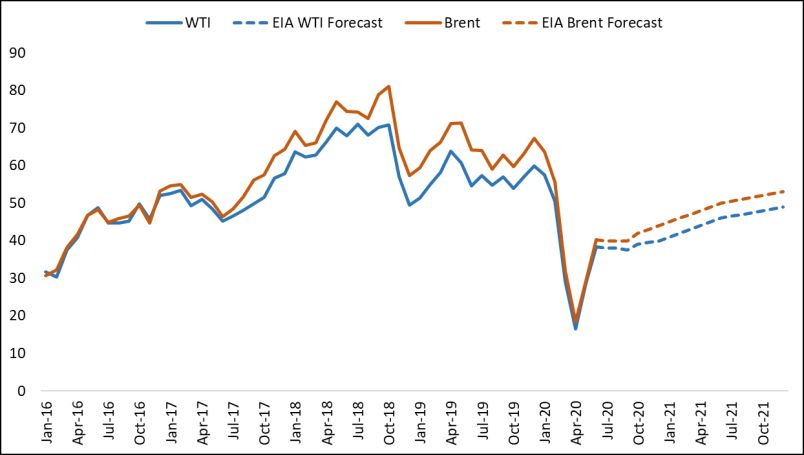
About

       TRENDS Research & Advisory

TRENDS Research & Advisory was founded in Abu Dhabi in
2014 with the objective to be an independent research center
positively contributing to enhancing scientific studies. The
Center seeks to provide a better understanding and deeper
analysis of the developments and challenges impacting the Gulf
and Middle East regions and the world in general. Conducting
research   at    TRENDS        Research   &   Advisory    follows
internationally-acknowledged scientific standards adopted by the
most established think-tanks worldwide.

The Center has been contributing effectively toward the process
of enlightening the Arab and international public, especially
concerning geopolitical, economic, and security affairs. The
Center seeks to continuously widen its network of researchers
and experts from highly reputable Arab and international
universities. The objective behind building this network is to
maintain   the    quality   of    research,   diversify   research
methodologies, and address both regional and global-wide issues
from different perspectives.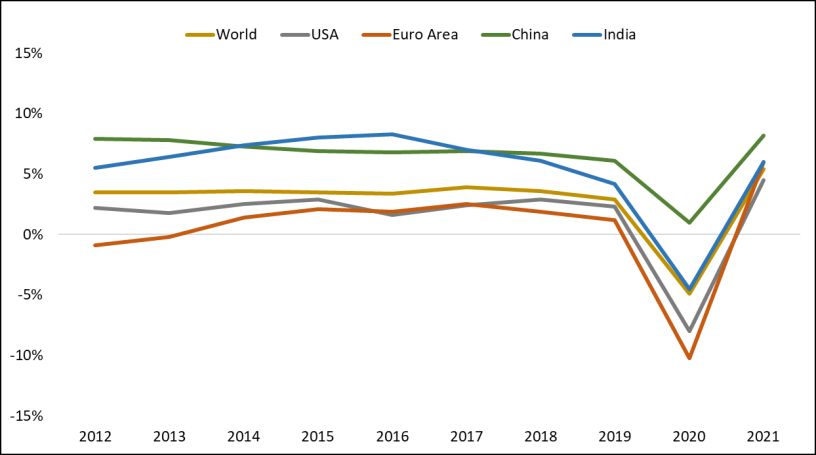

TABLE OF CONTENTS

1.   Abstract                                9

2.   Introduction                            10

3.   Oil crises - the past and the present   11

     Impact of Covid-19 pandemic on oil
4.                                           22
     markets

5.   Oil markets in a post-Covid world       31

6.   Conclusion                              45

7.   References                              47

8.   About the Author                        51
Oil Markets in the Post-Covid-19 World
Abstract
The scale of the socio-economic impact of the Covid-19 pandemic
on the global economy has not been witnessed since the Great
Depression. Isolation measures, implemented across the globe to
contain the virus, confined hundreds of millions of people into their
homes, bringing economic activities to a standstill. This crisis has
impacted the oil and gas industry in an unprecedented manner. A
massive decline in oil demand and a large oversupply, intensified by
the price war between Russia and Saudi Arabia, has sent oil prices
to levels unseen in decades. While the oil industry has faced several
crises that have pushed it to find new ways to conduct business and
adapt to changing conditions, the Covid-induced crisis has come
when the industry is dealing with increased shareholder activism and
intense pressure on the environmental front. Since this is a new
phase for the industry, it could also become the catalyst that
accelerates the transformation it has started to go through.
Oil will continue to play an essential role in the energy mix for
many decades. However, oil companies will have to navigate and
manage an uncertain future as oil and gas projects will be riskier to
develop and consequently require a higher rate of return. They will
have to diversify their portfolios and continue shifting toward an
integrated business model that embraces the changes caused by the
energy transition and the growth in renewable and new
technologies.
9Introduction
The world has not experienced anything like Covid-19 since
the Spanish flu between 1918 and 1919. The scale of the social
and economic impact of the ongoing pandemic on the global
economy has also not been witnessed seen since the Great
Depression. We have entered uncharted waters, and it is
difficult to fathom the actual extent of the lasting impact.
Various isolation measures, which the International Monetary
Fund (IMF) calls “the Great Lockdown,” were implemented
across the globe to contain the spread of the virus. These
measures confined hundreds of millions of people into their
homes, bringing economic activities and life as we know it to
a standstill worldwide. The IMF predicts that the global
economy will contract by 4.9 percent in 2020, but “extreme
uncertainty around the global growth forecast” remains and
will depend on how several unprecedented factors will evolve.
The slowdown in the global economy has impacted the oil and
gas industry in a way we have not witnessed before. The
combination of a fast, massive, and almost instantaneous
decline in oil demand and a large oversupply, further
intensified by the price war between Russia and Saudi Arabia,
has sent the price to levels unseen in decades.
This paper will compare the current crisis caused by the Covid-
19 pandemic with the oil price crashes of 2008 and 2014-2016.
It will analyze the impact of the current crisis on the oil
markets and look at the oil industry’s outlook post-Covid-19.
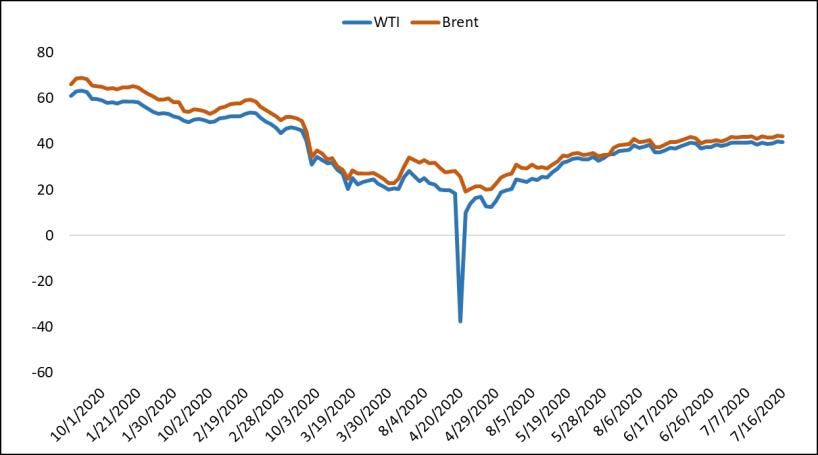
101. Oil crises - the past and the present
The oil and gas industry goes through cycles driven by
significant shifts in demand, supply, and geopolitics. Several
price collapses have varied in the drivers that triggered them,
the scale and the length of the price decline, and the effects
on the oil and gas industry. The industry has experienced
three major price crises since the turn of the century: the first
was a result of the 2008 financial crisis, the 2014-2016 shale
oil boom triggered the second, and the third is the
unprecedented situation caused by Covid-19.
While the 2008 price collapse was driven by demand
destruction caused by the major economic recession
following the US financial crisis, the 2014-2016 price
collapse was mainly driven by a glut in supply from the US
shale oil industry. The ongoing crisis is unique because it was
triggered by a massive drop in demand due to lockdown
measures, travel restrictions, and reduced economic activity
across all countries at varying degrees. It was coupled with
plentiful supply, unavailability of storage capacity in
addition to an ill-timed price war.
11Figure 1: Brent oil prices US$/bbl1
1.1. The financial crisis of 2008 and oil demand
destruction
The 2008 financial crisis started in the real estate market in the
US, and the ensuing great recession, which was the worse
since the Great Depression, had a profound impact on the oil
and gas industry at multiple levels. It caused a drop in demand,
a collapse in prices, a reduction in the value of assets, and
increased the cost of borrowing.
The massive slowdown in economic output caused by the
recession and the drop in household income due to the increase
of unemployment reduced energy demand and consequently
put pressure on oil prices. The drop in demand was quick and
more pronounced in the Organization for Economic Co-
operation and Development (OECD) countries. In November
and December 2008, global demand growth was subdued, and
12the November 2008 US oil demand declined by about 10
percent month on month. 1 The Organization of Petroleum
Exporting Countries (OPEC) also estimated that the decline in
demand for the OECD countries was around 1.3 million
barrels per day, year-on-year in the first half of 2009.2 One side
effect of this drop in demand was a massive increase in oil
storage, pushing oil-storage facilities to their limits and leaving
them with more oil than in any year since 1990 Iraq’s invasion
of Kuwait.
After reaching a high of $147/bbl in July 2008 driven by
increasing demand for oil from emerging markets led by China
and India, Brent price quickly collapsed to a low of $37/bbl in
December 2008. West Texas Intermediate (WTI) oil prices had
the same pattern going from $145/bbl to $35/bbl during the
same period. Both Brent and WTI prices went on a long and
slow recovery that started in Q1 2009. Still, they never came
close to their levels before the financial crisis and only crossed
the $100/bbl bar by mid-2011, driven by the uncertainty
caused by the protests in the Middle East and North Africa
(MENA) region in what was called the “Arab Spring”.
The massive drop in prices reduced oil companies’ revenues
and depressed rate of returns. The decline in revenues,
1. “Well Prepared”, The Economist Print Edition (Archived), November 06, 2008
(https://web.archive.org/web/20081109045746/http://www.economist.com/finan
ce/displaystory.cfm?story_id=12564013)
2. “Monthly Oil Market Report December 2008”, OPEC, December 2008
(https://www.opec.org/opec_web/static_files_project/media/downloads/publ
ications/MR122008.pdf)
13reducing the available cash needed for investment, and the
tightening credit conditions increasing the cost of borrowing,
pushed oil companies to reduce capital spending and postpone
projects, limiting prospects for production growth. The
financial crisis caused a drop in the value of all asset types,
including oil and gas companies, amid bearish market
sentiments and bleak revenues projections. This further
reduced oil and gas companies’ ability to use the capital
markets to raise financing and attract new investors.
The Organization of Petroleum Exporting Countries (OPEC)
was quick to react to the deteriorating market conditions. At
an extraordinary meeting held in October 2008, the
organization announced its intention to reduce supply by 1.5
million barrels per day starting from November 1, 2008, to
address the massive oversupply caused by the drop in demand
and the strong US dollar. 3 Eventually, OPEC agreed to a
further 2.5 million barrels per day reduction in supply during
their December 2008 meeting.4
1.2. US shale oil boom and the supply glut
The second price collapse in the 21st century was not driven by
a drop in demand but rather by a massive increase in supply
triggered by the development of the US shale oil. US shale oil
3. “150th (Extraordinary) Meeting of the OPEC Conference”, OPEC, October 24,
2008 (https://www.opec.org/opec_web/en/947.htm)
4. “151st (Extraordinary) Meeting of the OPEC Conference”, OPEC, December 17,
2008, (https://www.opec.org/opec_web/en/945.htm)
14production almost doubled from 2008 to 2014. Major
technological advancements in shale fracking and availability
of capital, allowing the economic development of tight oil
basins in the Lower-48 drove this growth.5
The economic recovery that followed the 2008 financial crisis
pushed oil prices on an upward trajectory. As oil prices
recovered and fluctuated between $90 and $125 per barrel,
over an extended period starting from the beginning of 2011,
both conventional and unconventional oil companies increased
capital spending on projects and drove production up. In the
US, shale oil production became profitable and started
attracting massive investments from companies of all sizes.
Driven by available financing, this “oil rush” allowed the US
to increase its oil supply by more than 4 million barrels per day
from 2008 to 2014 and reach 8.3 million barrels per day by the
end of 2014.6
5. Clifford Krauss, “U.S. Oil Prices Fall Below $80 a Barrel, New York Times
(archived), November 3, 2014
(https://web.archive.org/web/20141216205651/http://www.nytimes.com/20
14/11/04/business/energy-environment/us-oil-prices-fall-below-80-a-
barrel.html)
6. “Data Browser Total Energy”, US EIA, accessed on June 21, 2020
(https://www.eia.gov/totalenergy/data/browser/?tbl=T03.01#/?f=A&start=1
949&end=2019&charted=6-12-15)
15Figure 2: US Oil production – Thousands of barrels per day 7
Canada also quickly increased its production from its vast oil
sands reserve which, combined with its southern neighbor’s
production, added more supply to an already well-supplied
market. The lifting of sanctions on Iran, and the return of
Libyan production idled because of the unrest, also contributed
to the supply rise. Experts estimated that the global oil market
was oversupplied by as much as 2 million barrels per day at
the onset of the crisis. At the same time, oil demand growth
lost some of the pace it recorded in the first decade of the
century, driven by slower growth in emerging markets,
especially in Asia.
The combination of these factors sent oil prices again on a
downward spiral going from a high of $115 per barrel for Brent
by the middle of June 2014 to a low of $29 per barrel by the
7. Ibid
16middle of January 2016, a loss of 75 percent of the value of the
barrel over 19 months. During the same period, the OPEC
reference basket price went from $110 to $22 per barrel, a loss
of 80 percent in value, and less than one-sixth of its record high
of $141 per barrel in July 2008.8
This crisis proved to be a major setback for all industry
players. OPEC countries, especially in the Arabian Gulf
region, were impacted the most as their economies and
budgets depended heavily on oil receipts. This price
collapse lasted longer than the previous one. It was
structurally different from the advent of shale oil from the
US and the challenges it poses to OPEC’s ability to balance
oil markets and manage prices. It also meant that prices
could not recover to previous levels seen after the 2008
financial crisis as shale oil producers could quickly react to
the market and bring more production online.
Despite the decline in prices, OPEC decided not to curtail its
production and opted to preserve its market share over
balancing the oversupplied market, effectively letting prices
slide further and declaring a price war against the US shale oil.
OPEC members decided against any production cuts during
their November 2014 meeting and kept the cartel’s production
unchanged at 30 million barrels per day. It was until December
2016 that OPEC members and Russia agreed to coordinate
8. “OPEC Basket Price”, OPEC, accessed on June 21, 2020
(https://www.opec.org/opec_web/en/data_graphs/40.htm)
17efforts and reduce their output to balance the market.9 This is
the first time OPEC members agreed to such measures since
their decision to reduce output in December 2008.10 11
1.3. A price war amid Covid-19 pandemic
While the previous two price collapses did not surprise many
of the oil and gas industry experts, the current events created
an unprecedented global situation and sent the whole world in
uncharted waters. To contain the spread of the virus, and ease
the pressure on healthcare systems, draconian lockdown and
isolation measures were implemented. 12 These measures
confined hundreds of millions of people in their homes,
crippled air travel, and brought economic activities to a
standstill worldwide. This health crisis has a formidable
impact on the global economy and will cause the biggest
recession since the great depression.
9. “OPEC 171st Meeting concludes”, OPEC, November 30, 2016,
(https://www.opec.org/opec_web/en/press_room/3912.htm)
10. Stanley Reed, “Russia and Others Join OPEC in Rare, Coordinated Push to
Cut Oil Output”, New York Times, December 10, 2016
(https://www.nytimes.com/2016/12/10/business/russia-opec-saudi-arabia-
cut-oil-output.html)
11. Sam Meredith, “OPEC reaches agreement to cut oil production to 32.5
million barrels a day: Oil ministers”, CNBC, November 30, 2016
(https://www.cnbc.com/2016/11/30/opec-reportedly-reaches-agreement-to-
cut-oil-production.html)
12. “IMF World Economic Outlook April 2020: The Great Lockdown”, IMF,
April 2020
(https://www.imf.org/en/Publications/WEO/Issues/2020/04/14/weo-april-
2020)
18These lockdown measures and closure of borders in the face
of air traffic and the reduction in economic output caused a
massive decline in oil demand at a scale and speed never seen
before. The decline in demand started first in China and other
Asian markets in Q1 2020 as they were hit first by the virus at
the beginning of the year. Some experts estimated the drop in
oil demand in China to have reached around 3 million barrels
per day.13 The decline reached other regions during Q2 as the
virus spread quickly to almost every country in the world. The
International Energy Agency (IEA) estimated that global oil
demand has dropped by 29 million barrels per day in April as
the pandemic reached its peak in Europe and other countries.14
Q2 2020 demand is estimated to be about 20 million barrels
per day lower than last year, according to the IEA.15
With this backdrop of a major decline in demand and
uncertainty around recovery, major oil-producing countries
did not agree initially on a path forward regarding production
curtailment. Talks between OPEC member countries and
Russia in early March broke up without an agreement on
production cuts. Russia refused to agree with Saudi Arabia on
deeper cuts to stop the decline in prices, ending three years of
13. Alfred Cang, Javier Blas, Sharon Cho, “China oil demand has plunged 20%
because of the virus lockdown”, Bloomberg, February 3, 2020
(https://www.bloomberg.com/news/articles/2020-02-02/china-oil-demand-
is-said-to-have-plunged-20-on-virus-lockdown)
14. “Oil Market Report - April 2020”, IEA, April 2020
(https://www.iea.org/reports/oil-market-report-april-2020)
15. “Oil Market Report - May 2020”, IEA, May 2020
(https://www.iea.org/reports/oil-market-report-may-2020)
19cooperation within the OEPC+ group. Prices reacted
immediately with a 25 percent drop to $34 per barrel after the
talks ended on March 6, with Saudi Arabia announcing it
would increase production and that every OPEC country is free
to do so.16
Figure 3: Global GDP growth - IMF WEO June 202017
After starting the year at $69 per barrel, Brent price declined
to around $45 per barrel at the beginning of March and
reached $19 per barrel on April 21, its lowest level in
decades as the increase in production by several countries
16. Grant Smith, “OPEC output hit 30-year high during the Saudi-Russia price
war”, World Oil, May 1, 2020
(https://www.worldoil.com/news/2020/5/1/opec-output-hit-30-year-high-
during-the-saudi-russia-price-war)
17. “World Economic Outlook Update, June 2020”, IMF, June 2020
(https://www.imf.org/en/Publications/WEO/Issues/2020/06/24/WEOUpdate
June2020)
20during the month coincided with the highest demand drop as
a result of lockdown measures. Prices eventually started
recovering as OPEC, and non-OPEC countries reached an
agreement to curtail production on April 12; Brent price
reached around $40 per barrel during the first week of June.
The agreement will take effect from May 1, 2020, and called
for a reduction in output by 9.7 million barrel per day during
May and June, by 7.7 million barrel per day for the
following six months to December 31, 2020, and by 5.8
million barrels per day for a period of 16 months, from
January 1, 2021, to April 30, 2022.
During their June meeting, the OPEC+ group agreed to extend
the first phase to July with a reduction of 9.7 million barrels
per day. The organization also agreed on a mechanism for
countries that did not respect their reduction commitment
during May and June to compensate during July, August, and
September with larger cuts.18 The crisis will have a profound
impact on the oil and gas industry. The next section will cover
in greater detail the impact of the Covid-19 crisis on oil
markets and the oil industry.
18. “OPEC 179th Meeting of the Conference concludes”, OPEC, June 6, 2020
(https://www.opec.org/opec_web/en/press_room/5963.htm)
212. Impact of Covid-19 pandemic on oil markets
2.1. Unprecedented demand destruction
Despite a history filled with megacycles and major crises, the
Covid-19 pandemic has challenged the oil industry in an
unprecedented manner. Several key questions remain
unanswered; when will a vaccine be developed, and when will
the pandemic end? How long will it take for a full economic
recovery and a return to standard oil consumption patterns? No
one can give definitive answers at this stage, which increases
the uncertainty faced by oil companies.
As mentioned in the previous section, the lockdown measures
taken to stop the spread of the virus across the globe caused a
massive decline in oil demand. Transportation and aviation
fuels, representing about 52 percent of oil demand, were
particularly hit by these measures. The International Air
Transport Association (IATA) estimates that passenger traffic
in 2020, measure using the revenue passenger kilometer
indicator, will be about 55 percent lower than in 2019, with an
estimated 7.5 million flights canceled between January and
July 2020. 19 Google Covid-19 Community Mobility data
shows a massive drop in the movement of people across many
countries due to lockdown measures and closures of
19. “Economic Performance of the Airline Industry”, IATA, June 2020
(https://www.iata.org/en/iata-repository/publications/economic-
reports/airline-industry-economic-performance-june-2020-report/)
22workplaces, schools, commercial centers, and recreation
facilities and parks. Despite the reopening of economic
activities across several countries, Google June 27 data shows
that trips to retail and recreation were down 21 percent in
France, 29 percent in Spain, and 19 percent in the US
compared to the first six weeks of the year.20
According to the IEA’s June Oil Market Report, global oil
demand is expected to decline by 8.1 million barrels per day in
2020 compared to 2019, an improvement of 0.5 million barrels
per day from the May report. This improvement is driven by
growth in China’s mobility indicators, resulting in strong
demand in April and a rebound in demand in India during May.
Also, easing lockdown measures across large parts of the
world will improve demand outlooks during the second part of
the year.21
The US Energy Information Agency (EIA) estimates that
global oil demand will average 83.8 million barrels per day
during the second quarter of 2020, which 16.6 million barrels
per day lower compared to the same period last year. Demand
for the full year 2020 will be 8.3 million barrel per day lower
than last year as demand for oil products improves during the
second part of 2020. Oil demand in the US faced the same
plight; the EIA estimates that demand for liquid fuels in the
20. “Community Mobility Reports”, Google, accessed on June 27, 2020
(https://www.google.com/covid19/mobility/)
21. “Oil Market Report - June 2020”, IEA, June 2020
(https://www.iea.org/reports/oil-market-report-june-2020)
23US will average 15.7 million barrels per day in the second
quarter of 2020, a drop of 23 percent from the same period of
last year. Demand outlook will improve, and full-year demand
will reach 18.1 million barrels per day, one million barrels per
day less than 2019.22
2.2. OPEC and non-OPEC supply responses
On the supply side, the devastating decline in prices will curtail
capital spending for many years and reduce future production
growth. Cost-cutting measures will intensify as companies try
to conserve cash and survive this crisis. These measures
include a reduction in all forms of discretionary spending,
including capital expenditures, dividends, and new exploration
activities. This is especially critical for US Lower-48
companies whose ability to cut costs and manage this crisis
will be difficult. They have gone through severe cost-cutting
measures during the 2014-2016 price collapse and do not have
much room for more.
They are also heavily indebted and under increased pressure
from their investors to start generating positive returns. The
US Lower-48 shale oil supply will be massively challenged at
current price levels as companies cut their activity. This crisis
has had an immediate impact on US producers who had to
reduce their activities and production. The EIA reported that
US production dropped by 670,000 barrels per day in April and
22. “Short-Term Energy Outlook”, US EIA, June 2020
(https://www.eia.gov/outlooks/steo/archives/Jun20.pdf)
24a further 860,000 barrels per day in May. Production fell
another 220,000 barrels per day in June to reach around 10.98
million barrels per day.
Figure 4: US oil production – Million b/d 23
This response directly hurt oilfield services companies,
which provide services to US oil and companies on the
ground, including drilling and completion of wells. These
companies had to lower their rates during the 2014-16 oil
price collapse under pressure from oil and gas companies,
trying to reduce their costs. These companies do not have
room for any further cost reductions and were forced to
reduce headcounts, number of crews, and the number of
drilling rigs in operation. According to rig data from Baker
Hughes, the number of rigs in operation in the US went from
23. Emily Geary, “U.S. crude oil production in May has a record monthly
decrease”, Today in Energy - US EIA, August 4, 2020
(https://www.eia.gov/todayinenergy/detail.php?id=44616)
25796 during the first week of the year to 253 during the
second week of July 2020. These numbers were 1,075 and
954 during the same periods of 2019.
Figure 5: US weekly rig count 24
OPEC supply will also decline in the near term. After an
agreement with Russia and other non-OPEC countries,
supply from OPEC+ countries were set to decline by 9.7
million barrels per day during the three-month pardon from
May to July. The production adjustment is projected to
decrease to 7.7 million barrels per day for the rest of 2020
and 5.8 million barrels per day from January 2021 to April
2022.
24. “North America Rig Count”, Baker Hughes, accessed on July 7, 2020
(https://bakerhughesrigcount.gcs-web.com/na-rig-count)
262.3. Prices crush to unprecedented levels
Prices went crashing at an unprecedented speed. The
destruction in demand caused by lockdown measures and
closures of economic activities, and the OPEC+ group’s
failure to reach an agreement initially on supply curtailment,
sent prices dwindling during March and reaching their
lowest levels in decades during April. Brent went from
$69/bbl on January 6, 2020, to a low of $19/bbl on April 21,
2020, amid a glut in supply and a massive drop in demand
caused by worldwide confinement measures to counter the
spread of the virus. The WTI has the same pattern starting
the year at $61/bbl and dropping to $18/bbl at the end of the
third week of April before dropping below zero for the first
time in history and closing at negative $38/bbl on April 20,
2020, the last day to settle May contracts. A combination of
weak demand and storage at near capacity pushed traders to
pay buyers to accept deliveries of oil in May. The next day
WTI went up to $10/bbl and closed the month of April at
$19/bbl.
The OPEC+ agreement to curtail production from the start of
May, and the quick response from US producers, helped prices
start a slow recovery to reach an average of $40/bbl during the
first half of July.
27Figure 6: Brent and WTI prices25
2.4. A massive drop in oil companies’ valuation
While the oil and gas industry were deemed essential and kept
operating during the pandemic, it faced the same operational
challenges as all other industries. Implementation of new
hygiene and social distancing measures meant that some
operating sites had to operate at reduced capacities while
some construction sites were closed altogether. The global
disruption in supply chains caused severe delays to or
cancellation of project construction and planned
maintenance. These two factors increased the cost of doing
25. “Markets Insider Oil (WTI) In USD – Historical Prices”, Business Insider,
accessed on July 19, 2020, (https://markets.businessinsider.com/
commodities/historical-prices/oil-price/usd/1.1.2006_20.7.2020?type=wti)
28business for oil and gas companies.26 27 More importantly, oil
and gas companies share prices have been on a downward
trend since the beginning of the year. Still, they collapsed
immediately after the massive drop in prices that followed the
failure of the OPEC+ agreement on production curtailment in
early March. Shell, Exxon, BP, and other independent
producers’ share prices dropped below the levels reached
during the 2008-2009 oil crisis.
This massive drop in oil prices, and share prices of oil and gas
companies, resulted in an enormous reduction in revenues and
companies’ valuations. Oil and gas companies responded by
reducing capital spending to conserve cash and survive this
crisis. According to Rystad Energy, global spending on oil and
gas projects will decline this year by more than 75 percent
from 2019 levels. 28
Oil and gas companies operating in the US Lower-48 have
suffered considerably from the massive decline in oil prices
26. “International: The Impact of COVID-19 on the Oil & Gas Industry”, Baker
Mackenzie, April 29, 2020 (https://insightplus.bakermckenzie.com/
bm/energy-mining-infrastructure_1/international-the-impact-of-covid-19-
on-the-oil-gas-industry_2)
27. Ruth Strachan, “Covid-19 creates supply and demand crisis for oil and gas”,
Offshore Technology, April 28, 2020 (https://www.offshore-
technology.com/investment/covid-19-creates-supply-and-demand-crisis-for-
oil-and-gas/)
28. “Oil & gas project sanctioning in 2020 set to fall by more than 75% despite
activity in Norway, Russia”, Rystad Energy, July 17, 2020
(https://www.rystadenergy.com/newsevents/news/press-releases/oilgas-
project-sanctioning-in-2020-set-to-fall-by-more-than-75pct-despite-activity-
in-norway-russia/)
29and fuel demand. They are heavily indebted and are unable to
service their debt payment despite the reduction in capital
spending. Several of them had to file for bankruptcy.
Chesapeake, a pioneer shale oil and gas producer, filed for
Chapter 11 protection on June 28 as the company was no
longer able to service its debt. There were 28 more exploration
and production and oil services companies that either filed for
bankruptcy or defaulted on their debt payment as of June 4,
according to an analysis by S&P Global Platts.29
Oil majors have also felt the pain of lower prices and subdued
demand. On June 30, Shell announced it would incur
impairments and write-offs of assets during the second quarter
of 2020 worth between $15-$22 billion citing Covid-19-
induced decline in oil demand and a weak outlook for energy
prices. BP has also announced it would incur non-cash
impairment charges in the second quarter in the range of $13-
$17.5 billion.
29. Matthew Andre, “Spotlight: US oil and gas companies file for bankruptcy
amid depressed prices”, S&P Global Platts, June 12, 2020
(https://www.spglobal.com/platts/en/market-insights/latest-
news/oil/061120-upstream-us-bankruptcies-analytics-spotlight)
30Figure 7: BP, Exxon, Shell, and S&P 500 share prices 30, 31, 32
3. Oil markets in a post-Covid world
3.1.The short-term outlook is uncertain and will depend on
the state of the pandemic
While oil prices are on a slow recovery from their lowest levels
reached around the middle of April and are hovering around
$40/bbl since June 2020, the oil industry’s short-term outlook
is still uncertain at this time. The increase in the number of new
cases across many countries and the possibility of a second and
third wave of new infections means the pandemic is far from
30. Historical prices, Yahoo Finance, accessed on July 20, 2020
(https://finance.yahoo.com/quote/XOM/history?p=XOM)
31. Historical prices, Yahoo Finance, accessed on July 20, 2020
(https://finance.yahoo.com/quote/BP/history?p=BP)
32. Historical prices, Yahoo Finance, accessed on July 20, 2020
(https://finance.yahoo.com/quote/RDS-B?p=RDS-B&.tsrc=fin-srch)
31being under control. Further economic ramifications are still a
strong possibility. The depth and duration of this crisis are still
unknown. Questions remain unanswered regarding the end of
the pandemic; will an effective vaccine be developed anytime
soon? Will the world adjust to a new normal?
The IMF has reduced its forecast for economic growth in 2020
and 2021 and expects a more gradual economic recovery than
previously forecast. In its June World Economic Outlook, the
IMF expects the global economy to contract by 4.9 percent in
2020, followed by a growth of 5.4 percent in 2021 compared
to the institution’s April forecast of 3 percent in 2020, and a
growth of 5.8 percent in 2021.33 The OECD forecasts a bigger
economic contraction of 6 percent in 2020 and 7.6 percent
under the organization’s double-hit scenario, which considers
another wave of infection before the end of 2020, pushing
governments to implement new lockdown measures.34 In both
scenarios, the global economy will not get back to Q4 2019
level for at least two years. In any case, both organizations
stated that uncertainty around their forecasts remains much
higher than usual.
Demand for oil, which is directly linked to economic activity,
will follow the same path of gradual and slow recovery and is
33. “World Economic Outlook Update, June 2020”, IMF, June 2020
(https://www.imf.org/en/Publications/WEO/Issues/2020/06/24/WEOUpdate
June2020 )
34. “OECD Economic Outlook, June 2020 - The world economy on a tightrope”,
OECD, June 2020 (https://www.oecd.org/economic-outlook/june-
2020/#Global-outlook)
32equally uncertain. In its July Short-Term Energy Outlook, the
US EIA forecast that global oil demand will average 92.9
million b/d in 2020, a drop of 8.1 million b/d from 2019, and
99.9 million b/d in 2021. Oil demand will start recovering in
Q3 2020 and continue increasing in 2021.
Figure 8: Monthly oil demand - million b/d 35
The US EIA forecasts H2 2020 oil demand to be 6.2 million
b/d higher than in H1 2020, driven by an increase in
transportation fuels after the relaxation of lockdown measures
and a gradual return of economic activity. However, jet fuel
demand will remain subdued as the airline industry struggles
with weak air travel demand. The IEA forecast is slightly
35. “Short-term Energy Outlook data browser”, US EIA, accessed on July 20,
2020
(https://www.eia.gov/outlooks/steo/data/browser/#/?v=6&f=M&s=0&ctype
=linechart&maptype=0)
33lower than the US EIA’s with oil demand of 92 million b/d and
97.4 million b/d in 2020 and 2021, respectively.36
Figure 9: Global oil demand - million b/d 37, 38, 39
On the supply side, the short-term outlook depends on two key
factors. The first is the ability of the OPEC+ group to maintain
supply discipline and for its members to adhere to their share
of production cuts agreed upon in April 2020. The second is
36. “Oil Market Report – July 2020”, IEA, July 2020
(https://www.iea.org/reports/oil-market-report-july-2020)
37. Ibid
38. “Short-term Energy Outlook data browser”, US EIA, accessed on July 20,
2020
(https://www.eia.gov/outlooks/steo/data/browser/#/?v=6&f=M&s=0&ctype
=linechart&maptype=0)
39. “OPEC monthly oil market report”, OPEC, July 14, 2020
(https://www.opec.org/opec_web/static_files_project/media/downloads/publ
ications/OPEC_MOMR_July_2020.pdf)
34how the US Lower-48 shale oil industry will respond to this
crisis and the resulting level of production destruction amid
low oil prices and increased financial distress for many
companies operating in the shale industry.
In response to the massive decline in demand and oil
prices, the OPEC+ group agreed during its April meeting
to curtail production up to April 30, 2022. The cuts started
at 9.7 million b/d for the first three months, 7.7 million b/d
to the end of 2020, and 5.8 million b/d from January 2021
to the end of April 2022. This agreement will remain
critical to balancing the market, and its success will depend
on the degree of conformity of all members, especially
some non-OPEC countries, including Russia 40 . So far,
OPEC has reported more than 100 percent conformity to
the terms of the declaration of cooperation during June.
However, the level of conformity will be closely followed
as history has shown that some countries did not always
adhere to their quotas.
40. Gaurav Sharma, “Why OPEC+ oil production cut agreed under Covid-19
stress is destined to fall apart”, June 4, 2020
(https://www.forbes.com/sites/gauravsharma/2020/06/04/why-opec-oil-
production-cut-agreed-under-covid-19-stress-is-destined-to-fall-apart-russia-
saudi-arabia/#721ef13e6422)
35Figure 10: Global oil supply - million b/d 41
The US shale oil industry’s short-term outlook is one of
increased financial distress, activity and production reduction,
job losses, and potentially more bankruptcies. The industry
does not have much room to cut costs and will be forced to
reduce activities and improve capital discipline. After a quick
response to declining prices and demand, production from the
Lower-48 will continue on a steady decline to the third quarter
of next year, and potentially beyond.
41. Ibid
36Figure 11: US oil supply - million b/d 42
On the corporate side, oil and gas companies will reevaluate their
portfolios and concentrate on their best assets. Cash conservation
and survival through a period of low prices, will be the main
priority for many oil and gas companies, especially those with
high costs and a heavy debt burden. A massive reduction in oil
and gas capital spending will be seen across all regions except in
Norway and Russia, where several projects are ongoing. The
situation will be even more challenging in the US as several
companies will not be able to cover costs, service debt at prices
around $40/bbl, and will not easily have access to financing. The
wave of bankruptcies, marginal asset divestitures, and further
consolidation will continue to be a hot topic in the US.
42. “Short-term Energy Outlook data browser”, US EIA, accessed on July 20,
2020
(https://www.eia.gov/outlooks/steo/data/browser/#/?v=6&f=M&s=0&ctype
=linechart&maptype=0)
37Because of their diversified portfolio, oil majors will be able
to mitigate the effects of this crisis better but will have to incur
write-offs and impairments of their assets. National oil
companies (NOC), which are major contributors to their
respective countries’ budgets, will see their revenues drop
from low prices and cuts in their production following the
OPEC+ April agreement.
On the price side, major oil research companies and banks
predict prices will go through a slow recovery from their
lowest levels in April, but they won’t return to their pre-Covid-
19 levels anytime soon. The US EIA expects Brent prices to
reach the mid-forties by the end of 2020 and average $49.6/bbl
for 2021, about $15/bbl lower than the 2019 average. WTI
price is forecast to average $37.7/bbl in 2020 and $45.6/bbl in
2021, $14/bbl below the 2019 average, following the same
pattern as Brent price.43 The uncertainty around the recovery
in demand amid an increase in new Covid-19 cases across
many countries and the prospects for a new wave to lockdown
measures make these price forecasts very risky. Any new
measures to curtail movement and economic activities in case
of further uncontrolled spread will hurt demand and negatively
impact prices. Similarly, OPEC members’ lack of discipline to
adhere to their quotas and increase in non-OPEC production as
prices recover could also negate the recent gains in prices and
subdue the price outlook.
43. “Short-term Energy Outlook”, US EIA, July 2020 (https://www.eia.gov/
outlooks/steo/archives/Jul20.pdf)
38Figure 12: WTI and Brent Oil prices - $/bbl44
3.2. Long-term outlook: Resilience amid increasing
headwinds
Oil will continue to play an essential role in the energy mix for
many decades to come. Industry experts agree that despite
accelerating energy transition forces and increasing alternative
sources of energy, oil demand will persist well into the 2030-
40s. It could go even beyond these years, according to some
energy experts. Peak oil, although not a topic of consensus
among energy experts, may not happen before the late-2030’s
early 2040’s at the earliest, according to many energy analysts.
Despite the massive pandemic-induced drop in demand this
year, oil demand is set to recover to 2019 levels by the end of
2021 gradually. The US EIA expects global oil demand to
44. Ibid
39reach 101.9 million barrels per day in December 2021
compared to an average of 101 million barrels per day in 2019.
Beyond that, oil demand will continue to grow but at a slower
rate, driven by slowing demand growth for transportation
fuels. Petrochemicals will be the force behind the growth in
demand and will balance the deceleration of demand growth
in the transportation sector.
According to the IEA, the petrochemical industry will be
responsible for almost half of the growth in oil demand
through 2025.45 It will continue to be the gem of the industry
and will be the most important driver of demand in the next
decades. The sector ensures the generation of the highest value
from each barrel of oil. It also insulates oil demand from the
effect of the energy transition and efficiency gains in industry,
power generation, and transportation. China and India will
continue to drive demand growth through the mid-term; the
IEA expects these two countries to account for close to half the
demand growth through to 2025.46
Beyond that, emerging markets, led by India, will be the
driving force behind oil demand growth driven by a massive
increase in the middle class. Demand in OECD countries will
start a slow and steady decline by the mid-2020s driven by
effects of the energy transition and national policies on
efficiency. Because of a massive increase in population, Africa
will increase its consumption of oil across all sectors.
45. “Oil 2020”, IEA, March 2020 (https://www.iea.org/reports/oil-2020)
46. Ibid
40While the effects of the Covid-19 pandemic on demand were
almost immediate and short-lived as demand is expected to
recover within the next year, oil supply will be affected for
much longer. A massive drop in capital spending to conserve
cash amid low prices and postponement of major projects will
limit supply growth. This is the case for the US, where
production will eventually start growing but at a much slower
pace than it did during the last few years. Despite the OPEC+
agreement to curtail production through the end of 2022, the
oil market will be well supplied in the medium term. However,
as demand returns and supply from non-OPEC countries
increases at a slower pace, OPEC countries may not have to
curtail output to balance the market. However, the degree of
adherence of OPEC+ countries to their quotas will remain the
key challenge considering prices recover to levels that
encourage an increase in production from non-OPEC
countries.
The US oil industry has suffered from the Covid-19-induced
price collapse and will come out of this crisis quite differently.
Bankruptcies and the subsequent restrictions will allow
companies with good assets to emerge stronger and leaner with
low production costs and lower debt burdens. Consolidation,
especially in the US, will result in stronger, larger, and more
resilient companies able to survive future crises and quickly
respond to market fluctuations.
Energy transition and environmental challenges will intensify
pushing oil companies to adjust their business models and
41optimize their portfolios. We’ve already seen this in action as
major oil and gas companies acquire power and energy
companies and try to position themselves as integrated energy
companies rather than oil and gas companies only. These
acquisitions have included companies operating in solar, wind,
energy storage, new technologies, mobility, digital, and
efficiency.47 Shareholder activism will intensify as investors
ask for environmental stewardship from the oil and gas
companies.
Decarbonization will be a much more pressing concern for oil
companies who have to optimize their business models and
find a way to embrace the changes caused by the energy
transition. Several major oil and gas companies have set target
dates to achieve their goal of carbon neutrality. The first was
Spanish Repsol, which announced its intention to reach this
goal by the end of 2019. Shell and BP followed suit with the
same target date, while Lundin Energy announced it wanted to
achieve carbon neutrality by 2030.
Capital investment discipline and cost efficiency will be the
mantra of oil and gas companies in the post-Covid-19 era.
Reduction in the cost structure of oil and gas companies in the
short and long-term is vital for their ability to survive the
uncertainty and increased pressure from competitive sources
47. Timothy Abington, Kelly Gilblom, “Shell Leads Big Oil in the Race to Invest
in Clean Energy”, Bloomberg, September 4, 2019
(https://www.bloomberg.com/news/articles/2019-09-04/shell-leads-big-oil-
in-the-race-to-invest-in-clean-energy-tech)
42of energy. These companies will have to focus on their best
assets and will favor short-cycle oil and gas development.
NOCs will continue to be the cash cows for their respective
governments and will have a tougher job balancing market
share conservation and supply discipline to support prices.
They will have to accelerate strategic partnerships with key
customers to ensure a market share for their oil and focus on
petrochemicals domestically and overseas to increase the value
generated from each barrel of oil.
43Conclusion
The oil industry is no stranger to price crises and challenges
from several fronts. It faced several crises that pushed the
industry to look for new ways to conduct business and adapt
to changing conditions in the past and continue to do so in the
future. However, this latest Covid-induced crisis came when
the industry is dealing with increased shareholder activism and
strong pressure on the environmental front, demanding oil and
gas companies to commit to aggressive environmental goals.
The industry has not faced this situation in the past and could
be the catalyst that accelerates the transformation it has started
to go through.
Oil companies have to navigate and manage an uncertain
future as oil and gas projects will be riskier to develop as they
face challenges in every step of the process and consequently
require a higher rate of return. They will have to diversify their
portfolios and continue shifting toward an integrated energy
business model that embraces the changes caused by the
energy transition and the growth in renewable and new
technologies.
45References
“Markets Insider Oil (Brent) In USD – Historical Prices”, Business Insider,
accessed on July 19, 2020 from (https://markets.businessinsider.com/
commodities/historical-prices/oilprice/usd/ 1.1.2006_19.7.
2020?type=brent)
“Well Prepared”, The Economist Print Edition (Archived), November 06,
2008. Retrieved from (https://web.archive.org/web/20081109045746
/http://www.economist.com/finance/displaystory.cfm?story_id=12564
013)
“Monthly Oil Market Report December 2008”, OPEC, December 2008.
Retrieved from
(https://www.opec.org/opec_web/static_files_project/media/
downloads/publications/MR122008.pdf
“150th (Extraordinary) Meeting of the OPEC Conference”, OPEC, October
24, 2008. Retrieved from
(https://www.opec.org/opec_web/en/947.htm)
“151st (Extraordinary) Meeting of the OPEC Conference”, OPEC,
December 17, 2008. Retrieved from (https://www.opec.org/opec_
web/en/945.htm)
Clifford Krauss, “U.S. Oil Prices Fall Below $80 a Barrel, New York Times
(archived), November 3, 2014. Retrieved from
(https://web.archive.org/web/20141216205651/http://www.nytimes.
com /2014/11/04/business/energy-environment/us-oil-prices-fall-
below-80-a-barrel.html)
“Data Browser Total Energy”, US EIA, accessed on June 21, 2020.
Retrieved from (https://www.eia.gov/ totalenergy/data/browser/?tbl=
T03.01#/?f=A&start=1949&end=2019&charted=6-12-15)
“OPEC Basket Price”, OPEC, accessed on June 21, 2020. Retrieved from
(https://www.opec.org/opec_ web/en/data_graphs/40.htm)
“OPEC 171st Meeting concludes”, OPEC, November 30, 2016. Retrieved
from (https://www.opec.org/ opec_ web/en/press_room/3912.htm)
Stanley Reed, “Russia and Others Join OPEC in Rare, Coordinated Push to
Cut Oil Output”, New York Times, December 10. 2016. Retrieved
47from (https://www.nytimes.com/2016/12/10/business/russia-opec-
saudi-arabia-cut-oil-output.html)
Sam Meredith, “OPEC reaches agreement to cut oil production to 32.5
million barrels a day: Oil ministers”, CNBC, November 30, 2016.
Retrieved from (https://www.cnbc.com/2016/11/30/opec-reportedly-
reaches-agreement-to-cut-oil-production.html)
“IMF World Economic Outlook April 2020: The Great Lockdown”, IMF,
April 2020. Retrieved from
(https://www.imf.org/en/Publications/WEO/ Issues/2020/04/14/weo-
april-2020)
Alfred Cang, Javier Blas, Sharon Cho, “China oil demand has plunged 20%
because of the virus lockdown”, Bloomberg, February 3, 2020.
Retrieved from (https://www.bloomberg.com/news/ articles/2020-
02-02/china-oil-demand-is-said-to-have-plunged-20-on-virus-
lockdown)
“Oil Market Report - April 2020”, IEA, April 2020. Retrieved from
(https://www.iea.org/reports/oil-market-report-april-2020).
“Oil Market Report - May 2020”, IEA, May 2020. Retrieved from
(https://www.iea.org/reports/oil-market-report-may-2020).
“World Economic Outlook Update, June 2020”, IMF, June 2020. Retrieved
from (https://www.imf.org/ en/Publications/WEO/Issues/2020/06/24
/WEOUpdateJune2020)
Grant Smith, “OPEC output hit 30-year high during the Saudi-Russia price
war”, World Oil, May 1, 2020. Retrieved from
(https://www.worldoil.com/news/2020/5/1/opec-output-hit-30-year-
high-during-the-saudi-russia-price-war)
“OPEC 179th Meeting of the Conference concludes”, OPEC, June 6, 2020.
Retrieved from
(https://www.opec.org/opec_web/en/press_room/5963.htm)
“Economic Performance of the Airline Industry”, IATA, June 2020. Retrieved
from (https://www.iata.org /en/iata-repository/publications/ economic-
reports/airline-industry-economic-performance-june-2020-report/)
“Community Mobility Reports”, Google, accessed on June 27, 2020.
Retrieved from (https://www.google. com/covid19/mobility/)
“Oil Market Report - June 2020”, IEA, June 2020. Retrieved from
(https://www.iea.org/reports/oil-market-report-june-2020)
48“Short-Term Energy Outlook”, US EIA, June 2020. Retrieved from
(https://www.eia.gov/outlooks/ steo/archives/Jun20.pdf)
“North America Rig Count”, Baker Hughes, accessed on July 7, 2020.
Retrieved from (https://bakerhughesrigcount.gcs-web.com/na-rig-
count)
Emily Geary, “U.S. crude oil production in May has a record monthly
decrease”, Today in Energy - US EIA, August 4, 2020. Retrieved
from (https://www.eia.gov/todayinenergy/detail.php?id=44616)
“Markets Insider Oil (WTI) In USD – Historical Prices”, Business Insider,
accessed on July 19, 2020, from (https://markets.businessinsider.com/
commodities/historical-prices/oil-price/usd/1.1.2006_20.7.2020?
type=wti)
“International: The Impact of COVID-19 on the Oil & Gas Industry”,
Baker Mackenzie, April 29, 2020 from
(https://insightplus.bakermckenzie.com/bm/energy-mining-
infrastructure_1/international-the-impact-of-covid-19-on-the-oil-
gas-industry_2)
Ruth Strachan, “Covid-19 creates supply and demand crisis for oil and
gas”, Offshore Technology, April 28, 2020 from
(https://www.offshore-technology.com/investment/covid-19-creates-
supply-and-demand-crisis-for-oil-and-gas/)
“Oil & gas project sanctioning in 2020 set to fall by more than 75% despite
activity in Norway, Russia”, Rystad Energy, July 17, 2020 from
(https://www.rystadenergy.com/newsevents/news/press-
releases/oilgas-project-sanctioning-in-2020-set-to-fall-by-more-
than-75pct-despite-activity-in-norway-russia/)
Matthew Andre, “Spotlight: US oil and gas companies file for bankruptcy
amid depressed prices”, S&P Global Platts, June 12, 2020 from
(https://www.spglobal.com/platts/en/market-insights/latest-
news/oil/061120-upstream-us-bankruptcies-analytics-spotlight)
Historical prices, Yahoo Finance, accessed on July 20, 2020 from
(https://finance.yahoo.com/quote/ XOM/history?p=XOM)
Historical prices, Yahoo Finance, accessed on July 20, 2020 from
(https://finance.yahoo.com/quote/ BP/history?p=BP)
Historical prices, Yahoo Finance, accessed on July 20, 2020 from
(https://finance.yahoo.com/quote /RDS-B?p=RDS-B&.tsrc=fin-srch)
49“World Economic Outlook Update, June 2020”, IMF, June 2020 from
(https://www.imf.org/en/
Publications/WEO/Issues/2020/06/24/WEOUpdateJune2020)
“OECD Economic Outlook, June 2020 - The world economy on a
tightrope”, OECD, June 2020 from (https://www.oecd.org/economic-
outlook/june-2020/#Global-outlook)
“Short-term Energy Outlook data browser”, US EIA, accessed July 20,
2020 from (https://www.eia.gov/
outlooks/steo/data/browser/#/?v=6&f=
M&s=0&ctype=linechart&maptype=0)
Gaurav Sharma, “Why OPEC+ oil production cut agreed under Covid-19
stress is destined to fall apart”, June 4, 2020 from
(https://www.forbes.com/ sites/gauravsharma/2020/06/04/why-opec-
oil-production-cut-agreed-under-covid-19-stress-is-destined-to-fall-
apart-russia-saudi-arabia/#721ef13e6422)
“Short-term Energy Outlook”, US EIA, July 2020 from
(https://www.eia.gov/outlooks/steo/archives /Jul20.pdf)
“Oil 2020”, IEA, March 2020 from (https://www.iea.org/reports/oil-2020)
Timothy Abington, Kelly Gilblom, “Shell Leads Big Oil in the Race to
Invest in Clean Energy”, Bloomberg, September 4, 2019 from
(https://www.bloomberg.com/news/articles/2019-09-04/shell-leads-
big-oil-in-the-race-to-invest-in-clean-energy-tech)
50About the Author
Mohammed Hamdaoui
Mohammed Hamdaoui is a member of the Economic Studies
Department at the TRENDS Research & Advisory. He is an
expert in energy, metals, and mining industry with over 15
years of experience analyzing different aspects of the industry,
including supply and demand, price forecasting, cost analysis,
resources monetization, market studies, and natural resources
strategies. He conducts economic analysis of different
industries and participates in various studies spanning multiple
sectors.
Before joining TRENDS, Mohammed was an Energy
Researcher at the ECSSR, a Research Director, Commodities
Analytics, at Wood Mackenzie, a Planning and Financial
Analysis Manager at AAEC, and Business Development
Analyst at Syntroleum. He started his career at Unilever as an
IT Project Manager. Mohammed has worked and managed
teams in four different continents. He earned a
Bachelor’s/Master’s degree in software engineering from
Ecole Mohammedia des Ingénieurs in Morocco, and an MBA
and an MS-MIS from the University of Oklahoma.
Mohammed is fluent in Arabic, French, and English.
51You can also read