Characterizing rumen microbiota and CAZyme profile of Indian dromedary camel (Camelus dromedarius) in response to different roughages - Nature
←
→
Page content transcription
If your browser does not render page correctly, please read the page content below
www.nature.com/scientificreports
OPEN Characterizing rumen microbiota
and CAZyme profile of Indian
dromedary camel (Camelus
dromedarius) in response
to different roughages
Ankit T. Hinsu1, Nilam J. Tulsani1, Ketankumar J. Panchal1, Ramesh J. Pandit1,
Basanti Jyotsana2, Nishant A. Dafale3, Niteen V. Patil2,3, Hemant J. Purohit4,
Chaitanya G. Joshi1,5 & Subhash J. Jakhesara1*
In dromedary camels, which are pseudo-ruminants, rumen or C1 section of stomach is the main
compartment involved in fiber degradation, as in true ruminants. However, as camels are adapted
to the harsh and scarce grazing conditions of desert, their ruminal microbiota makes an interesting
target of study. The present study was undertaken to generate the rumen microbial profile of Indian
camel using 16S rRNA amplicon and shotgun metagenomics. The camels were fed three diets differing
in the source of roughage. The comparative metagenomic analysis revealed greater proportions
of significant differences between two fractions of rumen content followed by diet associated
differences. Significant differences were also observed in the rumen microbiota collected at different
time-points of the feeding trial. However, fraction related differences were more highlighted as
compared to diet dependent changes in microbial profile from shotgun metagenomics data. Further,
16 genera were identified as part of the core rumen microbiome of Indian camels. Moreover, glycoside
hydrolases were observed to be the most abundant among all Carbohydrate-Active enzymes and were
dominated by GH2, GH3, GH13 and GH43. In all, this study describes the camel rumen microbiota
under different dietary conditions with focus on taxonomic, functional, and Carbohydrate-Active
enzymes profiles.
Camels are characterized by the presence of one or more distinctive fatty deposits known as “humps” on their
back. Fats stored in the humps are metabolized in the absence of food and water for longer p eriods1. It also helps
camels to survive in harsh environments of arid, semi-arid, deserts and mountains. Camels are adapted to survive
in wide temperature ranges, poor grazing conditions and scarcity of water. Furthermore, it is believed that certain
physiological traits allow the camels to survive on a wide variety of vegetation available in the deserts including
low-quality diet, salt-tolerant vegetation, and thorny plants2,3. However, the digestive system of camel differs
from other herbivores like cattle and sheep (also known as true ruminant), as camels are pseudo-ruminants and
have three-chambered stomach with no omasum4. Nonetheless, rumen is the main chamber responsible for
fermentation of all ingested plant material in ruminants as well as camels. The rumen is a complex ecosystem
containing a wide diversity of prokaryotic (bacteria and archaea) and eukaryotic (fungi and protozoa) micro-
organisms interacting synergistically to ferment plant structural and non-structural carbohydrates and proteins5.
Conventional culture-based methods are the gold standard to study and isolate rumen microorganisms. How-
ever, molecular techniques like metagenomics have gained immense popularity with advancement in sequenc-
ing technologies5,6. Metagenomics involves direct study of microbiome by the means of sequencing its genetic
material thereby bypassing the need of traditional culturing. Metagenomics has been extensively used to study
1
Department of Animal Biotechnology, College of Veterinary Science & A.H., Anand Agricultural University,
Anand 388001, India. 2ICAR-National Research Centre On Camel, Bikaner 334001, India. 3ICAR-Central Arid Zone
Research Institute, Jodhpur 342003, India. 4Environmental Biotechnology and Genomics Division, CSIR-National
Environmental Engineering Research Institute, Nagpur 440020, India. 5Gujarat Biotechnology Research Centre,
Gandhinagar 382010, India. *email: drsubhash81@gmail.com
Scientific Reports | (2021) 11:9400 | https://doi.org/10.1038/s41598-021-88943-9 1
Vol.:(0123456789)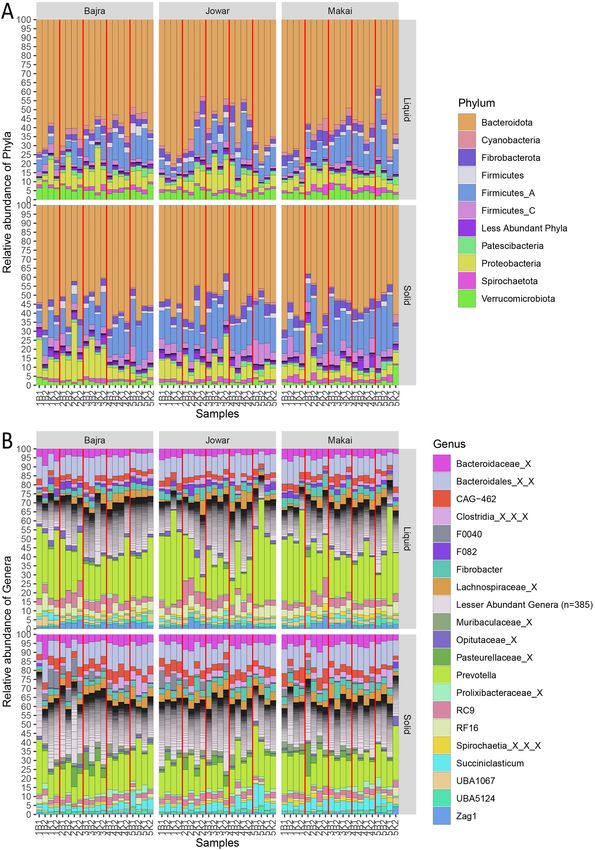
www.nature.com/scientificreports/
microbiota of gut/rumen/caeca using various a pproaches7–10. 16S rRNA gene is present universally in all the
prokaryotes making it an ideal target for diversity studies. Additionally, good resources in form of databases are
also available for 16S rRNA gene. Therefore, the partial or full 16S rRNA gene sequencing has been a mainstay
of sequence based bacteriome profiling for decades.
The studies involving the camel rumen microbiome are handful as compared to other ruminants. To name a
few, previous studies on dromedary camel rumen microbiome employed 16S rRNA based a pproaches8,11–13 as well
as shotgun metagenomics a pproach14. These studies have explored microbiota under different feeding conditions
from free ranging and controlled environments. The present study was undertaken with the aim of character-
izing the microbiota of camel rumen when fed with different roughage feeds namely Bajra, Jowar and Makai
(Figure S1). These feeds have varying levels of lignocellulosic content and are used locally and traditionally as feed
roughages. Two prominent Indian camel breeds were fed three different roughage and rumen content samples
were collected across the period of 9 weeks. Further, 16S rRNA amplicon sequencing and shotgun metagenomics
were used for phylogenetic and functional profile characterization of rumen microbial communities, respectively.
Results
In total, 5.16 Gb of 16S amplicon sequencing data containing 10.2 million paired-end reads was generated from
120 samples. After all steps of DADA2 pipeline, 6.51 million clean paired-reads (63.75% of reads generated)
with an average of 54,290 paired-reads per sample were assigned to 14,978 ASVs (Amplicon Sequence Variants)
(Table S1). After filtering out ASVs present in 5 or less samples or having count of 5 or less, the remaining 4,794
ASVs were further analyzed using Phyloseq and other R packages.
Diversity of communities. Alpha diversity measures (Observed ASV and Shannon index) were calculated
and compared to evaluate differences among the groups. Observed ASVs ranged from 356 to 2,250 with signifi-
cant differences among liquid and solid fraction samples (Kruskal–Wallis, BH p-value = 0.026) and five collec-
tions (Kruskal–Wallis, BH p-value < 0.0001), while no significant differences observed between different feeds
(Kruskal–Wallis, BH p-value = 0.83) and different breeds (Kruskal–Wallis, BH p-value = 0.38) (Fig. 1). Signifi-
cant differences were also observed among collections within JS (JowarSolid) (Wilcoxon-test p-value = 0.036),
BS (BajraSolid) (Wilcoxon-test p-value = 0.036) and ML (MakaiLiquid) (Wilcoxon-test p-value = 0.036) groups.
On the other hand, Shannon diversity index ranged from 5.32 to 6.72 and differed significantly among col-
lections within BL (Wilcoxon-test p-value = 0.037), BS (Wilcoxon-test p-value = 0.044) and ML (Wilcoxon-
test p-value = 0.044) groups (Fig. 1). Significant differences (Wilcoxon-test p-value < 0.05) were also observed
between Collection-4 and Collection-5 of BS (BajraSolid) and Collection-2 and Collection-3 of MS (MakaiSolid)
groups. However, similar to Observed ASVs, significant differences were observed in Shannon index between
different fractions (Kruskal–Wallis, BH p-value = 0.046) and collections (Kruskal–Wallis, BH p-value < 0.0001),
but not among different feeds (Kruskal–Wallis, BH p-value = 0.83) and different breeds (Kruskal–Wallis, BH
p-value = 0.2) as in Observed ASVs.
Highly significant community level differences were observed between Fraction (PERMANOVA
p-value < 0.001), Collection (PERMANOVA p-value < 0.001) and feed (PERMANOVA p-value < 0.001)
based on the Bray–Curtis distances while less significant changes were contributed by breed (PERMANOVA
p-value = 0.037) (Table 1). Structural similarities of these communities were visualized through NMDS (non-
metric multidimensional screening) plot based on Bray–Curtis distance (Fig. 2). A clear separation of groups
forming Liquid–Solid fractions and 5 collections were observed. Further, feed and collection were the most
significant factors within liquid and solid fraction samples. Similarly, fraction and collection were the most
significant factors within samples of each feed.
Dietary effect on microbial taxa. A total of 28 phyla were observed comprising 309 annotated genera,
with 10 phyla having an average relative abundance greater than 1%. Bacteroidota (average rel. abundance:
58.2%), Firmicutes_A (13.4%), Proteobacteria (7.9%), Fibrobacterota (3.8%), Firmicutes_C (3.6%) and Ver-
rucomicrobiota (3.3%) were some of the most abundant phyla (Fig. 3). While, Prevotella (phylum:Bacteroidota,
22.3%), CAG-462 (Bacteroidota, 3.8%), RC9 (Bacteroidota, 3.8%), Fibrobacter (Fibrobacterota, 3.7%), Succini-
clasticum (Firmicutes, 2.8%), RF16 (Bacteroidota, 2.8%), Zag1 (Cyanobacteria, 1.5%), UBA5124 (Patescibacte-
ria, 1.4%), UBA1067 (Verrucomicrobiota, 1.3%), F0040 (Bacteroidota, 1.2%), F082 (Bacteroidota, 1.1%) were the
most abundant genera with an average relative abundance more than 1% (Fig. 3). Additionally, some unknown
members of Bacteroidaceae (4.1%), Lachnospiraceae (3.8%), Pasteurellaceae (1.6%), Opitutaceae (1.1%), Murib-
acullaceae (1.0%), Prolixibacteraceae (1.0%) family; Bacteroidales (11.4%) order; and Clostridia (2.4%) class also
had an average relative abundance more than 1%.
Fraction‑wise comparison. Within liquid fraction, Bacteroidota phylum (mean ± sd, 61.32% ± 10.15%) was the
most abundant across all samples, followed by Firmicutes_A (10.78% ± 6.03%), Proteobacteria (7.39% ± 4.38%),
Verrucomicrobiota (4.65% ± 1.69%), Fibrobacterota (3.63% ± 1.56%) and others. Further, members of Bacte-
roidota phylum, Prevotella (27.31% ± 10.33%) and unknown members of Bacteroidales order (10.83% ± 2.49%)
were the most abundant genera, followed by other genera like RC9 (4.57% ± 2.37%), RF16 (4.42% ± 1.79%),
Fibrobacter (3.55% ± 1.55%) and others. Although, Bacteroidota (54.97% ± 8.15%) was the most abundant phy-
lum in solid fraction, it was comparatively lower than liquid fraction. Further, other phyla like Firmicutes_A
(16.11% ± 6.14%), Proteobacteria (8.46% ± 6.66%), Firmicutes_C (5.26% ± 2.4%) had comparatively higher
abundance than liquid fraction samples. Compared to liquid fraction, most abundant genus Prevotella
(17.31% ± 4.79%) decreased in solid fraction like its parent phylum Bacteroidota. However, other members of
Bacteroidota phylum such as unknown genera from Bacteroidales order (11.95% ± 2.53%) and Bacteroidaceae
Scientific Reports | (2021) 11:9400 | https://doi.org/10.1038/s41598-021-88943-9 2
Vol:.(1234567890)
www.nature.com/scientificreports/

                                  Figure 1.  Alpha diversity measures (Observed ASVs, top and Shannon Index, bottom) distribution among
                                  all samples. Samples are colored by breed and separated based on feed and fraction. Wilcoxon test comparison
                                  between breeds are mentioned as “p = ” above the box-plots. Bars with p-value (*** < 0.001 < ** < 0.01 < * < 0.05;
                                  ns = not significant) mentioned above represents p-value from pairwise comparison of different Collections
                                  using Wilcoxon test. Kruskal–Wallis comparison among all the samples within same fraction and same feed is
                                  mentioned on the top of every facet.

Scientific Reports |   (2021) 11:9400 |                https://doi.org/10.1038/s41598-021-88943-9                                                      3

                                                                                                                                               Vol.:(0123456789)
www.nature.com/scientificreports/
Group Fraction Feed Breed Collection
All samples 0.16687*** 0.02930*** 0.00993* 0.12292***
Liquid fraction NA 0.04917** 0.01521ns 0.21033***
Solid fraction NA 0.05176** 0.02283* 0.20835***
Bajra feed 0.18777*** NA 0.02751ns 0.18665***
Jowar feed 0.21741*** NA 0.03744* 0.17925***
Makai feed 0.15059*** NA 0.02413ns 0.20343***
Table 1. Adonis (PERMANOVA) statistics applied on Bray–Curtis distance on relative abundance. Group
column mentions the samples taken for respective calculations, while other columns are factors. Each value
represents R2, p-value significance. NA Not applicable, ns not significant, ***< 0.001, **< 0.01, *< 0.05.
Figure 2. NMDS plots plotted from Bray–Curtis distances calculated from the relative abundances of (A) all
samples, (B) samples from liquid fraction, (C) samples from solid fraction, (D) samples from Bajra fed animals,
(E) Jowar fed animals and (F) Makai fed animals. All the plots are commonly colored by Collection and shaped
by feed-fraction group.
family (5.45% ± 1.97%) were found to be increased in solid fraction. Additionally, other more abundant genera
like CAG-462 (4.49% ± 1.71%) and Succiniclasticum (4.29% ± 2.27%) also had higher abundance in solid fraction
as compared to liquid fraction.
Between fractions, 17 out of 28 phyla differed significantly (Kruskal–Wallis, BH p-value < 0.05), which
included highly abundant phyla like, Bacteroidota, Firmicutes_A, Firmicutes_C and Verrucomicrobiota
(Table S2). In total, 243 genera differed significantly (Kruskal–Wallis, BH p-value < 0.05) between fractions
(Table S2). These included all the abundant genera (average relative abundance > 1%) except Fibrobacter,
UBA5124 and an unknown genus from Spirochaetia class.
Feed‑wise comparison. Firmicutes_I (Kruskal–Wallis, BH adjusted p-value = 0.031); and Campylobacterota
(Kruskal–Wallis, BH p-value = 0.026) & Fibrobacterota (Kruskal–Wallis, BH p-value = 0.026) differed signifi-
cantly among three feeds in liquid and solid fractions, respectively (Table S3). Additionally, 5 (Elusimicrobiota,
Firmicutes_B, Firmicute_I, Riflebacteria and Verrucomicrobiota) and 8 (Actinobacteriota, Campylobacterota,
Fibrobacterota, Planctomycetota, Riflebacteria, Spirochaetota, Synergistota and Verrucomicrobiota) phyla also
differed significantly (Kruskal–Wallis, p-value < 0.05; not as per BH adjusted values) among feeds from liquid and
solid fraction samples, respectively. Amongst observed genera, 14 and 1 genera (all of which were observed in
Scientific Reports | (2021) 11:9400 | https://doi.org/10.1038/s41598-021-88943-9 4
Vol:.(1234567890)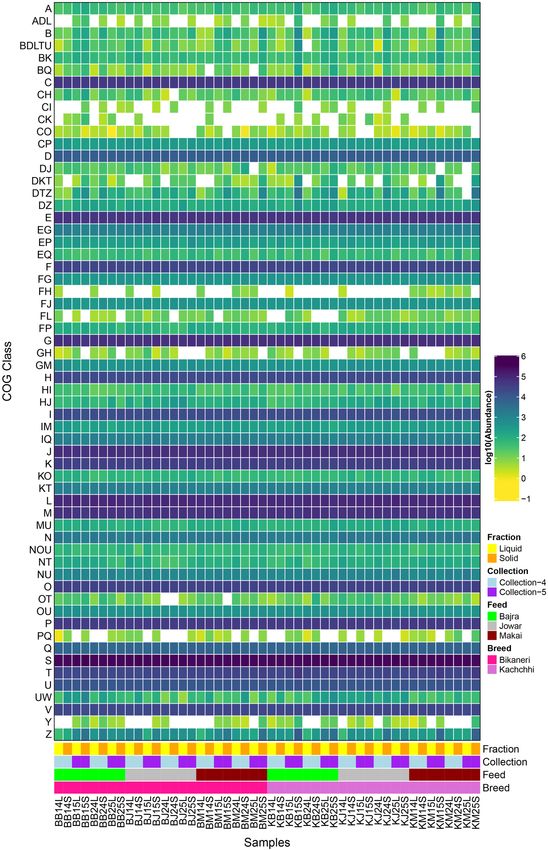
www.nature.com/scientificreports/

                                  Figure 3.  Bar plots showing diversity at (A). Phylum and (B). Genus level taxonomy. The samples are named
                                  and ordered as per Collection, Breed and animal number. Red vertical line differentiates different collections.

                                  lesser proportion) differed significantly (Kruskal–Wallis, BH p-value < 0.05) among feeds from liquid and solid
                                  fraction samples, respectively. While, 54 and 38 genera differed significantly (Kruskal–Wallis, p-value < 0.05)
                                  from liquid and solid fraction samples, respectively which included 5 genera with abundance > 1% (F0040, Fibro-
                                  bacter, Succiniclasticum and the unknown members of Opitutaceae family and Spirochaetia class) (Table S3).

Scientific Reports |   (2021) 11:9400 |                https://doi.org/10.1038/s41598-021-88943-9                                                   5

                                                                                                                                             Vol.:(0123456789)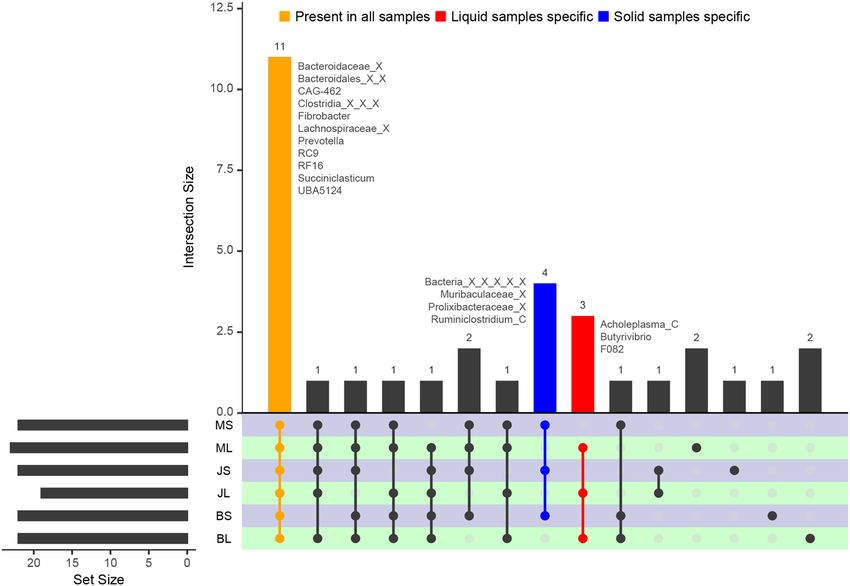
www.nature.com/scientificreports/
Figure 4. UpSet plot showing intersections among six groups of three feed and two fractions. Bars colored in
Yellow, Blue and Red shows genus/taxa exclusively observed in all groups, Solid samples and Liquid samples,
respectively. The names of taxa in colored bars are mentioned besides the bar.
Collection‑wise comparison. Amongst all collections, 14 phyla differed significantly (Kruskal–Wallis,
BH p-value < 0.05) in both liquid and solid fraction samples including most abundant phyla Bacteroidota
and Firmicutes_A (Table S4). Furthermore, 144 and 167 genera differed significantly (Kruskal–Wallis, BH
p-value < 0.05) between collections in liquid and solid fractions, respectively (Table S4). Further, 5 phyla & 38
genera; and 9 phyla & 43 genera differed significantly (Wilcoxon-test, BH p-value < 0.05) between Collection-1
and Collection-5 in liquid and solid fractions, respectively (Table S5 and Table S6). Comparatively, more number
of taxa differed significantly from Collection-1 in (Wilcoxon-test, p-value < 0.05) Collection-3 (15 phyla and
174 genera); and Collection-4 (13 phyla and 183 genera) compared to Collection-2 and Collection-5 (Table S7).
The core rumen microbiome. Core microbiome (minimum abundance 0.5%, minimum preva-
lence > 50%) was identified in each feed-fraction group from the 63-day collection. With a total of 33 unique
genera, 22, 22, 19, 22, 23 and 22 genera were identified as core microbiome for BL (BajraLiquid), BS (Bajra-
Solid), JL (JowarLiquid), JS (JowarSolid), ML (MakaiLiquid) and MS (MakaiSolid) groups, respectively. Out of
these, 11 genera with an average abundance > 1% were present in all the groups forming the core microbiome
(Fig. 4). Additionally, 4 genera (Ruminiclostridium_C, an unclassified genus each from Muribaculaceae and Pro-
lixibacteraceae family and unclassified Bacteria) were present only in solid group and 3 genera (Acholeplasma_C,
Butyrivibrio and F082) were present only in liquid group. Further, 2, 1, 1 and 2 genera were detected exclusively
in BL, BS, JS and ML groups, respectively.
Shotgun metagenomics. Total 118.34 GB of shotgun metagenomic sequencing data (Table S8) from sam-
ples of the last two collections (n = 48) was analyzed using SqueezeMeta co-assembly pipeline. Co-assembly
resulted in 4,277,503 contigs (> 200 bp) with 2.27 Gbp size. Additionally, 47.91%—77.36% reads per sample were
mapped back to the assembly with an average of 65.69%. A total of 5,145,814 genes were predicted from all the
contigs and annotated for COG and CAZymes. SqueezeMeta pipeline expresses gene abundance in the form of
TPM (Transcripts per million)15. TPM is similar to RPKM (reads per kilobase per million reads) and represents
the number of times a gene is observed per randomly sampled million genes.
Functional annotation. Around 53.87% of predicted ORFs were annotated by the COG database (46.9%-70.4%
per sample). A total of 11,019 unique COGs were categorized in 60 different classes across all the samples.
The NMDS plot based on Bray–Curtis distance of TPM of COG ids showed a clear separation between liq-
uid and solid fractions (PERMANOVA R 2:0.20360, p-value < 0.001) (Figure S2). Remarkably, no significant
differences were observed among the feed type (PERMANOVA R 2:0.02854, p-value = 0.663) and Breed (PER-
MANOVA R2:0.01490, p-value = 0.547), while less significant differences were observed between Collections
(PERMANOVA R2:0.03847, p-value = 0.020).
Scientific Reports | (2021) 11:9400 | https://doi.org/10.1038/s41598-021-88943-9 6
Vol:.(1234567890)www.nature.com/scientificreports/
Further, functional annotation revealed 60 COG classes, which included 23 unique classes while, 32, 4 and
1 classes with a combination of 2, 3 and 5 COG classes, respectively (Fig. 5). As expected, most abundant COG
class was S (Function unknown) followed by L (Replication, recombination and repair), J (Translation, riboso-
mal structure and biogenesis), G (Carbohydrate transport and metabolism), M (Cell wall/membrane/envelope
biogenesis), E (Amino acid transport and metabolism), C (Energy production and conversion), P (Inorganic ion
transport and metabolism), K (Transcription), O (Post-translational modification, protein turnover, and chap-
erones) and others. Further, significant differences (Kruskal–Wallis BH adjusted p-value < 0.05) were observed
in 27, 7 and 6 classes between fractions, collections, and feeds, respectively while no COG class differed signifi-
cantly between breeds. These included categories involved in Metabolism (Amino acid transport and metabolism
[E]; Nucleotide transport and metabolism [F]; Carbohydrate transport and metabolism [G]; and Inorganic ion
transport and metabolism [P]) and Cellular processing and Signaling (Cell cycle control, cell division, chromo-
some partitioning [D]; Cell motility [N]; Post-translational modification, protein turnover, and chaperones [O];
Intracellular trafficking, secretion, and vesicular transport [U]; Defense mechanisms[V]; and Cytoskeleton [Z]).
The carbohydrate‑active enzyme repertoire. The rumen microbiota breakdown and ferment lignocellulosic
materials from feed into V FAs16. Hence, studying the genomic constituents of microbial communities for carbo-
hydrate-active enzymes (CAZymes) will hint towards the repertoire of enzymes involved in feed degradation16.
A total of 65,904 predicted ORFs were annotated to be coding for CAZymes as per HMM based prediction. A
major proportion of these CAZymes were comprised of Glycoside hydrolases (GH, 54.51%) followed by Gly-
cosyl transferases (GT, 25.26%), Carbohydrate esterases (CE, 11.91%), Carbohydrate binding molecules (CBM,
3.8%), Polysaccharide lyases (PL, 3.58%) and Auxiliary activities (AA, 0.07%), while rest were either annotated
as Cohesin or S-layer homologous (SLH) or contained more than one CAZy class. Majority of these CAZymes
coding-ORFs (~ 95%) were annotated as Bacteria. Further, these ORFs belonged mainly to Bacteroidota (60%)
phylum followed by Firmicutes (14%) and Fibrobacteres (4%) with 13.3% ORFs remaining unclassified, while
at genus level, Prevotella (23%), Bacteroides (4%), Fibrobacter (4%), Ruminococcus (1%) and Butyrivibrio (1%)
were the most classified genera.
Around 233 unique CAZyme families (84 having GH + other families, 118 having single GH family and
31 having multiple GH families) containing GH were analyzed further (Fig. 6). GH43, GH13, GH2 and GH3
were the most abundant GH families. Most of these genes were encoded by phylum Bacteroidetes (GH2:87%,
GH3:62%, GH13:53% and GH43:75%) with a major proportion of Prevotella followed by Bacteroides and little
contributions from Alistipes genera. Other major contributing phyla included Firmicutes (GH2:4%, GH3:19%,
GH13:24% and GH43:13%), Proteobacteria (GH3:1%, GH13:4% and GH43:0.3%) and Fibrobacteres (GH2:0.9%,
GH3:0.7%, GH13:1% and GH43:4%) (Figure S3).
Further, 104, 1 and 15 families differed significantly (Kruskal–Wallis BH adjusted p-value < 0.05) between
fractions, collections, and feeds, respectively (Figure S4). Among the most abundant families (TPM abun-
dance > 100), families GH43, GH13, GH3, GH5, GH97, GH92, GH9, GH78, GH51, GH31, GH29, GH20, GH2,
GH16, GH10 were significantly higher in solid fraction as compared to liquid fraction, while only few families
such as GH24, GH25 and GH73 were more abundant in liquid fraction. Further, families GH65, GH1 and GH120
were significantly more abundant in Maize feed, while GH159, GH10 + CBM4 were more abundant in Jowar and
GH5 + GH92 and GH139 were more abundant in Bajra feed.
Discussion
Rumen ecosystem harbors a great diversity of microbes with wide variety of roles. It is speculated that a diverse
set of microbes start fermenting incoming feed particles and then a different set of microbes starts acting on fer-
mented feed17,18. The microbes adhered to feed particles are quite different from those present in the fluid. These
differences are not only limited to the taxonomy of microbes but to their functions/metabolism as w ell12,17,19. In
this study, significant differences were observed among liquid and solid fraction microbiota at both taxonomic
and functional levels as reported in previous studies on camel r umen12. At a higher taxonomic level, the propor-
tion of two major phyla Bacteroidota and Firmicutes differed between both the fractions. In accordance with the
previous studies on rumen, Firmicutes (Firmicutes_A and Firmicutes_C) were comparatively higher in solid
fraction as compared to liquid fraction and vice versa for Bacteroidota phylum20,21. Firmicutes phylum was split
in multiple phyla according to the taxonomy of GTDB22. GTDB follows the standardized bacterial taxonomy
based on genome phylogeny and hence, differs from the traditional taxonomy from NCBI or other databases.
However, significant differences were observed only in Firmicutes_A and Firmicutes_C and not in Firmicutes
phylum. The reason being that Firmicutes_A and Firmicutes_C phylum includes class Clostridia and Negativi-
cutes, respectively which are commonly associated with fiber degradation and reported in higher abundances in
rumen, justifying their higher abundance observed in Solid f raction12,17,20. The Firmicutes phylum includes class
Bacilli having lesser abundance in anaerobic rumen environment and are not modulated by other p arameters17,20.
At genus level, Prevotella was the most abundant genus from Bacteroidota phylum. Other abundant genera
from Bacteroidota phylum included CAG-462, RC9, RF16, F0040, F082 and some other taxa annotated at higher
level. All these taxa belong to Bacteroidales order and were reconstructed from metagenomes. Bacteroides, a
major genus from this order along with Prevotella are some of the most commonly observed genera in rumen
of both ruminants and pseudo-ruminants and were reported in previous studies on bovine, sheep, goat, camel,
alpaca23–26. The RC9 and RF16 genera were observed in higher abundance especially in liquid fraction. The
previous studies on camel and moose rumen have also reported the higher abundances of RC912,27 and RF16
genera25,28, respectively.
Fibrobacter is yet another important member of the rumen community, reported in several studies. Fibrobacter
is mainly associated with cellulolytic-fiber degradation and hence is an integral part of the rumen community.
Scientific Reports | (2021) 11:9400 | https://doi.org/10.1038/s41598-021-88943-9 7
Vol.:(0123456789)www.nature.com/scientificreports/
Figure 5. Heatmap representing the abundance of COG classes among all the samples of shotgun data. A to ▸
Z symbols represent COG categories and COGs presented by more than one COG class is giving by writing
corresponding COG class code together. CELLULAR PROCESSES AND SIGNALING: [D] Cell cycle control,
cell division, chromosome partitioning, [M] Cell wall/membrane/envelope biogenesis, [N] Cell motility,
[O] Post-translational modification, protein turnover, and chaperones, [T] Signal transduction mechanisms,
[U] Intracellular trafficking, secretion, and vesicular transport, [V] Defense mechanisms, [W] Extracellular
structures, [Y] Nuclear structure, [Z] Cytoskeleton; INFORMATION STORAGE AND PROCESSING:
[A] RNA processing and modification, [B] Chromatin structure and dynamics, [J] Translation, ribosomal
structure and biogenesis, [K] Transcription, [L] Replication, recombination and repair; METABOLISM: [C]
Energy production and conversion, [E] Amino acid transport and metabolism, [F] Nucleotide transport
and metabolism, [G] Carbohydrate transport and metabolism, [H] Coenzyme transport and metabolism,
[I] Lipid transport and metabolism, [P] Inorganic ion transport and metabolism, [Q] Secondary metabolites
biosynthesis, transport, and catabolism; POORLY CHARACTERIZED: [R] General function prediction only,
[S] Function unknown.
However, unlike previous studies in camel8,12 present study did not reported significant difference in its abun-
dance between liquid and solid fractions but observed similar abundance levels. Previous studies on rumen have
also observed similar abundance of Fibrobacter in cattle and buffalo r umen20,25 but lower abundance in other
members of c amelids25. Another genus Succiniclasticum known to ferment only succinate to propionate and not
any other carbohydrates or amino acids29, which explains its significantly higher abundance in solid fraction
compared to liquid fraction. Several bacteria from families Opitutaceae and Muribacullaceae were also observed
in comparatively higher abundance in liquid and solid fractions, respectively. Members of Opitutaceae family
have been isolated from soil, terrestrial environment and gut of ants and wood-feeding t ermites30–32. They have
the ability of degrade lignocellulosic biomass and explains their presence in environments with plant biomass
such as camel rumen. Muribacullaceae family was described very recently and the members of the family have
been reported from mouse gut (for which it was named) and chicken caecum33,34. The members of this family
are also shown to possess lignocellulosic degradation c apabilities33,34.
From the functional point of view, around 33% of the annotated genes were annotated as “Functions
Unknown” (COG Class-S). While higher (> 5% average) annotated COG class includes Class L (Replication,
recombination and repair), Class J (Translation, ribosomal structure and biogenesis), Class G (Carbohydrate
transport and metabolism), Class M (Cell wall/membrane/envelope biogenesis) and Class E (Amino acid trans-
port and metabolism). The findings are in line with earlier studies on rumen, wherein a major proportion of
genes involved in Genetic Information processing (Class L and J) followed by genes involved in Carbohydrate
and Amino acid metabolism (Class G and E) were r eported14,17. Previous studies have also described a higher
degree of functional differences between f ractions17,20.
Comparatively, lesser functional differences were observed between Collections (seven classes), and Feed (five
classes), while no differences were observed between the breeds. While diet is one of the important factors influ-
encing the shape of the rumen microbiome, few studies have observed that the taxonomic changes due to diet
are more evident than functional c hanges17,20,35,36. Based on the results obtained in the study, it is speculated that
the changes in the diet leads to the change in the abundance of the microbiota which gradually becomes stable
under the influence of the same diet. Previous studies have shown that a period of 4–6 weeks can stabilize these
diet related changes in rumen microbiota37,38. Incidentally, we did observe the greater number of significantly
differentiating (Kruskal–Wallis, p-value < 0.05; not as per BH adjusted values) genera in Collection-2 (50) fol-
lowed by Collection-4 (37), Collection-3 (33), Collection-5 (18), and Collection-1 (8), further substantiating the
fact that indeed the most variation observed was immediately after diet change and decreased with time, whereas
0th day had the least feed-dependent variations as expected. This could also be the reason why lesser changes
were observed between collections in the functional profile as they were based only on the last two collections.
The feeds included in present study were selected on the basis of their lignocellulosic content and therefore,
we expected differences among the diet groups. However, we found less or no significant variations in taxa and
diversity among the diet groups. The observed changes were also comparatively less pronounced as compared
to similar experiments across multiple r uminants25,39 as well as compared to variations in roughage-concentrate
proportion of same f eed40,41. While the functions of rumen in camels and cattle are similar, there are some of the
differences associated with the physiology of animal which might result in less pronounced differences among
feed associated microbiota. It is also probable that camels being able to survive on a wide variety of plant-based
diets available in scarce environments, change in the diet might have lesser impact on camel rumen microbiota
as compared to true ruminants. We also speculate that including larger group of animals in further studies can
provide more reliable findings confirming the effects of change in diet on rumen microbiota. Another point
worth mentioning here is the probability of the introduction of sequencing biases due to the presence of reagent
and laboratory contaminants affecting the a nalysis42. The results of this study are therefore to be interpreted with
caution as no negative-controls (no-template controls) were included in the study using which such contaminants
can be identified and r emoved43.
With respect to CAZYme profile, most of the previous studies have reported a high proportion of GH fol-
lowed by GT and other classes of CAZymes similar to present s tudy14,28,44,45. We also observed similar dominant
organisms containing these CAZymes, i.e., members of Bacteroidetes, Firmicutes, Fibrobacter. However, unlike
previous study on camel rumen, we didn’t observe higher contributions from Spirochaetes (0.6% in our study
compared to 4% in other study)14. In line with previous studies on r umen14,28,45, we observed comparable pro-
portions of GH families acting as cellulases (GH5, GH9, GH88, GH95), hemicellulases (GH8, GH10, GH11,
Scientific Reports | (2021) 11:9400 | https://doi.org/10.1038/s41598-021-88943-9 8
Vol:.(1234567890)www.nature.com/scientificreports/
Scientific Reports | (2021) 11:9400 | https://doi.org/10.1038/s41598-021-88943-9 9
Vol.:(0123456789)www.nature.com/scientificreports/
Figure 6. Heatmap showing distribution of all the CAZyme categories which were annotated to contain at least
one GH family.
GH23, GH28, GH53), debranching enzymes (GH23, GH33, GH51, GH54, GH67, GH77, GH78, GH84, GH103,
GH127) and oligosaccharide degrading enzymes (GH1, GH2, GH3, GH13, GH18, GH20, GH27, GH29, GH31,
GH32, GH35, GH38, GH39, GH42, GH43, GH57, GH92, GH94, GH97, GH130). Also consistent in this study
was the pattern of more abundant GH families. Amongst all, GH3 (β-Glucosidases), GH13 (α-Amylases), GH43
Scientific Reports | (2021) 11:9400 | https://doi.org/10.1038/s41598-021-88943-9 10
Vol:.(1234567890)www.nature.com/scientificreports/
(arabino/xylosidases) and GH2 (β-Galactosidases) were the most dominant families observed as in other studies
of rumen of camel14, cattle18,45,46, buffalo47 and moose28. The members of Bacteroidetes and Firmicutes were the
major contributors for these four GH families, especially GH2, while more than 1% ORFs in GH13 and GH43
were coded by Fibrobacteres; and by Proteobacteria in GH3 and GH13. The contributions from Eukaryotes
were also observed in GH3 (0.9%; 0.3% by Neocallimastigaceae, rest unclassified), GH43 (0.03%; entirely by
Neocallimastigaceae) and GH13 (2%; 0.03% by Neocallimastigaceae family and 0.3% by Eudiplodinium genus).
Eudiplodinium genus is a group of rumen ciliates belonging to family ophryoscolecids and have been linked with
their cellulolytic and amylolytic activities48,49.
Materials and methods
Experimental design and sample collection. To access the dietary impact on the camel rumen micro-
biome, Kachchhi (K) and Bikaneri (B) breeds of camels were fed with three different diets, Bajra (B) (Pennisetum
glaucum, pearl millet), Jowar (J) (Sorghum bicolor, sorghum) and Makai (M) (Zea mays, maize). The experimen-
tal animals were housed at the National Research Centre on Camel (NRCC), Bikaner, Rajasthan and provided
ad libitum feed consumption and free access to drinking water. Twelve animals were divided into three groups
(four animals in each group; two animals each of Bikaneri and Kachchhi breed) for 63 days (Figure S1). Prior
to the experiment, all the animals were maintained on the same diet based on Guar (cluster bean, Cyamopsis
tetragonoloba), different from the experimental diets. Rumen liquor samples were collected using probang as
mentioned earlier50 under mild sedation. The samples were collected at 0 day before starting the feeding trial
and subsequent collections were made on 10th, 21st, 42nd and 63rd days of experiment. We decided to collect
the samples on every 21 days (21st, 42nd and 63rd) to cover the period of feed adaptation37,38 and intermediary
collection during initial week on 10th day. Collected rumen content was filtered through four-layered sterile
muslin cloth to separate the liquid and solid fractions to be collected in 2 ml cryovials prefilled with Qiagen
RNAprotect Bacteria reagent (Qiagen, Germany) at an approximate 1:1 ratio. Samples were immediately stored
at − 20 °C in a portable freezer and transported to the laboratory where these samples were stored at − 80 °C until
further processing.
Extraction of metagenomic DNA. Metagenomic DNA was isolated from liquid and solid fractions
of rumen samples using QIAamp Fast DNA stool Mini Kit (Qiagen, Germany) following the manufacturer’s
instructions with minor modifications. Briefly, liquid samples were subjected to bead beating in Qiagen Tis-
sueLyser for 30 s at 25 Hz and subsequently processed for lysis as per manufacturer’s instructions. Rumen solid
samples were vortexed for 20 min to completely dissociate bacteria attached with feed particles followed by
centrifugation at 2600 g for 30 s to separate solid particles. Approximately, 600 μl of supernatant was processed
from the previous step for DNA isolation as recommended by the kit manufacturer. Quantity and quality of
metagenomic DNA was assessed using a Qubit 3.0 fluorometer (ThermoFisher scientific, MA) and agarose gel
electrophoresis, respectively.
Library preparation and sequencing. V3-V4 hypervariable region of 16S rRNA gene was amplified
using universal primer pair, 341F and 785R51 and library was prepared according to Illumina 16S Metagen-
omics library preparation guide (Illumina, USA). The final library size and concentration was checked using
Agilent Bioanalyzer DNA 1000 chip (Agilent, USA) and Qubit fluorometer (Invitrogen, USA), respectively. Four
sequencing runs were carried out using prepared libraries on Illumina MiSeq sequencer employing 2 × 250 v2
chemistry.
Shotgun metagenomic libraries were prepared from samples of collection 4 and 5 (n = 24). Libraries were
prepared from 1 ng of metagenomic DNA with Nextera XT DNA Library Prep Kit (Illumina, USA) using the
manufacturer’s protocol. Prepared libraries were quantified using Qubit 3.0 and checked for size on Agilent
Bioanalyzer 2100 using DNA HS kit. Five sequencing runs were performed on Illumina MiSeq using 2 × 250 v2
sequencing chemistry to sequence all the metagenomic libraries.
Data analysis. The raw data of amplicon sequencing was manually curated and quality filtered (average
qual score < Q30 and trimming last 10 nucleotides from R2 reads) using Prinseq-lite Perl s cript52. The quality
filtered data was then imported in the R v3.6.1 environment and analyzed with the DADA2 package v1.14.053. As
per DADA2 pipeline for 16S data (https://benjjneb.github.io/dada2/tutorial.html) and big data pipeline (https://
benjjneb.github.io/dada2/bigdata.html), data from four runs was analyzed separately and then merged at a later
stage. Briefly, the steps followed were quality check, trimming (primers were trimmed from both pairs) and
filtering (no Ns and no PhiX), and sequence variants were inferred by estimating error rates and denoising.
Sequence variants were merged across paired data and then data from all the runs were merged to construct
the amplicon sequence variant (ASV) table followed by chimera/bimera removal and taxonomy assignment.
GTDBr89 (Genome Taxonomy Database) database was used to assign taxonomy to the A SVs22. The ASV table,
assigned taxonomy and related metadata were combined to create a phyloseq object using the Phyloseq R pack-
age v1.30.054. Further, downstream analysis was done with the phyloseq object and using other R packages
including microbiome v1.8.055, vegan v2.5.656, ggplot2 v3.2.157, ggpubr v0.2.458, UpSetR v1.4.059. Observed ASVs
and Shannon diversity were calculated and compared among groups. Further, between sample/groups com-
parison was done based on Bray–Curtis distance and visualized by plotting Non-metric multidimensional scal-
ing (NMDS) plot followed by group level comparisons using PERMANOVA test. The Phylum and Genus level
taxonomy was compared between groups to identify group specific differences. All the comparisons of diversity
indices and taxa abundance across different groups were done using non-parametric Kruskal–Wallis (for multi-
group comparisons) and Wilcoxon tests (for two-group comparison). The p-values were adjusted by Benjamini–
Scientific Reports | (2021) 11:9400 | https://doi.org/10.1038/s41598-021-88943-9 11
Vol.:(0123456789)www.nature.com/scientificreports/
Hochberg correction and have been mentioned accordingly throughout the manuscript. All the statistical testing
between multiple groups were done using the R packages ggpubr and vegan.
The raw reads obtained from shotgun metagenomics were curated using Prinseq-lite Perl script with following
parameters: minimum length = 50, length trimmed to = 190 (to remove G-biased tails; one of the runs with very
poor tail-quality was trimmed to 150 nucleotides), and minimum average quality = 30. The quality filtered reads
were analyzed using SqueezeMeta employing a co-assembly p ipeline60. Within the pipeline, assembly was done
using MetaSpades , ORF prediction using MetaProdigal , taxonomy assignment using Diamond63 against NCBI
61 62
RefSeq database and functional prediction using Diamond/HMM against COG database64. Further, predicted
ORFs were annotated for Carbohydrate Active Enzymes using HMMer based approach within dbCAN265,66.
Ethical permission. The work described in this article was carried out with prior ethical approval of the
institutional animal ethics committee of the National Research Center on Camel, Bikaner, Rajasthan (NRCC/
PSME/6(141)2000-Tech/). All procedures performed in studies involving animals were in accordance with the
ethical standards of the institution or practice at which the studies were conducted. The work included non-
invasive sample collection and no animals were harmed during the experiment. The study was carried out in
compliance with the ARRIVE guidelines.
Conclusion
In all, we report an extensive overview of camel rumen microbiota under influence of different diets. We observed
the differences among three different feed roughages although the differences were not as much prominent as
those reported in true ruminants. The study also tracked the microbiota diversity changes through time-points.
We observed the highest number of significantly differentiating taxa in Collection-3 (21st day) with respect
to Collection-1 (0 day). This points to the fact that on introduction of a new diet, microbiota starts changing
slowly and more prominently during the third to sixth week and reaches a stable level thereafter. This was also
observed in case of lesser functional differences between Collection-4 and Collection-5. However, the highest
degree of variations were observed between two fractions of rumen content similar to that of previous studies of
similar nature. We also observed a higher proportion of GH2, GH3, GH13 and GH43 CAZy families prominently
involved in biomass degradation and reported in several rumen microbiota. Overall, this study presents impor-
tant insights into camel rumen microbiome which can serve as critical information to increase feed digestibility
in camels through selective enrichment of rumen microbiota.
Data availability
All the raw sequencing data is submitted in NCBI under BioProject PRJNA603266 and available from SRA under
accessions SRR13178665 to SRR13178784 for 16S data and SRR13205818 to SRR13205865 for Shotgun data. The
R script used for analysis is available from github.com/ankit4035/camelrumenproject (https://doi.org/10.5281/
zenodo.4308948) for reproduction of the entire work.
Received: 10 December 2020; Accepted: 12 April 2021
References
1. Ali, A., Baby, B. & Vijayan, R. From desert to medicine: A review of camel genomics and therapeutic products. Front. Genet. 10,
17. https://doi.org/10.3389/fgene.2019.00017 (2019).
2. Bactrian Camels Genome Sequencing Analysis Consortium. Genome sequences of wild and domestic bactrian camels. Nat. Com-
mun. 3, 1202. https://doi.org/10.1038/ncomms2192 (2012).
3. Wu, H. et al. Camelid genomes reveal evolution and adaptation to desert environments. Nat. Commun. 5, 5188. https://doi.org/
10.1038/ncomms6188 (2014).
4. von Engelhardt, W., Dycker, C. & Lechner-Doll, M. Absorption of short-chain fatty acids, sodium and water from the forestomach
of camels. J. Comp. Physiol. B 177, 631–640. https://doi.org/10.1007/s00360-007-0161-8 (2007).
5. Chaucheyras-Durand, F. & Ossa, F. REVIEW: The rumen microbiome: Composition, abundance, diversity, and new investigative
tools. Profess. Anim. Sci. 30, 1–12. https://doi.org/10.15232/S1080-7446(15)30076-0 (2014).
6. Gruninger, R. J., Ribeiro, G. O., Cameron, A. & McAllister, T. A. Invited review: Application of meta-omics to understand the
dynamic nature of the rumen microbiome and how it responds to diet in ruminants. Animal 13, 1843–1854. https://doi.org/10.
1017/S1751731119000752 (2019).
7. Durso, L. M. et al. Animal-to-animal variation in fecal microbial diversity among beef cattle. Appl. Environ. Microbiol. 76, 4858–
4862. https://doi.org/10.1128/AEM.00207-10 (2010).
8. Gharechahi, J., Zahiri, H. S., Noghabi, K. A. & Salekdeh, G. H. In-depth diversity analysis of the bacterial community resident in
the camel rumen. Syst. Appl. Microbiol. 38, 67–76. https://doi.org/10.1016/j.syapm.2014.09.004 (2015).
9. Li, R. W., Connor, E. E., Li, C., Baldwin, R. L. & Sparks, M. E. Characterization of the rumen microbiota of pre-ruminant calves
using metagenomic tools. Environ. Microbiol. 14, 129–139. https://doi.org/10.1111/j.1462-2920.2011.02543.x (2012).
10. Parmar, N. R. et al. Metagenome of Mehsani buffalo rumen microbiota: An assessment of variation in feed-dependent phylogenetic
and functional classification. J. Mol. Microbiol. Biotechnol. 24, 249–261. https://doi.org/10.1159/000365054 (2014).
11. Al-Masaudi, S. et al. A metagenomics investigation of carbohydrate-active enzymes along the goat and camel intestinal tract. Int.
Microbiol. 22, 429–435. https://doi.org/10.1007/s10123-019-00068-2 (2019).
12. Rabee, A. E. et al. Composition of bacterial and archaeal communities in the rumen of dromedary camel using cDNA-amplicon
sequencing. Int. Microbiol. 23, 137–148. https://doi.org/10.1007/s10123-019-00093-1 (2020).
13. Bhatt, V. D., Dande, S. S., Patil, N. V. & Joshi, C. G. Molecular analysis of the bacterial microbiome in the forestomach fluid from
the dromedary camel (Camelus dromedarius). Mol. Biol. Rep. 40, 3363–3371. https://doi.org/10.1007/s11033-012-2411-4 (2013).
14. Gharechahi, J. & Salekdeh, G. H. A metagenomic analysis of the camel rumen’s microbiome identifies the major microbes respon-
sible for lignocellulose degradation and fermentation. Biotechnol. Biofuels 11, 216. https://doi.org/10.1186/s13068-018-1214-9
(2018).
15. Wagner, G. P., Kin, K. & Lynch, V. J. Measurement of mRNA abundance using RNA-seq data: RPKM measure is inconsistent among
samples. Theory Biosci. 131, 281–285. https://doi.org/10.1007/s12064-012-0162-3 (2012).
Scientific Reports | (2021) 11:9400 | https://doi.org/10.1038/s41598-021-88943-9 12
Vol:.(1234567890)www.nature.com/scientificreports/
16. Yanez-Ruiz, D. R., Abecia, L. & Newbold, C. J. Manipulating rumen microbiome and fermentation through interventions during
early life: A review. Front. Microbiol. 6, 1133. https://doi.org/10.3389/fmicb.2015.01133 (2015).
17. Hinsu, A. T. et al. MetaRNAseq analysis of surti buffalo rumen content reveals that transcriptionally active microorganisms need
not be abundant. Mol. Biol. Rep. 47, 5101–5114. https://doi.org/10.1007/s11033-020-05581-6 (2020).
18. Brulc, J. M. et al. Gene-centric metagenomics of the fiber-adherent bovine rumen microbiome reveals forage specific glycoside
hydrolases. Proc. Natl. Acad. Sci. U.S.A. 106, 1948–1953. https://doi.org/10.1073/pnas.0806191105 (2009).
19. Hinsu, A. T. et al. Functional gene profiling through metaRNAseq approach reveals diet-dependent variation in rumen microbiota
of buffalo (Bubalus bubalis). Anaerobe 44, 106–116. https://doi.org/10.1016/j.anaerobe.2017.02.021 (2017).
20. Pandit, R. J. et al. Microbiota composition, gene pool and its expression in Gir cattle (Bos indicus) rumen under different forage
diets using metagenomic and metatranscriptomic approaches. Syst. Appl. Microbiol. 41, 374–385. https://doi.org/10.1016/j.syapm.
2018.02.002 (2018).
21. Samsudin, A. A., Evans, P. N., Wright, A. D. & Al Jassim, R. Molecular diversity of the foregut bacteria community in the dromedary
camel (Camelus dromedarius). Environ. Microbiol. 13, 3024–3035. https://doi.org/10.1111/j.1462-2920.2011.02579.x (2011).
22. Parks, D. H. et al. A complete domain-to-species taxonomy for bacteria and Archaea. Nat. Biotechnol. 38, 1079–1086. https://doi.
org/10.1038/s41587-020-0501-8 (2020).
23. Koringa, P. G. et al. Metagenomic characterisation of ruminal bacterial diversity in buffaloes from birth to adulthood using 16S
rRNA gene amplicon sequencing. Funct. Integr. Genom. 19, 237–247. https://doi.org/10.1007/s10142-018-0640-x (2019).
24. Zeineldin, M. et al. Synergetic action between the rumen microbiota and bovine health. Microb. Pathog. 124, 106–115. https://doi.
org/10.1016/j.micpath.2018.08.038 (2018).
25. Henderson, G. et al. Rumen microbial community composition varies with diet and host, but a core microbiome is found across
a wide geographical range. Sci. Rep. 5, 14567. https://doi.org/10.1038/srep14567 (2015).
26. Huws, S. A. et al. Addressing global ruminant agricultural challenges through understanding the rumen microbiome: Past, present,
and future. Front. Microbiol. 9, 2161. https://doi.org/10.3389/fmicb.2018.02161 (2018).
27. Ishaq, S. L. & Wright, A. D. High-throughput DNA sequencing of the ruminal bacteria from moose (Alces alces) in Vermont,
Alaska, and Norway. Microb. Ecol. 68, 185–195. https://doi.org/10.1007/s00248-014-0399-0 (2014).
28. Svartstrom, O. et al. Ninety-nine de novo assembled genomes from the moose (Alces alces) rumen microbiome provide new insights
into microbial plant biomass degradation. ISME J. 11, 2538–2551. https://doi.org/10.1038/ismej.2017.108 (2017).
29. van Gylswyk, N. O. Succiniclasticum ruminis gen. nov., sp. Nov., a ruminal bacterium converting succinate to propionate as the
sole energy-yielding mechanism. Int. J. Syst. Bacteriol. 45, 297–300. https://doi.org/10.1099/00207713-45-2-297 (1995).
30. Choo, Y. J., Lee, K., Song, J. & Cho, J. C. Puniceicoccus vermicola gen. nov., sp. nov., a novel marine bacterium, and description of
Puniceicoccaceae fam. nov., Puniceicoccales ord. nov., Opitutaceae fam. nov., Opitutales ord. nov. and Opitutae classis nov. in the
phylum ’Verrucomicrobia’. Int. J. Syst. Evol. Microbiol. 57, 532–537. https://doi.org/10.1099/ijs.0.64616-0 (2007).
31. Kotak, M., Lin, J. Y., Isanapong, J. & Rodrigues, J. L. M. Draft genome sequences of strains TAV3 and TAV4 (Verrucomicrobia:
Opitutaceae), isolated from a wood-feeding termite, and in silico analysis of their polysaccharide-degrading enzymes. Microbiol.
Resour. Announc. https://doi.org/10.1128/MRA.01192-19 (2020).
32. Breidenbach, B., Pump, J. & Dumont, M. G. Microbial community structure in the rhizosphere of rice plants. Front. Microbiol. 6,
1537. https://doi.org/10.3389/fmicb.2015.01537 (2015).
33. Lagkouvardos, I. et al. The mouse intestinal bacterial collection (miBC) provides host-specific insight into cultured diversity and
functional potential of the gut microbiota. Nat. Microbiol. 1, 16131. https://doi.org/10.1038/nmicrobiol.2016.131 (2016).
34. Hinsu, A. T. et al. Genome reconstruction of a novel carbohydrate digesting bacterium from the chicken caecal microflora. Meta
Gene 20, 100543. https://doi.org/10.1016/j.mgene.2019.01.002 (2019).
35. Liu, H. et al. Tibetan sheep adapt to plant phenology in alpine meadows by changing rumen microbial community structure and
function. Front. Microbiol. 11, 587558. https://doi.org/10.3389/fmicb.2020.587558 (2020).
36. Mann, E., Wetzels, S. U., Wagner, M., Zebeli, Q. & Schmitz-Esser, S. Metatranscriptome sequencing reveals insights into the gene
expression and functional potential of rumen wall bacteria. Front. Microbiol. 9, 43. https://doi.org/10.3389/fmicb.2018.00043
(2018).
37. Tajima, K. et al. Rumen bacterial community transition during adaptation to high-grain diet. Anaerobe 6, 273–284. https://doi.
org/10.1006/anae.2000.0353 (2000).
38. Weimer, P. J., Stevenson, D. M., Mertens, D. R. & Thomas, E. E. Effect of monensin feeding and withdrawal on populations of
individual bacterial species in the rumen of lactating dairy cows fed high-starch rations. Appl. Microbiol. Biotechnol. 80, 135–145.
https://doi.org/10.1007/s00253-008-1528-9 (2008).
39. Jorns, T., Craine, J., Towne, E. G. & Knox, M. Climate structures bison dietary quality and composition at the continental scale.
Environmental DNA 2, e47. https://doi.org/10.1002/edn3.47 (2020).
40. Pitta, D. W. et al. Bacterial diversity dynamics associated with different diets and different primer pairs in the rumen of Kankrej
cattle. PLoS ONE 9, e111710. https://doi.org/10.1371/journal.pone.0111710 (2014).
41. Tapio, I. et al. Taxon abundance, diversity, co-occurrence and network analysis of the ruminal microbiota in response to dietary
changes in dairy cows. PLoS ONE 12, e0180260. https://doi.org/10.1371/journal.pone.0180260 (2017).
42. Salter, S. J. et al. Reagent and laboratory contamination can critically impact sequence-based microbiome analyses. BMC Biol. 12,
87. https://doi.org/10.1186/s12915-014-0087-z (2014).
43. Davis, N. M., Proctor, D. M., Holmes, S. P., Relman, D. A. & Callahan, B. J. Simple statistical identification and removal of contami-
nant sequences in marker-gene and metagenomics data. Microbiome 6, 226. https://doi.org/10.1186/s40168-018-0605-2 (2018).
44. Stewart, R. D. et al. Assembly of 913 microbial genomes from metagenomic sequencing of the cow rumen. Nat. Commun. 9, 870.
https://doi.org/10.1038/s41467-018-03317-6 (2018).
45. Wang, L., Zhang, G., Xu, H., Xin, H. & Zhang, Y. Metagenomic analyses of microbial and carbohydrate-active enzymes in the
rumen of holstein cows fed different forage-to-concentrate ratios. Front. Microbiol. 10, 649. https://doi.org/10.3389/fmicb.2019.
00649 (2019).
46. Hess, M. et al. Metagenomic discovery of biomass-degrading genes and genomes from cow rumen. Science 331, 463–467. https://
doi.org/10.1126/science.1200387 (2011).
47. Patel, D. D. et al. Microbial and carbohydrate active enzyme profile of buffalo rumen metagenome and their alteration in response
to variation in the diet. Gene 545, 88–94. https://doi.org/10.1016/j.gene.2014.05.003 (2014).
48. Belzecki, G., McEwan, N. R., Kowalik, B., Michalowski, T. & Miltko, R. Effect of Entodinium caudatum on starch intake and gly-
cogen formation by Eudiplodinium maggii in the rumen and reticulum. Eur. J. Protistol. 57, 38–49. https://doi.org/10.1016/j.ejop.
2016.09.007 (2017).
49. Bełżecki, G., Newbold, C. J., McEwan, N. R., McIntosh, F. M. & Michałowski, T. Characterization of the amylolytic properties of the
rumen ciliate protozoan Eudiplodinium maggii. J. Anim. Feed Sci. 16, 590–606. https://doi.org/10.22358/jafs/66817/2007 (2007).
50. Mishra, P. et al. Exploring the eukaryotic diversity in rumen of Indian camel (Camelus dromedarius) using 18S rRNA amplicon
sequencing. Arch. Microbiol. 202, 1861–1872. https://doi.org/10.1007/s00203-020-01897-w (2020).
51. Thijs, S. et al. Comparative evaluation of four bacteria-specific primer pairs for 16S rRNA gene surveys. Front. Microbiol. 8, 494.
https://doi.org/10.3389/fmicb.2017.00494 (2017).
52. Schmieder, R. & Edwards, R. Quality control and preprocessing of metagenomic datasets. Bioinformatics 27, 863–864. https://doi.
org/10.1093/bioinformatics/btr026 (2011).
Scientific Reports | (2021) 11:9400 | https://doi.org/10.1038/s41598-021-88943-9 13
Vol.:(0123456789)www.nature.com/scientificreports/
53. Callahan, B. J. et al. DADA2: High-resolution sample inference from Illumina amplicon data. Nat. Methods 13, 581–583. https://
doi.org/10.1038/nmeth.3869 (2016).
54. McMurdie, P. J. & Holmes, S. phyloseq: An R package for reproducible interactive analysis and graphics of microbiome census
data. PLoS ONE 8, e61217. https://doi.org/10.1371/journal.pone.0061217 (2013).
55. Lahti, L. & Shetty, S. Tools for microbiome analysis in R Version 2.1.26, (2017).
56. Oksanen, J. et al. vegan: Community Ecology Package. R package version 2.5–6,
(2019).
57. Wickham, H. ggplot2: Elegant Graphics for Data Analysis (Springer-Verlag, 2016).
58. Kassambara, A. ggpubr: ’ggplot2’ Based Publication Ready Plots. R package version 0.2.5, (2020).
59. Conway, J. R., Lex, A. & Gehlenborg, N. UpSetR: An R package for the visualization of intersecting sets and their properties.
Bioinformatics 33, 2938–2940. https://doi.org/10.1093/bioinformatics/btx364 (2017).
60. Tamames, J. & Puente-Sanchez, F. SqueezeMeta, a highly portable, fully automatic metagenomic analysis pipeline. Front. Microbiol.
9, 3349. https://doi.org/10.3389/fmicb.2018.03349 (2018).
61. Bankevich, A. et al. SPAdes: A new genome assembly algorithm and its applications to single-cell sequencing. J. Comput. Biol. 19,
455–477. https://doi.org/10.1089/cmb.2012.0021 (2012).
62. Hyatt, D. et al. Prodigal: Prokaryotic gene recognition and translation initiation site identification. BMC Bioinf. 11, 119. https://
doi.org/10.1186/1471-2105-11-119 (2010).
63. Buchfink, B., Xie, C. & Huson, D. H. Fast and sensitive protein alignment using DIAMOND. Nat. Methods 12, 59–60. https://doi.
org/10.1038/nmeth.3176 (2015).
64. Huerta-Cepas, J. et al. eggNOG 4.5: A hierarchical orthology framework with improved functional annotations for eukaryotic,
prokaryotic and viral sequences. Nucleic Acids Res. 44, 286–293. https://doi.org/10.1093/nar/gkv1248 (2016).
65. Zhang, H. et al. dbCAN2: A meta server for automated carbohydrate-active enzyme annotation. Nucleic Acids Res. 46, W95–W101.
https://doi.org/10.1093/nar/gky418 (2018).
66. Eddy, S. R. Accelerated profile HMM searches. PLoS Comput. Biol. 7, e1002195. https://doi.org/10.1371/journal.pcbi.1002195
(2011).
Acknowledgements
The authors would like to acknowledge the help of staff at ICAR-National Research Centre on Camel, Bikaner
for their help in rearing and maintaining animals.
Author contributions
B.J. and N.V.P. were involved in diet formulation, rearing and maintaining animals. A.T.H., N.J.T., K.J.P., R.J.P.,
N.A.D. and S.J.J. were involved in sample collection. N.J.T. and K.J.P. were involved in processing of samples,
extraction of metagenomic DNA and its sequencing. A.T.H. did the data analysis. A.T.H. wrote the manuscript
with help from N.J.T. and inputs from S.J.J. S.J.J., N.V.P., N.A.D., H.J.P. and C.G.J. conceptualized the study,
acquired the funding, and corrected the manuscript. All authors read and approved the final manuscript.
Funding
This study was funded by the Department of Biotechnology, Ministry of Science and Technology, Government
of India, New Delhi; Grant number: BT/PR15586/AAQ/1/651/2015. The funding agency had no role in sample
collection, conducting experiment, data analysis and manuscript writing.
Competing interests
The authors declare no competing interests.
Additional information
Supplementary Information The online version contains supplementary material available at https://doi.org/
10.1038/s41598-021-88943-9.
Correspondence and requests for materials should be addressed to S.J.J.
Reprints and permissions information is available at www.nature.com/reprints.
Publisher’s note Springer Nature remains neutral with regard to jurisdictional claims in published maps and
institutional affiliations.
Open Access This article is licensed under a Creative Commons Attribution 4.0 International
License, which permits use, sharing, adaptation, distribution and reproduction in any medium or
format, as long as you give appropriate credit to the original author(s) and the source, provide a link to the
Creative Commons licence, and indicate if changes were made. The images or other third party material in this
article are included in the article’s Creative Commons licence, unless indicated otherwise in a credit line to the
material. If material is not included in the article’s Creative Commons licence and your intended use is not
permitted by statutory regulation or exceeds the permitted use, you will need to obtain permission directly from
the copyright holder. To view a copy of this licence, visit http://creativecommons.org/licenses/by/4.0/.
© The Author(s) 2021
Scientific Reports | (2021) 11:9400 | https://doi.org/10.1038/s41598-021-88943-9 14
Vol:.(1234567890)You can also read