Conjugate' coseismic surface faulting related with the 29 December 2020, Mw 6.4, Petrinja earthquake (Sisak Moslavina, Croatia)
←
→
Page content transcription
If your browser does not render page correctly, please read the page content below
www.nature.com/scientificreports
OPEN ‘Conjugate’ coseismic surface
faulting related with the 29
December 2020, Mw 6.4, Petrinja
earthquake (Sisak‑Moslavina,
Croatia)
Emanuele Tondi1,6, Anna Maria Blumetti2, Mišo Čičak3, Pio Di Manna2, Paolo Galli4,
Chiara Invernizzi1, Stefano Mazzoli1, Luigi Piccardi5, Giorgio Valentini1, Eutizio Vittori5 &
Tiziano Volatili1*
We provide here a first-hand description of the coseismic surface effects caused by the Mw 6.4 Petrinja
earthquake that hit central Croatia on 29 December 2020. This was one of the strongest seismic events
that occurred in Croatia in the last two centuries. Field surveys in the epicentral area allowed us to
observe and map primary coseismic effects, including geometry and kinematics of surface faulting,
as well as secondary effects, such as liquefaction, sinkholes and landslides. The resulting dataset
consists of homogeneous georeferenced records identifying 222 observation points, each of which
contains a minimum of 5 to a maximum of 14 numeric and string fields of relevant information. The
earthquake caused surface faulting defining a typical ‘conjugate’ fault pattern characterized by Y
and X shears, tension cracks (T fractures), and compression structures (P shears) within a ca. 10 km
wide (across strike), NW–SE striking right-lateral strike-slip shear zone (i.e., the Petrinja Fault Zone,
PFZ). We believe that the results of the field survey provide fundamental information to improve the
interpretation of seismological, GPS and InSAR data of this earthquake. Moreover, the data related
to the surface faulting may impact future studies focused on earthquake processes in active strike-slip
settings, integrating the estimates of slip amount and distribution in assessing the hazard associated
with capable transcurrent faults.
On 29 December 2020 at 11:19 (UTC), a moment magnitude (Mw) 6.4 earthquake struck central Croatia near
the city of Petrinja, a settlement of about 25,000 inhabitants in the region of Sisak-Moslavina, causing 7 casualties
and thousands homeless. The epicentre was 15 km SW of Sisak, the main town of the region, and 45 km SSE of
Zagreb (Figs. 1, 2;1–5). The mainshock was preceded the day before by two foreshocks at 05:28 and 06:49 (UTC
time), with Mw 5.2 and 4.8, respectively.
The seismic sequence came nine months after the Zagreb earthquake, a mainshock of Mw 5.5 that was fol-
lowed by a largest aftershock of Mw 4.9, both occurred on March 22, between 4 and 7 km north-northwest of
Z agreb6 (Figs. 1, 2). In the last two centuries the same area was affected by three moderate earthquakes: on
December 18, 1861 (Mw 5.4), on February 11, 1883 (Mw 5.1), and on October 8, 1909 (Mw 5.7)2 (Fig. 2). The Mw
6.4 Petrinja earthquake occurred at the boundary of the two main geological provinces of Croatia: the Dinarides
mountain belt and the Pannonian Basin (Fig. 1;7,8). The Dinarides, a wide NW–SE striking fold-and-thrust belt
stretching from southwestern Slovenia to Montenegro along the Adriatic coast of Croatia and inland, are the
result of the Alpine collision between the Eurasian and Adriatic tectonic plates (e.g.,9–12). The most prominent
structures of the Dinarides are NW–SE trending folds and thrusts exposed along the SW margin of the Pannonian
1
School of Science and Technology, Geology Division, University of Camerino, Camerino, Italy. 2Italian Institute for
Environmental Protection and Research - Geological Survey of Italy, Roma, Italy. 3Water Management Department
for Middle and Lower Sava Flood Protection Service, Croatian Waters, Slavonski Brod, Croatia. 4Civil Protection
Department, Presidency of the Council of Ministers, Roma, Italy. 5Institute of Geosciences and Earth Resources,
National Research Council, Firenze, Italy. 6National Institute of Geophysics and Volcanology, Roma, Italy. *email:
tiziano.volatili@unicam.it
Scientific Reports | (2021) 11:9150 | https://doi.org/10.1038/s41598-021-88378-2 1
Vol.:(0123456789)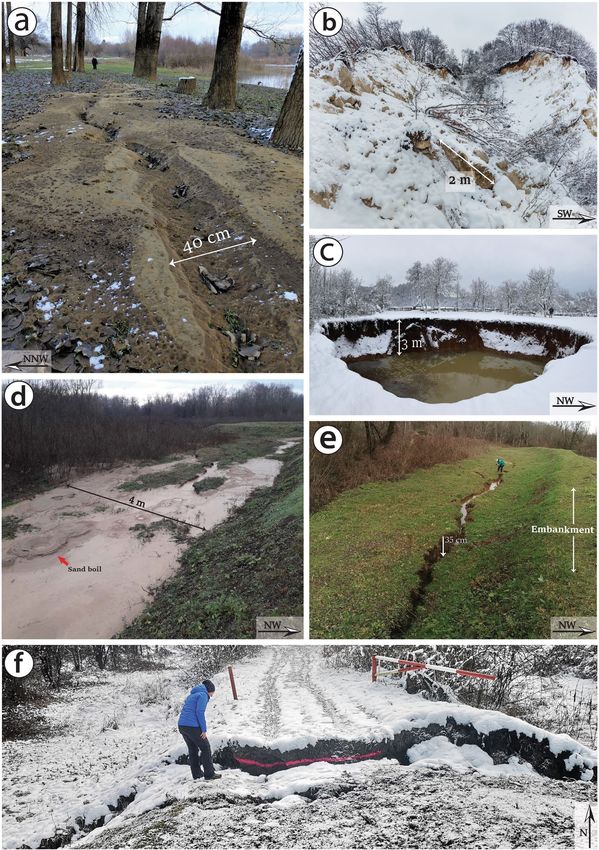
www.nature.com/scientificreports/
Figure 1. Geodynamic setting of the study area within the Dinarides-Pannonian Basin framework (modified
after 1). The location of the main fault belonging to the Petrinja Fault Zone is marked as PFZ. Blue arrows
display horizontal vector motion of permanent Global Navigation Satellite System (GNSS) stations in the
“European fixed” reference frame 3. Dashed box shows the location of Fig. 2 with epicentres of historical
earthquakes from 1000 to 2006 (grey squares) selected from 2 and 4 and instrumental seismicity from 01.01.2007
to 30.11.2020 selected from 5. The epicentre of the Mw 6.4 event of 29.12.2020 is shown for reference (red star).
Basin, a wide depression located in the interior of the arcuate Carpathian mountain chain. The latter joins the
Alps to the west and the Dinarides to the southwest. The Croatian sector of the Pannonian Basin is limited to
the southwest by the Sava sub-basin, a NW–SE oriented tectonic depression showing an asymmetrical shape,
with a gentle slope to the SW and a steep NE flank13. Here, the post-rift sediments are represented by the lower
Pannonian (i.e., lower Tortonian) marly limestones, upper Pannonian (i.e., upper Tortonian) and lower Pontian
(i.e., lower Messinian) turbidite sandstones as well as upper Pontian and Pliocene deltaic and alluvial deposi-
tional systems14,15. All these sedimentary units have been deformed by strike-slip tectonics and are characterized
by positive flower structures that are nowadays still active and seismogenic16,17. This geodynamic framework
originated from the cessation of normal faulting in the Pannonian Basin and the ongoing counter clockwise
rotation of the Adriatic microplate around a pole located in the Western Alps. This dynamic resulted in inver-
sion tectonics dominated by thrusting and strike-slip faulting along the basin margins (e.g.,18,19). The Petrinja
earthquake reflects this geodynamic setting, as the focal mechanism suggests a roughly N-S, horizontal maximum
compression (Fig. 2). The fault plane solution includes nearly vertical southeast and southwest striking nodal
planes. In the Sava sub-basin, active strike-slip fault systems including both NW–SE and NE-SW oriented faults
are reported in the l iterature1,7.
Thanks to the flying of the Sentinel 1A radar satellite of ESA (European Space Agency) over the area struck
by the earthquake already on December 30 (ascending orbit 146), it was possible to compute an InSAR imaging
of the ground deformation caused by the earthquake very soon after the event, allowing to constrain the region
where ground effects were mostly to be expected. The scenes utilized for the interferogram formation shown in
Fig. 2a,b were acquired on December 18 (slave) and 30 (master). The processing was carried out with the SNAP
toolbox of ESA and the SNAPHU software for phase unwrapping. The observed deformation field in the line of
sight (LOS) direction shows on the NW side a maximum shortening of the distance from the satellite of ca. 36 cm,
and a lengthening of the same distance reaching a maximum of ca. 33 cm centred in the area of Petrinja (east of
the ruptured fault). The deformation pattern imaged by the InSAR, considered the ENE-oriented direction of
recording, is interpretable as a right-lateral, north-westward slip of the region west of the Petrinja Fault Zone.
The fringe geometry has served here basically to direct our field observations toward the areas of highest linear
deformation, where tectonic ground ruptures were most likely to be present, and subsequently to compare the
InSAR-imaged deformed region with the distribution and size of geological coseismic effects observed in the field.
As observations of coseismic surface effects are of considerable scientific importance, it is necessary to carry
out the surveys as soon as possible. As a matter of fact, surface effects may be erased by degradation of fault scarps
or by road/infrastructure repair, as well as overprinted by postseismic a fterslip21–23. The engineers of Croatian
Water Management Department started the survey of surface effects immediately after the main shock, while a
working group represented by eight researchers of different Italian institutions (University of Camerino, ISPRA,
CNR, DPC) began surveying the ground coseismic effects on 10 January 2021, working 8 hours a day per person
for the following 8 days. In this report (Map and Dataset) we present earthquake surface ruptures along a ca.
10 km wide (across strike), right-lateral strike-slip shear zone that we term Petrinja Fault Zone (PFZ). Mapping
was carried out using both field observations and aerial surveys using a drone and relative photogrammetry
elaborations. By integrating our observations with available seismological and geodetic data, we also provide an
interpretation and a discussion of the fault ruptures associated with the Mw 6.4 mainshock.
Scientific Reports | (2021) 11:9150 | https://doi.org/10.1038/s41598-021-88378-2 2
Vol:.(1234567890)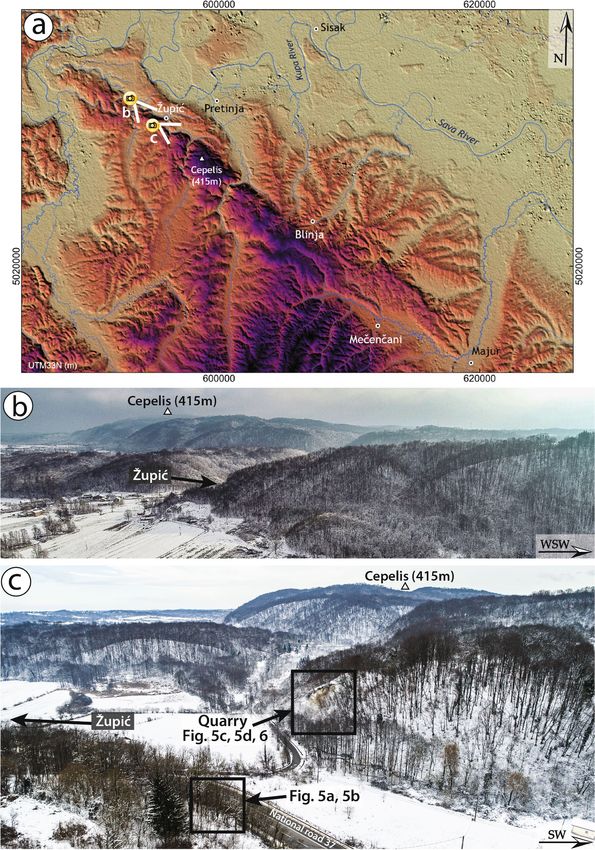
www.nature.com/scientificreports/
Figure 2. Shaded relief map (from ASTER GDEM data, https://asterweb.jpl.nasa.gov/gdem.asp) of the area
affected by the 2020 seismic sequence (orange epicenters, EMSC data; www.emsc-csem.org). Yellow epicenters,
historical seismicity4. Blue dashed lines, main Quaternary active faults (mod. from1); NMF, north Medvednica;
SF, Sava; KF, Kasina. PF, Pokuplje f ault20. Blue dotted line, buried fault in the 1: 100,000 scale Official Geological
Map of C roatia29. Yellow lines, coseismic surface faulting related to the 29 December 2020 Petrinja earthquake.
The focal mechanism of the Kupa Valley earthquake in 1909 is f rom20. Those of 2020 are from18. Panel (a–b)
is an interferometric imagery (Sentinel-1A Ascending orbit, 20,201,224-20,201,230, https://scihub.copernicus.
eu/dhus/#/home) showing surface motion associated with the 29 December 2020 Mw 6.4 earthquake. In (b)
each fringe represents a shift of approximately 2.8 cm along the satellite’s line of sight (LOS), which is oriented
from WSW to ENE; above: actual displacement in cm along the LOS, in blue are the areas with a component of
motion toward the satellite (WSW-ward) and in red areas that have moved away. This implies a right-lateral slip
in the order of several tens of cm. Interferometry analysis from SNAP tool by ESA v.8.0.0 (https://step.esa.int/
main/toolboxes/snap/). The figure was generated by QGIS v. 3.10.2 (https://qgis.org/).
Methods and data records
The description of surface coseismic effects is very important in earthquake geology, as it provides a unique
opportunity to observe short-term time scale deformation. These observations allow a much more robust inter-
pretation of the long-term time scale geological features for seismic and surface faulting hazard evaluation
purposes. Data collected in our survey may contribute to update and integrate the worldwide database aimed at
assessing fault displacement h azard24. Furthermore, the geometry, kinematics, and amount of displacement of
fault ruptures propagated from depth during an earthquake constrain the modelling of seismic sources based on
inversion of geophysical datasets (e.g., strong motion recordings, GPS time-series and InSAR images).
An Unmanned Aerial Vehicle (UAV) was used as a complementary tool of the traditional field work. We
performed aerial Structure from Motion (SfM) photogrammetry, collecting large numbers of overlapping pho-
tos to construct 3D, digital, virtual outcrop models (VOMs;25–27) using Agisoft Metashape software, following
the workflow outlined by28. Digital geologic interpretations and structural data extraction were made using the
Virtual Reality Geologic Studio software (VRGS).
Our surveying, which has led to the recognition and mapping in the epicentral area of the most significant
surface ruptures, their geometry, kinematics, and associated displacement, is summarized in a concise dataset
(Table 1) and map (Fig. 3).
The dataset presented in the Supplementary Material is a text file consisting of 222 records organized into
14 fields. Each record describes a single observation point. The fields have a name and a short name, and are
described as follows:
1. NUMBER (short name: No);
2. DATE (short name: Date);
3. LATITUDE (short name: Lat);
4. LONGITUDE (short name: Long);
Scientific Reports | (2021) 11:9150 | https://doi.org/10.1038/s41598-021-88378-2 3
Vol.:(0123456789)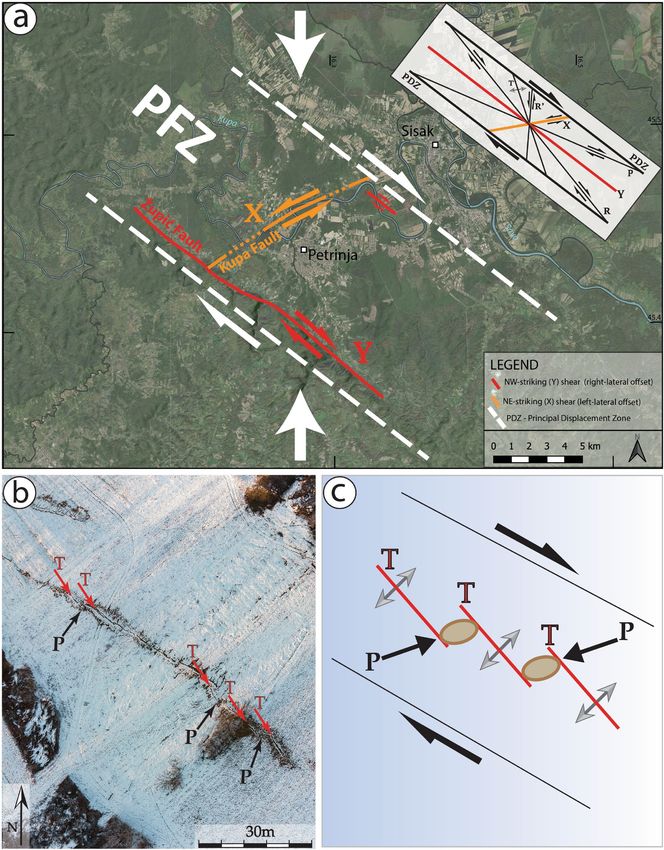
www.nature.com/scientificreports/
No Date Lat Long Obs Sub Strike [deg] Dip dir [deg] Dip [deg] Len [m] Ope [cm] Off [cm] Rak [deg] Vec [deg]
Coseismic shear
1 14/01/21 45.4241 16.2226 Soil 296 26 85 60 5 36 10 297/10
fracture
Coseismic shear
2 14/01/21 45.4241 16.2225 Soil 290 36 85 8 4 36
fracture
Coseismic shear
3 11/01/21 45.424 16.2226 Road 162 252 89 15 8 10
fracture
Coseismic open
4 11/01/21 45.4241 16.2231 Road 323 15
fracture
Coseismic open
5 11/01/21 45.4241 16.223 Road 346 15
fracture
Table 1. Examples of records extracted from the dataset.
5. OBSERVATION (short name: Obs): five categories are defined: “Coseismic shear fracture” (ground break
displaying a perceivable shear offset of the ground surface, i.e. > 1 cm); “Coseismic open fracture” (ground
break with no perceivable shear offset, i.e. 20 cm mean right-lateral horizontal offset. The local
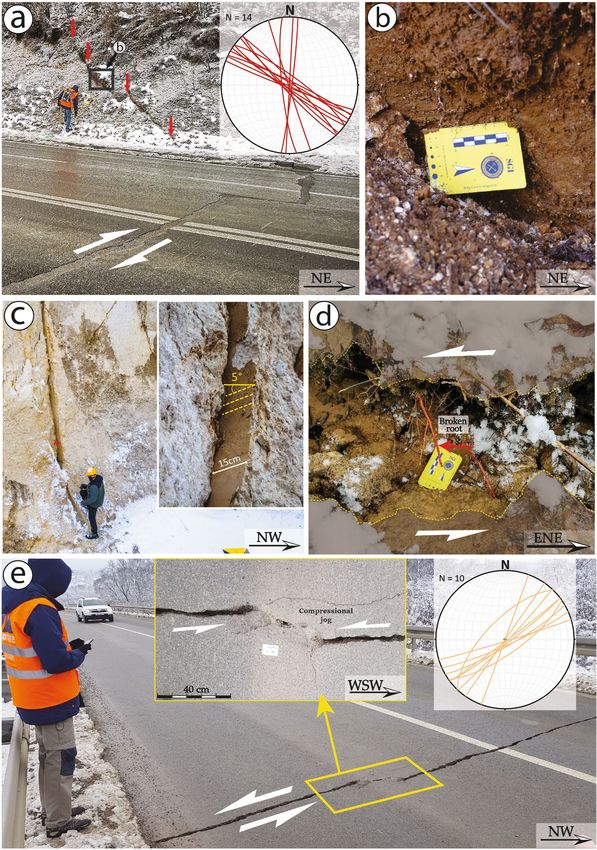
largest offset, up to 36 cm, was observed along the national road 37. Here the coseismic reactivation of the fault
produced a right-lateral offset of the roadside scarp surface along a 120°N striking, steeply NE dipping fault plane
(observation point No. 1 in Figs. 3a, 5a,b). The rupture could be followed across the road, where it attained an
approximate N-S strike (i.e., roughly perpendicular to the road direction, which most probably controlled the
rupture propagation in the asphalt); we observed a right-lateral offset of 10 cm, accompanied by an opening
of 8 cm. The rupture joined a fault plane in a quarry located ca. 180 m to the SE, which was reactivated as well
(observation point No. 22 in Figs. 3, 5c), where poorly lithified Pliocene shallow marine calcareous deposits
outcrop, showing a right-lateral offset of ∼15 cm along a 134°N striking, sub-vertical fault plane (Fig. 6a,b).
Shear fractures associated with this fault were observed also to the NW (observation points No. 109-118 in
Fig. 3) and SE of it (observation points No. 31-43 and 44-74 in Fig. 3), characterized by a right-lateral offset in
Scientific Reports | (2021) 11:9150 | https://doi.org/10.1038/s41598-021-88378-2 4
Vol:.(1234567890)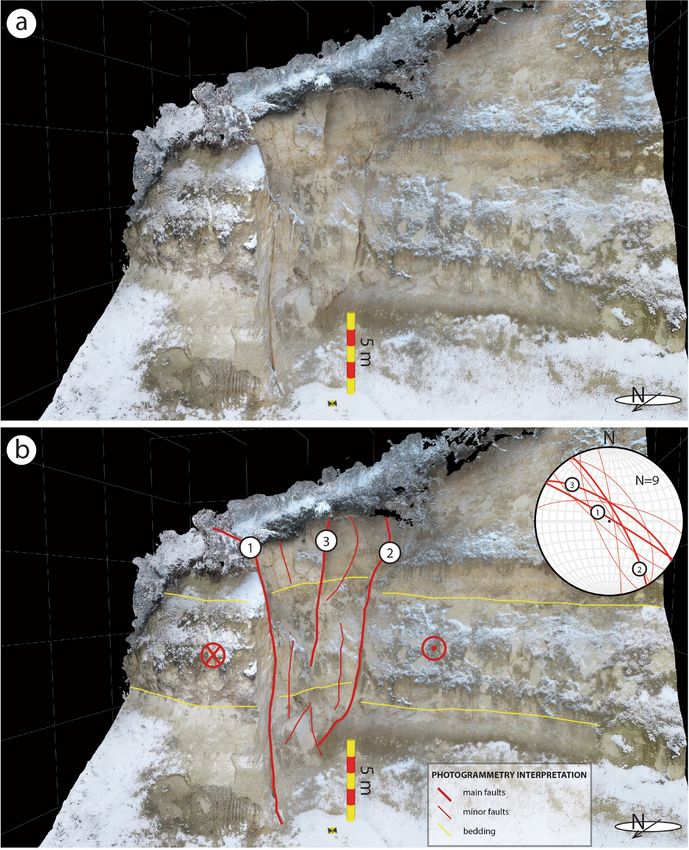
www.nature.com/scientificreports/
Figure 3. (a) Map of surface ruptures measured in the epicentral area of the Petrinja earthquake. Numbers refer to the “No” of records
included in the database. (b) Pie diagram showing the relative proportion of each main type of measured coseismic ruptures. (c)
Stereographic plot (lower hemisphere, equal-area projection) of shear fractures; thicker great circles represent right- and left-lateral planes
with largest strike-slip offset. Below are displacement/length profiles for the Župić (d) and Kupa (e) Faults. The map was generated by
QGIS v. 3.10.2 (https://qgis.org/); satellite image from Google Earth Pro, v. 7.3.3 (https://www.google.com/earth/); the stereographic
projection in (c) was created with Stereonet v. 10.4.6 (http://www.geo.cornell.edu/geology/faculty/RWA/programs/stereonet.html).
Scientific Reports | (2021) 11:9150 | https://doi.org/10.1038/s41598-021-88378-2 5
Vol.:(0123456789)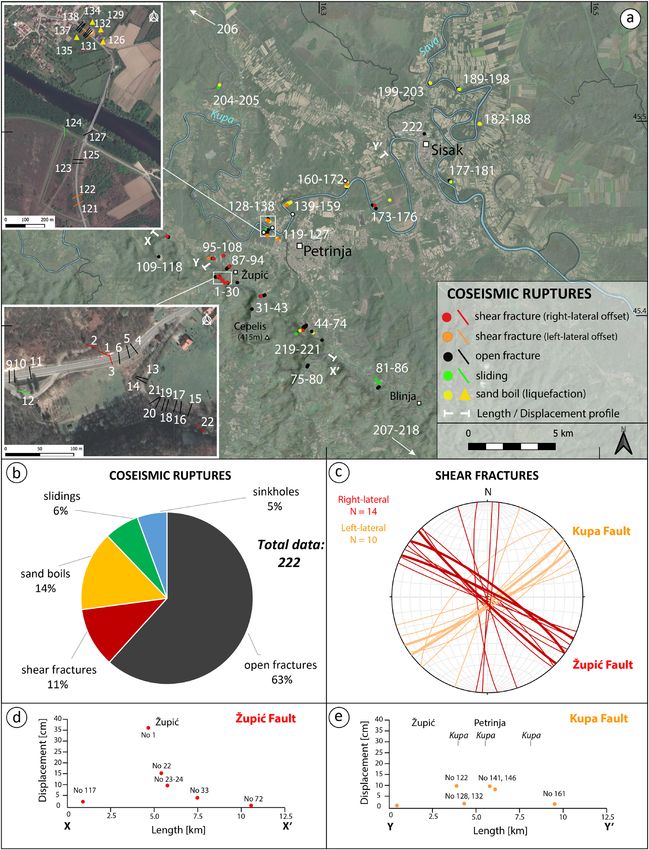
www.nature.com/scientificreports/
Figure 4. (a) Digital Elevation Model (EU-DEM v1.1, 25 m resolution, https://land.copernicus.eu/imagery-in-
situ/eu-dem/eu-dem-v1.1) of the epicentral area of the 29 December 2020 Petrinja earthquake. The direction of
the panoramic views of (b) and (c) are also indicated; (b) Panoramic view of the Župić area showing a portion of
the ridge NW of Župić and the south-eastern ridge in the background (photo acquisition date 12/01/2021); (c)
Panoramic view of the Župić south-eastern ridge area showing the locations of Figs. 5 and 6 (photo acquisition
date 14/01/2021).
Scientific Reports | (2021) 11:9150 | https://doi.org/10.1038/s41598-021-88378-2 6
Vol:.(1234567890)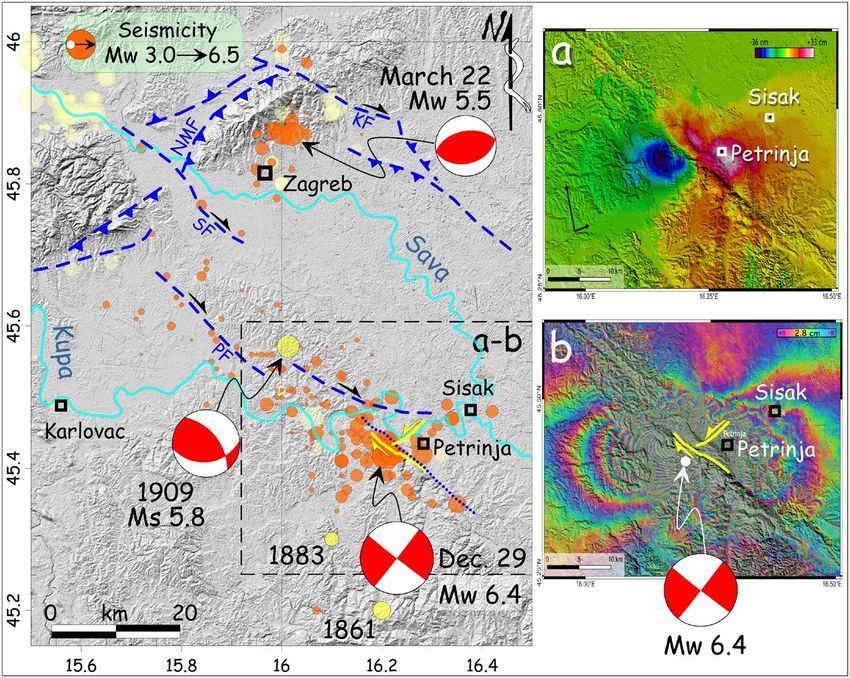
www.nature.com/scientificreports/
the range of 2 to 4 cm and accompanied by several open fractures having approximately the same orientation.
At these observation points, as well as at the observation points No. 81-86 (Fig. 3), the lack of markers on the
road made it difficult or impossible to measure any strike-slip offset. In some cases, it was possible to measure
the shear offset by observing the geometry of the fracture and the relative extensional and compressional jogs
(see the supplementary photo archive included in the database for the extensive documentation on the observed
shear and open fractures). Other minor shear fractures with a right-lateral offset of 1 to 2 cm were seen across
a road immediately to the NE of the Župić Fault (observation points 87-94 and 95-108). Moreover, 10 km NE
of the Župić fault (observation points No. 173-176), a ∼300 m long right-lateral shear zone was identified in the
alluvial plain of the Kupa river. This shear zone was characterized by en echelon open fractures with intervening
mole tracks (see Fig. 8 and photos included in the database).
Between Petrinja and Sisak, along the alluvial plain of the Kupa river, a NE-SW pattern of primary surface
ruptures was also mapped for an end-to-end extent of about 8 km. This feature is here named Kupa Fault
(Fig. 5d,e). It is important to note that these coseismic effects are aligned along a NE-SW striking fault which is
marked as buried in the 1: 100,000 scale Official Geological Map of Croatia29.
The main coseismic surface ruptures along the Kupa Fault consisted of shear fractures displaying > 5 cm left-
lateral horizontal offset, observed along the national road 37 (Fig. 5d,e; observation points No. 128-138), as well
as shear fractures and en echelon open fractures displaying > 10 cm left-lateral horizontal offset detected along
the alluvial plain of the Kupa river (Figs. 5d and 7a,b; observation points No. 139-159). Here, fractures were
generally associated with sand boils produced by liquefaction phenomena, which damaged the banks and the
dam along the Kupa river (Fig. 7e,f). In this area, the assessment of the amount of the left-lateral offset associ-
ated with the NE-SW oriented shear fractures was permitted by the presence of both cut roots and trees located
across these fractures (Fig. 5d).
Secondary effects. Coseismic surface effects related to ground shaking, permanent or ephemeral (e.g.,
landslides, sinkholes and sand boils), were identified in the epicentral area between Petrinja and Sisak (Fig. 3).
In particular, sand liquefaction was widespread along the NE-SW oriented fault zone inside the alluvial plain of
the Kupa River (Fig. 7a,d). These phenomena were often clearly associated with surface ruptures represented by
shear fractures and en echelon open fractures. Immediately NW of Petrinja, both surface rupture and liquefac-
tion phenomena (i.e., sand boil) had seriously damaged the banks and the dam along the Kupa river (Fig. 7e,f),
making it necessary to build an outermost embankment to contain the potential floods.
Landslides mainly matched pre-existing gravitational movements and induced large fractures in the roads.
Rockfall and debris fall occurred in quarry crowns and in correspondence of steep scarps (Fig. 7b). The largest
one occurred in a quarry close to the Hrastovica village, with a total volume exceeding 70 cubic meters, and
single rock blocks up to 2–4 cubic meters. Small landslides were mapped b y30 on the slope next to the parish
church in the village of Viduševac and along the road Kravarsko—D. Hruševac. Minor landsliding was also
present along the river embankments as a result of seismic shaking and consequent liquefaction (Fig. 7f). The
seismic vibration also induced the compaction of the artificial fillings and embankments, causing the formation
of differential settlements and fractures (Fig. 7e).
The very moderate evidence and the limited occurrence of gravitative movements triggered by the earthquake
can be related to the low energy of the relief, as the epicentral zone is mainly located in the plain of the Kupa
river; furthermore, the mountains south-east of Petrinja are characterized by a smooth morphology, without
evident strong changes in slope, except for the escarpment running about NW–SE in the Župić area (Fig. 3).
Collapses and opening of small sinkholes in the ground have been described by the inhabitants in the urban
area of Petrinja, but we were unable to document this effect as the holes had been filled with debris soon after
their formation. A man (Edison Tomas) now living in Župić told us that some holes had already opened 4–5 h
before the main shock in the road close to the house of his daughter in Petrinja with a depth reaching 6 m.
In the Mečenčani area (see Fig. 4), about 20 km southeast of Petrinja, the most impressive effect was repre-
sented by the opening of about 30 sinkholes (observation points No 207-218 in Figs. 3, 4). The sinkholes had
different dimensions, from one to tens of meters in diameter (Figs. 3, 7c) and were several meters deep. All the
sinkholes appeared filled by water up to a depth of about 3 m from the surface, which is the level of the water
table in the alluvial deposits. According to the narration of the locals, the collapses occurred after the earthquake,
with a delay from a few hours to a few days.
The observation of aerial and satellite images clearly shows that in many cases the areas prone to the sinkhole
collapses were already recognizable before the event. Following this approach, many potential sinkholes could be
additionally identified by an aerial (drone) survey of the plain in order to identify the sectors of higher hazard.
In any case, this preliminary analysis needs to be complemented with geophysical prospecting to complete the
mapping of the zones most prone to such highly hazardous phenomenon.
Finally, two likely cases of hydrological anomaly were spotted in the area close to the village of Hrastovica, SE
of Petrinja, where a copious flow of water with sand sprung up from the garage of a house and a nearby geyser-
similar water fountain with a height of 50–70 cm produced a strong increase of the flow rate of the drainage ditch
(observation points No. 219-221 in Fig. 3). Similar geyser-like effects occurred at Brest Popupsky springing from
a water well (observation point No. 126 in Fig. 3).
Discussion
The recognition of coseismic effects in the aftermath of an earthquake is fundamental for individuating primary
surface faulting and its structural arrangement. Understanding the relationship between the seismic source at
depth and its primary evidence at surface creates the basis for using surface active faults to contribute foreseeing
Scientific Reports | (2021) 11:9150 | https://doi.org/10.1038/s41598-021-88378-2 7
Vol.:(0123456789)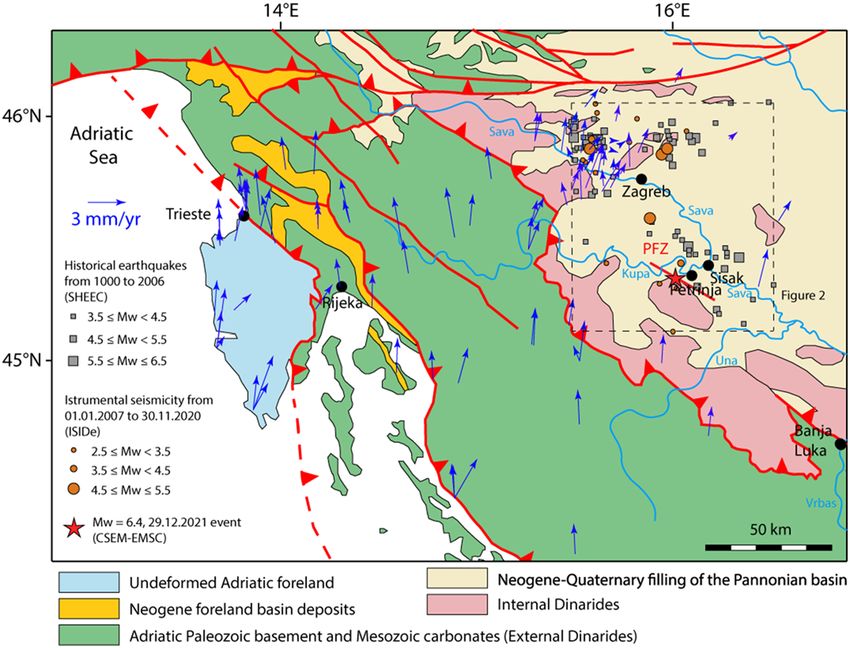
www.nature.com/scientificreports/

          Scientific Reports |   (2021) 11:9150 |   https://doi.org/10.1038/s41598-021-88378-2   8

Vol:.(1234567890)
www.nature.com/scientificreports/
◂Figure 5. Examples of NW–SE to N-S oriented right-lateral strike-slip surface faulting (a–c) and NE-SW to
E-W oriented left-lateral strike-slip surface faulting (d–e): (a) coseismic rupture with right-lateral offset near
the village of Župić (No 1, 14/01/2021) and lower-hemisphere, equal-area projection of the overall coseismic
ruptures with right-lateral offset; (b) close-up of slickenlines on the fault plane (13/01/2021); (c) evidence of
right-lateral surface faulting on bedrock (No 22, 11/01/2021), the inset is a close-up of the fault plane showing
15 cm horizontal offset with slickenlines (rake = 5°); (d) Broken and displaced root (No 149, 13/01/2021)
showing 8 cm left-lateral offset; (e) coseismic rupture in paved road near the village of Brest Pokupski (No
121, 12/01/2021) showing 5 cm left-lateral offset and lower-hemisphere, equal-area projection of the overall
coseismic ruptures with left-lateral offset. The inset shows a close-up of compressional jog. The numbers (No
1) refer to the observation points (indicated in Fig. 3) of the records in the database, while the dates refer to the
photo acquisition.
which structure will rupture next. This work also provides new data on surface coseismic faulting in strike-slip
domains, which is not a common event in the Alpine-central Mediterranean area.
Coseismic surface faulting of the 2019 earthquake is represented by both aligned and en echelon fault seg-
ments, defining the main Župić and Kupa Faults, which display a typical shear zone structural pattern near the
town of Petrinja (here named the Petrinja Fault Zone or PFZ). Geometrically, an idealized shear zone consists
of six principal elements: R and R’ conjugate shears, T tension fractures, P shears, and X and Y shears, which
are all oriented at well-defined angles to the general trend of the shear zone, called the Principal Displacement
Zone or PDZ (Fig. 8b). R and R’ shears form a conjugate Riedel shear s et31. Y and X shears, showing opposite
senses of movement, define a ‘conjugate’ set characterised by different angular relationships (i.e., the maximum
compression axis is parallel to the bisector of the obtuse angle—rather than the acute angle—between Y and X
shears; for this reason, we use the inverted commas for this ‘conjugate’ set, to distinguish it from typical conjugate
faults such as R and R’ shears). Previous studies have shown that R and R’ shears, T tension fractures and P shears
(mole tracks) may form simultaneously along pre-existing strike-slip faults during large-magnitude earthquakes
(e.g.,32–34). On the other hand, X shears forming as ‘conjugate’ faults to the Y faults within coseismic surface rup-
ture zones are not well known to date. The coseismic development of X shears has only recently been reported as
part of the surface ruptures produced by the 2014 Yutian Mw 6.9 (Tibetan) e arthquake35; however, their kinematic
nature and formation mechanisms remain unclear. Therefore, the coseismic ‘conjugate’ fault system described
in this study represents a rare case demonstrating the simultaneous activation of X and Y shear faults during an
earthquake. Coseismic surface deformation associated with the Petrinja earthquake also includes en echelon
tension cracks (T fractures) and mole tracks (or P shears) associated with strike-slip faulting (Fig. 8a,b). Changes
in the orientation of the various structures are a function of the magnitude and localization of the shear strain,
reflecting the different stages in the evolution of the strike-slip shear zone (e.g.,36–39).
The InSAR imaging of the deformation field (Fig. 1) is in good agreement with the field observations, both in
terms of concentration of effects—which are most evident where the InSAR shows the highest displacement—and
in terms of type of displacement expected for a dominantly dextral-slip event. The InSAR imaging of the defor-
mation was particularly helpful to locate the fault and assess its sense of displacement. On the other hand, the
related offsets could not be accurately quantified by this elaboration. The deformation pattern of Fig. 2A points
to a total strike-slip dextral displacement of about 70 cm for the two blocks across the Župić Fault. However,
the InSAR-derived displacement evaluated directly on the fault trace is of about 30 cm. This discrepancy is a
commonly observed feature40, testifying for a near surface distributed deformation that often accommodates
a substantial part of the actual fault slip. Our field measurements of right-lateral offset along the Župić Fault,
reaching a maximum value of 36 cm (Fig. 3b), are therefore fully consistent with the InSAR data. Moreover, the
InSAR-derived deformation pattern clearly defines two domains characterised by a different behaviour within
the SE-slipping, northeastern block of the Župić Fault. These two domains are separated by the map trace of the
Kupa Fault, this being consistent with its left-lateral coseismic motion (Fig. 3c). Since in general the north–south
component of the displacement is not resolved by InSAR due to the orientation of the satellite orbits, left-lateral
slip along the Kupa Fault is mainly marked by horizontal components of motion in the E-W direction. Such a
motion results in an east-ward displacement of the block east of the fault, and a west-ward motion of the block
west of it. While the former adds to the general east-ward movement of the northeastern block of the Župić Fault,
the latter subtracts to it, thus consistently explaining the observed displacement field.
Consistently with the focal mechanisms of the December 29 mainshock, and also of the March 22, 2020,
and of the 1909 event, our field investigations and the analytic results of coseismic ‘conjugate’ shear structures
reveal that the direction of the principal compressive stress is horizontal and roughly N-S trending in the study
area. Coseismic surface ruptures occurred along the PFZ, which represents the Principal Displacement Zone or
PDZ in Fig. 8b. Accordingly, we suggest that coseismic ‘conjugate’ faulting during the 2020 Petrinja earthquake
was mainly controlled by the pre-existing, active strike-slip PFZ within the framework of the present tectonic
stress associated with the ongoing motion of Adria with respect to the Eurasian Plate. Roughly N-S convergence
across the plate boundary, marked by the NW striking Dinaride chain, is recorded by horizontal vector motion
of permanent GNSS stations (Fig. 1). This motion resulted in partitioning of the deformation into dominant
thrusting in the Adriatic frontal part of the Dinarides41 and belt-parallel dextral strike-slip faulting in its interior
(including the area of the present study), as it is typical in regions of oblique plate convergence42.
Conclusions
Following the 29 December 2020, Mw 6.4 Petrinja earthquake, a complex surface faulting pattern was observed
and mapped in the field along the causative PFZ. Based on our study of the co-seismic shear structures, we can
draw the following conclusions:
Scientific Reports | (2021) 11:9150 | https://doi.org/10.1038/s41598-021-88378-2 9
Vol.:(0123456789)www.nature.com/scientificreports/
Figure 6. (a) Virtual outcrop model (from Agisoft Metashape Professional v. 1.6.2, https://www.agisoft.com/)
of the Župić Fault exposed in a quarry in poorly-lithified Pliocene shallow marine calcareous deposits (see also
Fig. 5c). (b) Geologic interpretation and structural data extracted from the Virtual Reality Geologic Studio
software (VRGS v. 2.42, https://www.vrgeoscience.com/), depicts a positive flower structure composed of three
main fault planes.
Scientific Reports | (2021) 11:9150 | https://doi.org/10.1038/s41598-021-88378-2 10
Vol:.(1234567890)www.nature.com/scientificreports/
Figure 7. Examples of sliding, rockfall, fracture, sinkhole, and sand volcanism in the epicentral area of the Petrinja earthquake. (a)
(15/01/2021) and (d) (5/01/2021) Examples of sand boil associated with liquefaction phenomena occurred in the valley of the Kupa
river (No 165, 166, 205). (b) The earthquake triggered some rockfalls along the crown of the quarry close to the village of Hrastovica
(No 64, 12/01/2021). (c) The largest sinkhole opened in the Mečenčani area with a diameter of about 20 m (No 212, 14/01/2021).
(e) Large fracture connected to the sinking of the river dam induced by liquefaction below (No 204, 5/01/2021). (f) Failure of river
embankment induced by liquefaction (No 189, 14/01/2021). The numbers (No 1) refer to the observation points of the records in the
dataset indicated in Fig. 3 and the dates refer to the photo acquisition.
Scientific Reports | (2021) 11:9150 | https://doi.org/10.1038/s41598-021-88378-2 11
Vol.:(0123456789)www.nature.com/scientificreports/
Figure 8. Diagrams showing the main active faults activated during the 29 December 2020 Petrinja earthquake. (a) The Petrinja Fault
Zone (PFZ) is a ca. 10 km wide right-lateral strike-slip shear zone composed by “conjugate” faults in which the Župić and the Kupa
Faults represent (Y) and (X) shears, respectively (satellite image from Google Earth Pro, v. 7.3.3 (https://www.google.com/earth/). The
inset shows the structural features of an idealized shear zone. (b) Tension cracks (T) and mole tracks (P) are developed coseismically
within the NW-striking (Y) and NE-striking (X) shears (observation points No 173-176 in Fig. 3, photo acquisition date 13/01/2021).
The NS oriented arrows indicate the horizontal maximum compression based on geological data, geophysical observations 19 and the
field data obtained in this study. (c) Simplified sketch of Fig. 8b.
Scientific Reports | (2021) 11:9150 | https://doi.org/10.1038/s41598-021-88378-2 12
Vol:.(1234567890)www.nature.com/scientificreports/
1. The co-seismic shear structures were produced by this earthquake along the pre-existing right-lateral strike-
slip PFZ, and they are mainly characterized by Y and X shears, tension cracks (T fractures), and mole tracks
(P shears).
2. The ‘conjugate’ fault structures comprise two sets of coseismic shears that are striking NW–SE and NE-SW.
The NW–SE-trending structure represents a Y shear with right-lateral strike-slip displacement of up to
36 cm, including left-stepping en echelon tension cracks (T) and mole tracks (P). On the other hand, the
NE-SW-trending structure represents a X shear with left-lateral displacement of up to 10 cm, including
right-stepping en echelon cracks (T) and mole tracks (P), which are concentrated in a zone of < 5 m around
individual rupture zones.
Our findings suggest that the coseismic ‘conjugate’ Y and X faulting is mainly controlled by the pre-existing,
active PFZ within the framework of the ongoing northward ‘push’ of the Adria Plate along the margins of the
Pannonian Basin. The regional geodynamic setting of partitioned transpression results in active thrusting in the
outer Dinarides and dominant strike-slip faulting in the interior of the belt, as it occurs in the epicentral area of
the 29 December 2020, Mw 6.4, Petrinja earthquake.
The mapped pattern of coseismic fault ruptures is relevant for improving the assessment of the seismic and
surface faulting hazard of this region, beside the danger related to landslides, liquefaction and sinkholes. More
in general, the prompt, accurate mapping of the coseismic ruptures associated with this moderate magnitude
earthquake contributes to improve our understanding of earthquake faulting processes and to better forecast
the impact of the more energetic earthquakes expected in the Alpine-Dinarides-Albanides orogen, where the
knowledge regarding such phenomena is still modest.
Data availability
All data generated or analysed during this study are included in this published article (and its Supplementary
Information files).
Received: 2 February 2021; Accepted: 12 April 2021
References
1. Tomljenović, B., Csontos, L., Márton, E. & Márton, P. Tectonic evolution of the northwestern Internal Dinarides as constrained
by structures and rotation of Medvednica Mountains, North Croatia. Geol. Soc. Lond. Spec. Publ. 298, 145–167. https://doi.org/
10.1144/SP298.8 (2008).
2. Stucchi, M. et al. The SHARE European earthquake catalogue (SHEEC) 1000–1899. J. Seismolog. 17, 523–544. https://doi.org/10.
1007/s10950-012-9335-2 (2013).
3. Geolab, P. geolabpasaia.org/gnss/agi/maps/EU-DenseVelocities.html#8/45.333/15.520. Accessed 29 Jan 2021.
4. Grünthal, G. & Wahlström, R. The European-Mediterranean Earthquake Catalogue (EMEC) for the last millennium. J. Seismolog.
16, 535–570. https://doi.org/10.1007/s10950-012-9302-y (2012).
5. ISIDe Working Group. Italian Seismological Instrumental and Parametric Database (ISIDe). Istituto Nazionale di Geofisica e
Vulcanologia (INGV). https://doi.org/10.13127/ISIDE (2007). CSEM-EMSC. emsc-csem.org. Accessed 29 Jan 2021.
6. Markušic, S. et al. The Zagreb (Croatia) M5.5 earthquake on 22 March 2020. Geosciences 10(252), 1–21. https://doi.org/10.3390/
geosciences10070252 (2020).
7. Tomljenović, B. & Csontos, L. Neogene-quaternary structures in the border zone between Alps, Dinarides and Pannonian Basin
(Hrvatsko zagorje and Karlovac Basins, Croatia). Int. J. Earth Sci. 90, 560–578. https://doi.org/10.1007/s005310000176 (2001).
8. Schmid, S. M. et al. The Alpine-Carpathian-Dinaridic orogenic system: correlation and evolution of tectonic units (with Sup-
plementary material). Swiss J. Geosci. 101, 139–183. https://doi.org/10.1007/s00015-008-1247-3 (2008).
9. Anderson, H. & Jackson, J. Active tectonics of the Adriatic Region. Geophys. J. Int. 91(3), 937–983. https://doi.org/10.1111/j.1365-
246X.1987.tb01675.x (1987).
10. Battaglia, M., Murray, M. H., Serpelloni, E. & Bürgmann, R. The Adriatic region: an independent microplate within the Africa-
Eurasia collision zone. Geophys. Res. Lett. 31, 1–4. https://doi.org/10.1029/2004GL019723 (2004).
11. Stipcevic, J., Tkalcic, H., Herak, M., Markusic, S. & Herak, D. Crustal and uppermost mantle structure beneath the External
Dinarides, Croatia, determined from teleseismic receiver functions. Geophys. J. Int. 185, 1103–1119. https://doi.org/10.1111/j.
1365-246X.2011.05004.x (2011).
12. Stipcevic, J. et al. Crustal thickness beneath the dinarides and surrounding Areas from receiver functions. Tectonics 37, 1–15.
https://doi.org/10.1029/2019TC005872 (2020).
13. Ustaszewski, K., Herak, M., Tomljenovic, B., Herak, D. & Matej, S. Neotectonics of the Dinarides-Pannonian Basin transition and
possible earthquake sources in the Banja Luka epicentral area. J. Geodyn. 82, 52–68. https://doi.org/10.1016/j.jog.2014.04.006
(2014).
14. Pavelić, D. & Kovačić, M. Sedimentology and stratigraphy of the neogene rift-type north Croatian Basin (Pannonian Basin System):
a review. Mar. Pet. Geol. 91, 455–469. https://doi.org/10.1016/j.marpetgeo.2018.01.026 (2018).
15. Pavičić, I., Rukavina, D., Matoš, B. & Tomljenović, B. Interpretation of the tectonic evolution of the western part of the Sava
Depression: structural analysis of seismic attributes and subsurface structural modeling. J. Maps 15–2, 733–743. https://doi.org/
10.1080/17445647.2019.1663374 (2019).
16. Kastelic, V. et al. Seismogenic sources in the Adriatic Domain. Mar. Pet. Geol. 42, 191–213. https://doi.org/10.1016/j.marpetgeo.
2012.08.002 (2013).
17. Carafa, M. M. C. & Kastelic, V. Earthquake rates inferred from active faults and geodynamics: the case of the External Dinarides.
Bollettino di Geofisica Teorica ed Applicata 55–1, 69–83. https://doi.org/10.4430/bgta0112 (2014).
18. Scognamiglio, L., Tinti, E., Quintiliani, M. Time Domain Moment Tensor. Istituto Nazionale di Geofisica e Vulcanologia (INGV),
https://doi.org/10.13127/TDMT (2006).
19. Bada, G., Horváth, F., Gerner, P. & Fejes, I. Review of the present-day geodynamics of the Pannonian basin: progress and problems.
J. Geodyn. 27(4–5), 501–527. https://doi.org/10.1016/S0264-3707(98)00013-1 (1999).
20. Herak, D. & Herak, M. The Kupa Valley (Croatia) earthquake of 8 October 1909–100 Years Later. Seismol. Res. Lett. 81(1), 30–36.
https://doi.org/10.1785/gssrl.81.1.30 (2010).
21. Civico, R. The open EMERGEO Working Group. Surface ruptures following the 30 October 2016 Mw 65 Norcia earthquake, central
Italy. J. Maps 14, 151–160. https://doi.org/10.1080/17445647.2018.1441756 (2018).
Scientific Reports | (2021) 11:9150 | https://doi.org/10.1038/s41598-021-88378-2 13
Vol.:(0123456789)www.nature.com/scientificreports/
22. Stemberk, J. et al. Strain monitoring of active faults in the central Apennines (Italy) during the period 2002–2017. Tectonophysics
750, 22–35. https://doi.org/10.1016/j.tecto.2018.10.033 (2019).
23. Corradetti, A., Zambrano, M., Tavani, S., Tondi, E. & Seers, D. T. The impact of weathering upon the roughness characteristics
of a splay of the active fault system responsible for the massive 2016 seismic sequence of the Central Apennines, Italy. GSA Bull.
https://doi.org/10.1130/B35661.1 (2020).
24. Villani, F. et al. A database of the coseismic effects following the 30 October 2016 Norcia earthquake in Central Italy. Sci Data 5,
180049. https://doi.org/10.1038/sdata.2018.49 (2018).
25. Tavani, S. et al. Building a virtual outcrop, extracting geological information from it, and sharing the results in Google Earth via
OpenPlot and Photoscan: an example from the Khaviz Anticline (Iran). Comput. Geosci. 63, 44–53 (2014).
26. Pitts, A. D. et al. Sedimentological and stratigraphic signature of the Plio-Pleistocene tectonic events in the Southern Apennines,
Italy: the Calvello-Anzi Basin case study. Mar. Petrol. Geol. 116, 104198. https://doi.org/10.1016/j.marpetgeo.2019.104198 (2020).
27. Jablonska, D. et al. 3D outcrop modelling of large discordant breccia bodies in basinal carbonates of the Apulian margin Italy. Mar.
Petrol. Geol. 123, 104732 (2021).
28. Pitts, A. D. et al. Integrating traditional field methods with emerging digital techniques for enhanced outcrop analysis of deep
water channel-fill deposits. Mar. Petrol. Geol. https://doi.org/10.1016/j.marpetgeo.2017.05.001 (2017).
29. Pikija, M. Geological map, scale 1:100,000, sheet Sisak L 33-93. Federal Geological Office, Beograd, 1987 (in Croatian) (1987).
30. Tomljenović, B., Stipčević, J., Sečanj, M. Izvješće o zabilježenim pojavama kosezmičkih povrsinških deformacijana na području
Pokuplja i Banovine nastalih potresnom serijom od 28.12. 2020. do 5.01.2021. https://www.rgn.unizg.hr/hr/izdvojeno/2790-izvje
sce-o-z abilj ezeni m-p
ojava ma-k oseiz micki h-p
ovrsi nskih-d
eform
acija-n
a-p
odruc ju-p
okupl ja-i-b
anovi ne-n
astal ih-p
otres nom-s erij
om-od-28-12-2020-do-5-01-2021 (2021).
31. Tchalenko, J. S. Similarities between shear zones of different magnitudes. Geol. Soc. Am. Bull. 81, 1625–1640. https://doi.org/10.
1130/0016-7606(1970)81[1625:SBSZOD]2.0.CO;2 (1970).
32. Angelier, J., Bergerat, F., Bellou, M. & Homberg, C. Co-seismic strike-slip fault displacement determined from push-up structures:
the Selsund Fault case, South Iceland. J. Struct. Geol. 26(4), 709–724. https://doi.org/10.1016/j.jsg.2003.07.006 (2004).
33. Tondi, E., Piccardi, L., Cacon, S., Kontny, B. & Cello, G. Structural and time constraints for dextral shear along the seismogenic
Mattinata Fault (Gargano, southern Italy). J. Geodyn. 40, 134–152. https://doi.org/10.1016/j.jog.2005.07.003 (2005).
34. Lin, A. & Chiba, T. Coseismic conjugate faulting structures produced by the 2016 Mw 7.1 Kumamoto earthquake Japan. J. Struct.
Geol. 99, 20–30. https://doi.org/10.1016/j.jsg.2017.05.003( (2017).
35. Li, H. et al. Co-seismic surface ruptures associated with the 2014 Mw 6.9 Yutian earthquake on the Altyn Tagh Fault, Tibetan
plateau. Bull. Seismol. Soc. Am. https://doi.org/10.1785/0120150136 (2016).
36. Ahlgren, S. G. The nucleation and evolution of Riedel shear-zones as deformation bands in porous sandstone. J. Struct. Geol. 23(8),
1203–1214. https://doi.org/10.1016/S0191-8141(00)00183-8 (2001).
37. Katz, Y., Weinberger, R. & Aydin, A. Geometry and kinematic evolution of Riedel shear structures, Capitol Reef National Park
Utah. J. Struct. Geol. 26(3), 491–501. https://doi.org/10.1016/j.jsg.2003.08.003 (2004).
38. Aktar, M., Karabulut, H., Ozalaybey, S. & Childs, D. A conjugate strike-slip faults within the extensional tectonics of Western
Turkey. Geophys. J. Int. 171(3), 1363–1375. https://doi.org/10.1111/j.1365-246X.2007.03598.x (2007).
39. Tondi, E. et al. The Campotosto linkage fault zone between the 2009 and 2016 seismic sequences of central Italy: Implications for
seismic hazard analysis. GSA Bull. https://doi.org/10.1130/B35788.1 (2020).
40. Livio, F., Serva, L. & Gürpinar, A. Locating distributed faulting: contributions from InSAR imaging to probabilistic fault displace-
ment hazard analysis (PFDHA). Quatern. Int. https://doi.org/10.1016/j.quaint.2016.09.034 (2016).
41. Macchiavelli, C. et al. Applying the Multiple Inverse Method to the analysis of earthquake focal mechanism data: new insights
into the active stress field of Italy and surrounding regions. Tectonophysics 580, 124–149. https://doi.org/10.1016/j.tecto.2012.09.
007 (2012).
42. Authemayou, C. et al. Late Cenozoic partitioning of oblique plate convergence in the Zagros fold-and-thrust belt (Iran). Tectonics
https://doi.org/10.1029/2005TC001860fin (2006).
Acknowledgements
Thoughtful and constructive comments by two Anonymous Reviewers, as well as by Editorial Board Member
Yuji Yagi, are gratefully acknowledged. We would like to thank the Italian Embassy in Zagreb for the kind sup-
port to the mission in the field. This work was partly supported by the FAR Unicam project “Novel Approach
for Seismic Hazard Analysis—NoHard’’, responsible Emanuele Tondi.
Author contributions
E.T. wrote the main text, S.M. and P.G. contributed to the conception of the work. T.V. parsed the raw field data
and produced the final dataset. E.V. realized the inSAR imaging. A.M.B., P.D.M. and L.P. described the secondary
coseismic effects. T.V. and G.V. did the main contribution to the figures editing. All coauthors equally contributed
to the field data acquisition and reviewed the final version of the manuscript.
Funding
Funding was provided by University of Camerino, Italy (No. STI000104) and Institute of Geosciences and Earth
Resources, National Research Council, Firenze, Italy.
Competing interests
The authors declare no competing interests.
Additional information
Supplementary Information The online version contains supplementary material available at https://doi.org/
10.1038/s41598-021-88378-2.
Correspondence and requests for materials should be addressed to T.V.
Reprints and permissions information is available at www.nature.com/reprints.
Publisher’s note Springer Nature remains neutral with regard to jurisdictional claims in published maps and
institutional affiliations.
Scientific Reports | (2021) 11:9150 | https://doi.org/10.1038/s41598-021-88378-2 14
Vol:.(1234567890)www.nature.com/scientificreports/
Open Access This article is licensed under a Creative Commons Attribution 4.0 International
License, which permits use, sharing, adaptation, distribution and reproduction in any medium or
format, as long as you give appropriate credit to the original author(s) and the source, provide a link to the
Creative Commons licence, and indicate if changes were made. The images or other third party material in this
article are included in the article’s Creative Commons licence, unless indicated otherwise in a credit line to the
material. If material is not included in the article’s Creative Commons licence and your intended use is not
permitted by statutory regulation or exceeds the permitted use, you will need to obtain permission directly from
the copyright holder. To view a copy of this licence, visit http://creativecommons.org/licenses/by/4.0/.
© The Author(s) 2021
Scientific Reports | (2021) 11:9150 | https://doi.org/10.1038/s41598-021-88378-2 15
Vol.:(0123456789)You can also read