An asymmetric flow focusing droplet generator promotes rapid mixing of reagents
←
→
Page content transcription
If your browser does not render page correctly, please read the page content below
www.nature.com/scientificreports
OPEN An asymmetric flow‑focusing
droplet generator promotes rapid
mixing of reagents
K. I. Belousov1, N. A. Filatov1, I. V. Kukhtevich2,3, V. Kantsler4, A. A. Evstrapov5 &
A. S. Bukatin1,5*
Nowadays droplet microfluidics is widely used to perform high throughput assays and for the
synthesis of micro- and nanoparticles. These applications usually require packaging several reagents
into droplets and their mixing to start a biochemical reaction. For rapid mixing microfluidic devices
usually require additional functional elements that make their designs more complex. Here we
perform a series of 2D numerical simulations, followed by experimental studies, and introduce a novel
asymmetric flow-focusing droplet generator, which enhances mixing during droplet formation due
to a 2D or 3D asymmetric vortex, located in the droplet formation area of the microfluidic device. Our
results suggest that 2D numerical simulations can be used for qualitative analysis of two-phase flows
and droplet generation process in quasi-two-dimensional devices, while the relative simplicity of such
simulations allows them to be easily applied to fairly complicated microfluidic geometries. Mixing
inside droplets formed in the asymmetric generator occurs up to six times faster than in a conventional
symmetric one. The best mixing efficiency is achieved in a specific range of droplet volumes, which
can be changed by scaling the geometry of the device. Thus, the droplet generator suggested here can
significantly simplify designs of microfluidic devices because it enables both the droplet formation and
fast mixing of the reagents within droplets. Moreover, it can be used to precisely estimate reaction
kinetics.
In the past decade droplet microfluidics has been successfully applied to molecular diagnostics for performing
highly sensitive assays such as droplet digital polymerase chain reaction (ddPCR)1, loop-mediated isothermal
amplification (LAMP)2, single-cell genome analysis3–5 and for detecting and screening enzymes activity6. This
technique also found a great application in chemical s yntheses7, especially for syntheses of micro- and nanopar-
ticles with specific requirements8,9. The main advantage of droplet microfluidics is in controlled encapsulation
of femto- to nanoliters volumes of reaction components. Rapid mixing and negligible thermal inertia within
single droplets provide excellent control over reaction conditions, which is ideal for single-cell or single-molecule
assays. In addition, the presence of an interface between two immiscible liquids enables a new interfacial syn-
thetic approach10.
All these applications usually involve encapsulation of biomolecules, single cells, or polymers with required
chemical reagents into individual monodisperse water-in-oil or water-in-oil-in-water droplets. After the encap-
sulation step biochemical or chemical reactions are performed and followed by, for example, fluorescent detection
of the reaction products11,12. Due to low deviations in droplet volumes, all the reactions are carried out under
uniform conditions, which ultimately lead to the high reproducibility of the assays. In single water-in-oil-emul-
sions reaction products in most cases are analyzed with custom fluorescent readers or s orters6,13. Although, for
double emulsions commercial fluorescent activated cell sorters (FACS) can be u sed14,15. In the case of ddPCR,
an alternative way to analyze the product is to specifically couple it with magnetic particles, break the emulsion,
and make the analysis with F ACS16.
One of the key points of performing biochemical reactions and analyze their kinetics in microfluidic devices
is the effective mixing of r eagents17,18. Due to laminar flows corresponding to low Reynolds numbers mixing is
carried out mainly by d iffusion19,20. Diffusion associated mixing time scales with the square of the distance, and
1
Alferov Saint Petersburg National Research Academic University of the Russian Academy of Sciences, Saint
Petersburg, Russia. 2Institute of Silicate Chemistry of RAS, Saint Petersburg, Russia. 3Institute of Functional
Epigenetics, Helmholtz Zentrum München, Neuherberg, Germany. 4Department of Physics, University of Warwick,
Coventry, UK. 5Institute for Analytical Instrumentation of RAS, Saint Petersburg, Russia. *email: antbuk.fiztek@
gmail.com
Scientific Reports | (2021) 11:8797 | https://doi.org/10.1038/s41598-021-88174-y 1
Vol.:(0123456789)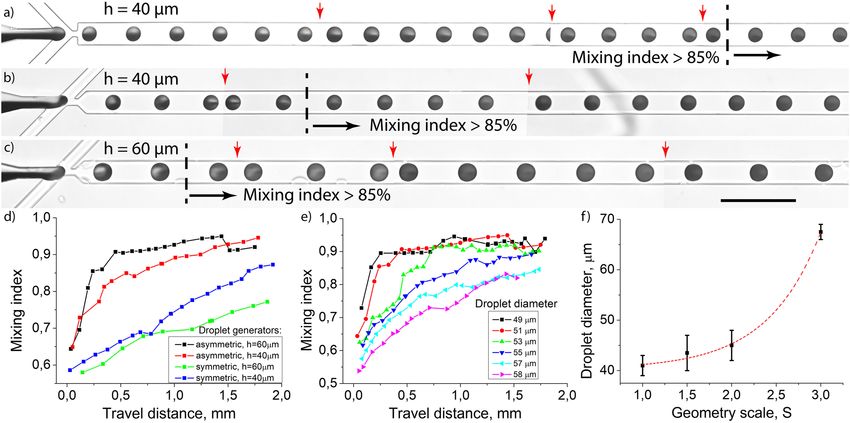
www.nature.com/scientificreports/
it can be a limiting factor with increasing the droplet s ize21. This especially might be crucial for high throughput
and precise enzyme kinetic measurements for drug screening, point-of-care testing, and investigation of viral
fusion22–24. Existing approaches are suggested to accelerate mixing in microfluidic devices introducing differ-
ent types of passive or active mixers. The first type includes microfluidic channels with a special g eometry25,26
or specific microstructures in them27, which facilitate a more efficient interaction of fluids. Active mixers are
equipped with various control elements, which require additional energy, such as electric28 or mechanical29,
for operation. While it is challenging to reach high mixing efficiency in passive mixers, active mixers allow to
mix reaction components more efficiently but consume energy, and overall device design is more complicated.
In a straight microfluidic channel steady recirculating flows inside moving droplets can enhance mixing, but
this is very sensitive to the initial distribution of reagents. This can be achieved by adjusting the relative flow rates
of the continuous and dispersed phases in a T-generator30. The most common way of mixing, which is insensitive
to initial reagents distribution, is to use geometrically induced advection inside droplets. This advection occurs
during its motion in a curved microchannel, located just after the droplet formation region31,32. Unfortunately,
such a curved channel requires additional space and has a cross-section close to droplet size that limits the
generation frequency due to its high hydrodynamic resistance.
In this work we propose a novel asymmetric design of flow-focusing droplet generator, which enhances mix-
ing during droplet formation, doesn’t require additional functional elements, and is more compact in compari-
son with currently available solutions. To define mixing conditions we performed 2D numerical simulations of
fluid flows and reagents distribution in droplets and compared obtained results with a conventional symmetric
device. The simulations showed that different symmetry of the droplet generator design changes the fluid flows
and distribution of reagents in newly formed droplets resulting in different mixing efficiency. Our experimental
studies confirmed the simulation results and showed that complete mixing in droplets, formed in the asymmetric
droplet generator, occurred significantly faster than in conventional symmetric ones.
Results and discussion
Mixing principal. The generation and motion of droplets in a microfluidic device can be described by two-
phase flows of two immiscible liquids. Mineral, silicon, or perfluorinated oils are usually used as a continuous
phase and water-like liquids as a dispersed phase to produce “water-in-oil” emulsion. In contrast with the no-
slip boundary condition on the liquid–solid interface, the liquid–liquid interfaces of such flows are described by
velocity and stress continuity conditions21:
Liquid − liquid interface Liquid−solid
interface
un |in = un |out = Vinterface no − slip
uτ |in = uτ |out (1)
∂uτ
∂uτ
u|interface = Vinterface
µin = µ out
∂r
in ∂r
out
where un and uτ are normal and tangential components of liquid velocity, µ viscosity, V interface velocity of
the liquid–liquid or liquid–solid interface. Due to these boundary conditions in two-phase flows continuous
phase induces two complex vortexes inside a moving droplet, which were recently measured by the micro-PIV
technique33. If droplets are moving in a straight channel, the vortexes locate symmetrically to the center of the
channel. Thus, reagent mixing is limited mainly by diffusion through the boundary between these vortexes.
The boundary conditions also play a key role in the structure of fluid flows during droplet formation. In a
flow-focusing microfluidic device, it occurs in a jetting or dripping m ode34. In the dripping mode, this process is
divided into several stages: filling, necking, and pinch o ff35. During the filling stage, the velocity of the interface
between two liquid phases is much smaller than the velocity of the continuous phase. Thus, the flow of the con-
tinuous phase induces vortexes in the dispersed phase during droplet formation. The symmetry of the channels
determines the symmetry of these vortexes and the aperture inserted before the outlet channel increases the
filling stage time to enhance the impact of these vortexes on the reagents distribution in newly formed droplets.
Therefore, an asymmetric shape of the droplet generator induces an asymmetric vortex in the dispersed phase,
which can improve mixing during the droplet formation.
To figure out how the symmetry of the channels influence on the fluids flows and reagents distribution in
droplets, we considered an asymmetric flow-focusing microfluidic device with side channels arranged at 45°
and 135° to the central channel (Fig. 1a), as well as a symmetric device with side channels arranged at 45° to the
central channel (Fig. 1b). These devices have one inlet for the continuous phase (mineral oil) and two inlets for
the dispersed phase (water and aqueous dye solution). The dye solution was introduced from the lower half of
the dispersed phase channel ( Qd2 at Fig. 1), while the other half was filled with water with zero concentration of
the dye ( Qd1 at Fig. 1). During and after droplet formation we investigated fluid flows and dye distribution inside
the droplets using 2D numerical simulations and experimentally.
Numerical simulations. Mixing efficiency during droplet formation directly depends on the velocity pro-
files of the continuous and dispersed phases in the microfluidic device. The key role in the mixing process
plays the velocity and position of the interface between these phases. Several groups developed approaches
to simulate droplet formation in symmetric flow-focusing d evices36,37 and droplet breakup in the T-junction38.
While 3D simulations provide the most accurate results of the process but require a lot of computing resources,
2D simulations can also provide relevant information about it and have a good qualitative agreement with the
experimental data36,39. Moreover, it allows predicting droplets breakup in the T-junction and accurately simulate
the early stages of the breakup, but can overestimate the neck thickness between two newly formed d roplets37.
Scientific Reports | (2021) 11:8797 | https://doi.org/10.1038/s41598-021-88174-y 2
Vol:.(1234567890)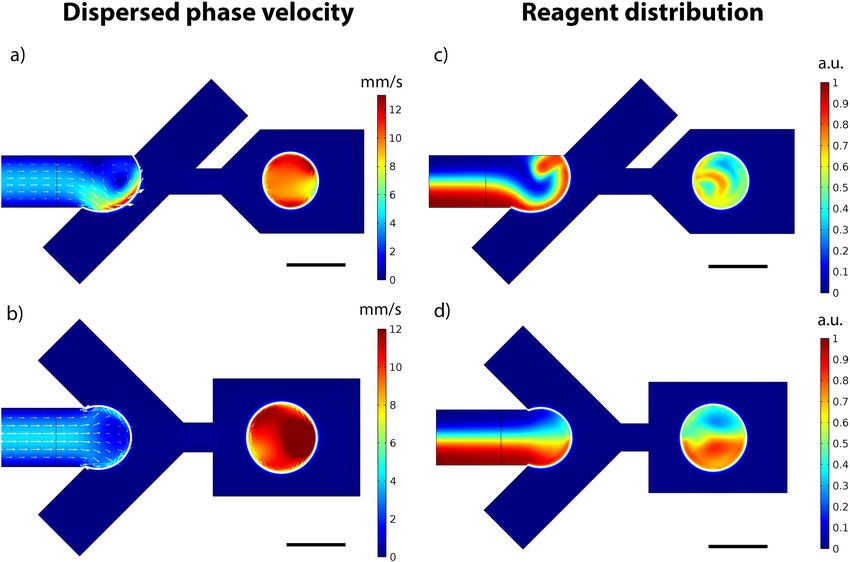
www.nature.com/scientificreports/
Figure 1. Schematics of fluid flows in the flow-focusing droplet generators. (a) The asymmetric design with
side channels arranged at 45° and 135° to the central channel. In this design, the flow of the continuous phase
induces a single vortex in the dispersed phase during the filling stage that enhances mixing. (b) The symmetric
droplet generator with side channels arranged at the angle of 45° to the central channel. In this design, the flow
of the continuous phase induces two vortexes in the dispersed phase and didn’t affect mixing.
Quantitative characterization of droplet generation regimes can be done if the geometry of the device allows
using 2D axisymmetric simulations37.
To test how the symmetry of the flow-focusing region of the droplet generators influence fluid flows and
reagents distribution we ran 2D numerical simulations of the droplet generation for both symmetrical and asym-
metrical generators in Comsol Multiphysics using a similar approach to one described in37. Briefly, Navier–Stokes
equations for incompressible fluids were solved to calculate the velocities. Fick’s second law with the added
convective term was used to model the distribution of a model dye. Displacement of the interface between two
immiscible fluids was described by a phase field φ, which set the spatial distribution of the two phases and took
values from -1 to 1. The isoline φ = 0 represented the liquid/liquid interface. To determine the phase-field, mini-
mization of the system’s free energy was performed by solving the Cahn–Hilliard Eq. 40. The main advantage of
the used phase-field method for simulation of two-phase flows is that it provides the opportunity to calculate con-
tact line displacement with no-slip boundary condition for fluid velocity, reduces pressure jump at the corners,
and prevents artificial vortex in the area of the channels crossing. Moreover, as an interface capturing method, it
provides the opportunity to resolve droplet breakup. Thus, we were able to simulate the whole process of droplet
formation. To obtain reasonably accurate results without a significant increase in computing requirements we
chose mesh size 1 μm in a pinch region and 1.5 μm in the others (Fig. S1).
Although, as the interfacial profile evolves in a flow field, Cahn–Hilliard diffusion may shift the interface
contour and effectively change the size of a drop. This leads to the escape of some reagent quantity from one phase
to another one. To minimize such effect during the simulations the dye was injected in the opposite way that was
shown in Fig. 1a. Such injection decreased the dye contact with the liquid–liquid interface. After the simulations,
the concentration distribution was reversed to compare with experiments (see Material and methods, as well as
Supplementary information, Fig. S2).
The simulations of the droplet formation process show that during the filling stage velocity of the interface is
much lower than the velocity of the continuous phase. This leads to the formation of one or two fluid recircula-
tion vortices in the dispersed phase during the filling stage. These vortexes are induced by the continuous phase
flow due to the boundary conditions on the liquid–liquid interface. In the asymmetric design, this single vortex
is not symmetric to the output channel’s axis, therefore it can influence the reagents distribution inside droplets
and enhance mixing (Fig. 2a,b, video V1). In the symmetric design, similar to what was reported previously33,
there are two vortices located symmetrically that don’t enhance mixing (Fig. 2c,d, video V2). Moreover, fluid
velocity in these vortices is up to twice higher in the asymmetric design than in the symmetric one. In contrast,
the velocity of the interface during the necking and pinch off stages is comparable with the velocities of both
phases, thus, these stages don’t affect mixing efficiency.
We found that the reagents distribution after droplet breakup strongly depended on the mobility tuning
parameter in the Cahn–Hilliard equation. This parameter determines the time scale of the Cahn–Hilliard dif-
fusion and can’t be derived from macroscopic parameters. Thus, we determined its value by comparing the
simulation results with the experimental data and found that in our case the value 1 m∙s/kg showed good agree-
ment over the wide range of flow rates (Fig. S3). Applying this value to our model we observed that the reagents
distribution after droplet breakup in the asymmetric design is not uniform but the uniformity quickly increases
due to the recirculating fluid flows inside moving droplets. Reagents distribution at other values of the mobility
tuning parameter from 0.05 to 10 m s/kg are presented in Fig. S4.
To elucidate how obtained results depend on the absolute values of the flow rates we calculated the Reynolds
number (Re) during the droplet generation. In the aperture Re ~ 1, while in the droplet formation area Re ~ 0.16.
Thus, the flows were laminar but inertia forces could induce Dean flows. According to the previous studies the
Dean flows should be taken into account if the Dean number (De) is about 1041. In the asymmetric geometry of
the droplet generator, the Dean flows√ can appear in the droplet formation area due to the asymmetric vortex. In
this vortex Re ~ 0.16 and De ∼ Re d/R ~ 0.16, where d is the channel hydraulic diameter and R is the flow path
radius of curvature. Thus, the Dean flows in our case may be neglected. However, if the flow rates are 100–1000
times higher the flows will be still laminar but the Dean flows may affect the velocity field distribution and
further enhance mixing.
Scientific Reports | (2021) 11:8797 | https://doi.org/10.1038/s41598-021-88174-y 3
Vol.:(0123456789)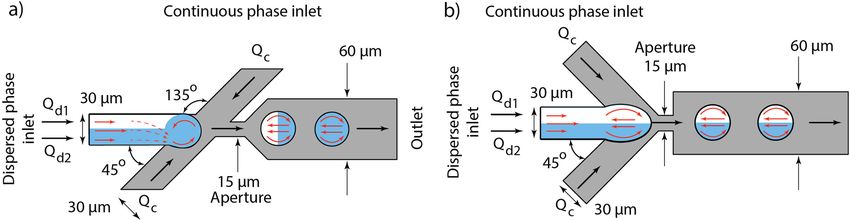
www.nature.com/scientificreports/
Figure 2. 2D simulations of the droplet formation process. (a,b) Dispersed phase velocity profiles during the
filling stage in the asymmetric and symmetric droplet generators. (c,d) Concentration distribution during
droplet formation in the asymmetric and symmetric droplet generators. The continuous phase flow rate is 1 μl/
min. The dispersed phase flow rate is 0.2 μl/min. The concentration is presented in arbitrary units according to
the concentration of the reagent at the entrance boundary, which was set to 1 mol/m3. The scale bar is 30 μm.
Experimental studies. To experimentally investigate how the symmetry of the flow-focusing droplet gen-
erators influence fluid flows and reagents distribution we made microfluidic devices with symmetric and asym-
metric designs from PDMS Sylgrad 184 by standard soft lithography technique42,43. Channels depths of these
devices were 40 μm and 60 μm. Such depths corresponded to aspect ratios of droplet formation area 1:1 and 3:2
respectively and allowed us to test how accurate are the results of performed numerical simulations. Mineral oil
was used as the continuous phase and water as the dispersed phase. Liquids were introduced into the devices by
two syringe pumps (PHD 2000, Harvard Apparatus) from Hamilton syringes with volumes 500 μl and 100 μl.
For micro-PIV and reagents distribution measurements 1 μm tracer particles or Coomassie Brilliant Blue G-250
were added into the dispersed phase.
Two-dimensional micro-PIV measurements of the dispersed phase velocity profile showed that the direction
and structure of the fluid flow in the droplet formation area during the filling stage depended on the symmetry
and the channel depth of the device (Fig. 3, Fig. S5). To estimate the structure of the fluid flow and test if it
was 2D or 3D we used the continuity equation for incompressible fluid div(V) = 0. According to this equation
distribution of dimensionless value K = div(V2D)*h/|V2D|, where V 2D is the velocity obtained by 2D PIV, h is the
channel’s depth, can indicate the three-dimensional structure of the flow, as it is proportional to the magnitude
of the sinks and sources in the projected 2D flow field (Fig. S6). In the symmetric geometry, the fluid flow con-
sisted of two symmetric vortexes with a sink in the center regardless of the channel aspect ratio. In contrast, in
the asymmetric droplet generators, the structure and direction of the fluid flow strongly depended on the depth
of the channels due to different positions of the interface between dispersed and continuous phases during the
filling stage (Fig. 3a–c, Video V3–V6). The vortex attained a complex 3D flow structure with an increase in the
aspect ratio from 1:1 (channel depth—40 μm) to 3:2 (channel depth h = 60 μm). This led to changing the fluid
flow direction from counter-clockwise to clockwise regardless of the flow rates of the dispersed and continuous
phases. Moreover, in both asymmetric geometries, these vortexes were asymmetric and their maximum velocity
was several times higher than in the symmetric geometry, which corresponded to higher Taylor dispersion due
to a higher Peclet number.
To determine how changes in the droplet generator’s geometry and fluid flows will influence the droplet
parameters we measured their diameters and generation frequencies at various flow rates of the dispersed phase,
while the flow rate of the continuous phase Qc was 1 μl/min (Fig. 3j, Fig. S7). In all cases, the generation regimes
Scientific Reports | (2021) 11:8797 | https://doi.org/10.1038/s41598-021-88174-y 4
Vol:.(1234567890)www.nature.com/scientificreports/
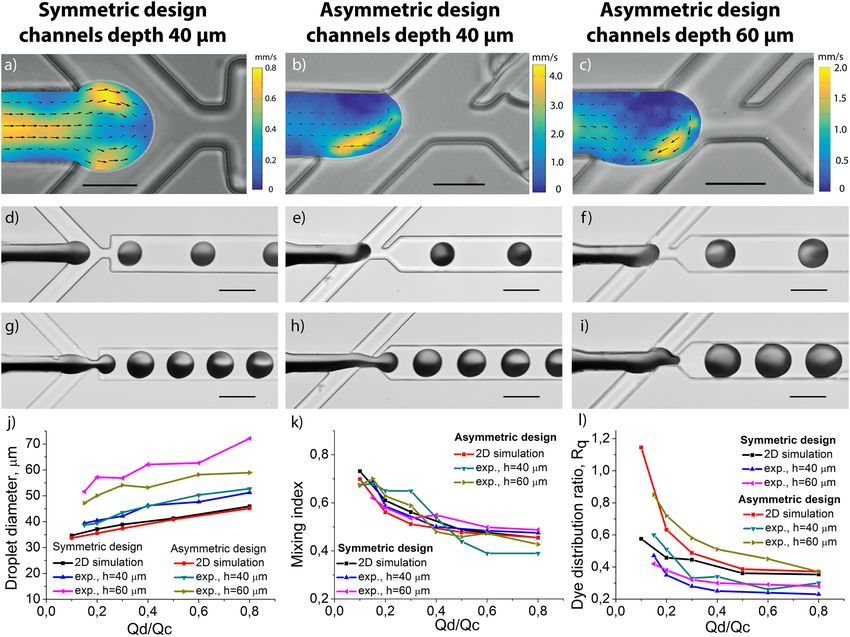
Figure 3. Experimental characterization of the droplet formation process. (a–c) PIV measurements of the
dispersed phase velocity profile during the filling stage of the droplet formation process in symmetric and
asymmetric generators. (d–i) Coomassie Brilliant Blue G-250 packaging into droplets in symmetric and
asymmetric droplet generators. (j) Droplet diameters at different flow rates of the dispersed and continuous
phases. (k) Mixing index in newly formed droplets in different microfluidic droplet generators. (l) Dye
distribution ratio R
q at different flow rates. Dispersed phase and continuous phase flow rates Qd and Qc were
(a–f) 0.2 μl/min and 1 μl/min, (g–i) 0.6 μl/min, and 1 μl/min, respectively. (j–l) Continuous phase flow rate was
Qc = 1 μl/min. The scale bar is 30 μm in (a–c) and 60 μm in (d–i).
were stable with the coefficient of variation of the droplet diameter less than 4%. The measurements showed that
they linearly depended on the ratio between the flow rates of the phases. If the aspect ratio of the droplet forma-
tion area is 1:1 (channel depth is 40 μm), the diameters and generation frequencies of droplets that were formed
in the symmetric and asymmetric generators are close to each other and close to the simulation results. For the
aspect ratio 3:2 (channel depth is 60 μm), droplet diameters and generation frequencies strongly depend on the
device symmetry resulting in up to 30% larger diameter and higher frequencies in the symmetric geometry.
To investigate the mixing enhancement caused by the asymmetric vortexes in the droplet formation area
we studied dye distribution in droplets during their traveling in the straight output channel. It was based on
the measurements of light intensity inside the droplets that corresponded to the dye concentration and included
calculations of the mixing index (MI)44 and the dye distribution ratio R d between the its quantities in the top
and bottom halves of the droplets:
21
(c − c)2 dA
Qup
MI = 1 − , Rd = , (2)
A · c(cmax − c) Qdown
where A is the droplet area, c is the concentration of the dye, c and cmax are the average and the maximum con-
centrations of the dye within a droplet respectively, Qup and Qdown are the dye quantities in the upper and lower
halves of a droplet.
Dye distribution measurements (Fig. 3d–i) show that due to the asymmetric vortex the quantity of the dye
in the upper half of the droplet increases. Immediately after the droplet formation, the mixing indexes are close
to being similar for all considered droplet generators regardless of their design and channel depths (Fig. 3k). For
Scientific Reports | (2021) 11:8797 | https://doi.org/10.1038/s41598-021-88174-y 5
Vol.:(0123456789)www.nature.com/scientificreports/
Figure 4. Evolution of the dye distribution during droplet migration in the straight output channel. Droplet
generation and Coomassie Brilliant Blue G-250 packaging in the flow-focusing droplet generators with (a)
symmetric geometry and the channel depth h = 40 μm, (b) asymmetric geometry and the channel depth
h = 40 μm, (c) asymmetric geometry and the channel depth h = 60 μm. (d) Mixing index evolution during
droplet migration in the straight output channel in different droplet generators (Qc = 1 μl/min, Qd = 0.2 μl/min).
(e) Mixing index evolution inside droplets of different diameters formed in an asymmetric droplet generator
with channels depth h = 60 μm. (f) Droplet diameter range with > 85% mixing efficiency after 0.6 mm travel in
the output channel with different scaling of the droplet formation area S. Red dashed line is an eye guide. The
scale bar (a–c) is 200 μm. Images (a–c) are mosaic images captured one after another in a single experiment, the
red arrows indicate the stitching points.
small droplets with 35–45 μm diameter (30–50 pl volume), the mixing index is about 0.6–0.7 and decreases with
the droplet size increase. In contrast, the distribution ratio Rd strongly depends on the symmetry of the droplet
generators (Fig. 3l). In the asymmetric devices, it is significantly higher than in the symmetric ones. For small
droplets (diameter 35–45 μm), MI ~ 1 and decreases while the volume of the droplet increases. For large droplets
(diameter 45–60 μm) this ratio is similar for all of the devices. Such behavior indicates that direct mixing doesn’t
occur during droplet formation due to the short duration of this stage. Indeed, the asymmetric vortexes change
the reagents distribution in newly formed droplets and these changes are significant when droplets volume is
close to the volume of the droplet formation area. Our further simulations show that these changes monotoni-
cally depend on the angle between the side channels and the central channel and are relatively strong because in
asymmetric geometry the mixing index is almost independent of the diffusion coefficient in the range 1 0–10–10–11
m2/s, while in the symmetric geometry it rapidly decreases (see Fig. S8).
The direction and velocity field of the fluid flow in the droplet formation area of the asymmetric device with
channel depth 40 μm (aspect ratio 1:1) is very similar to the simulation results. Surprisingly, with the depth
increased to 60 μm (aspect ratio 3:2) the recirculating vortex shows the opposite direction. At the same time,
experimentally determined values of mixing index and distribution ratio Rd in the devices with channels’ depth
60 μm are closer to the simulation results than for the devices with channels’ depth 40 μm. Such differences
indicate that in our case 2D simulations are appropriate only for qualitative analysis.
After formation, the droplets started migrating along the straight channel to the outlet. During this migra-
tion, the reagents began mixing due to the recirculating fluid flows and diffusion inside the droplets. This led
to a mixing index increase. Our experiments showed that the efficiency of this process depended on the initial
reagents distribution directly after droplet formation (Fig. 4), in line with previous s tudies30. Thus, the symme-
try of the flow focusing area, channel depth, and droplet volume directly affect it. In the case of droplets with
42 µm in diameter (volume 39 pl) formed in an asymmetric droplet generator with channels depth 40 µm, the
generation frequency was 50 Hz and the mixing index of 0.85 was observed after 60 ms when droplets passed
0.55 mm in the strait output channel (Fig. 4a). If the depth of the channels was 60 μm, due to the 3D flows the
mixing time was up to 0.85 level in 51 μm droplets (volume 69 pl) in 30 ms when droplets passed 0.24 mm in
the output channel (Fig. 4b). In the case of the symmetric design with channels height 40 μm, we observed the
same results only after 200 ms when droplets 40 μm in diameter passed 1.7 mm in the output channel (Fig. 4c).
In the symmetric design with channels height 60 μm and after passing 2 mm in the output channel, the mixing
index was only 0.8 for the smallest droplets with 47 μm in diameter.
Scientific Reports | (2021) 11:8797 | https://doi.org/10.1038/s41598-021-88174-y 6
Vol:.(1234567890)www.nature.com/scientificreports/
The optimal volume of droplets for effective mixing can be defined as the volume of the droplet formation
area. After increasing their size mixing efficiency decreases regardless of the channel depth (Fig. 4d,e, Fig. S9).
If the depth is 60 μm (aspect ratio is 3:2) and droplet diameter increased from 50 to 55 μm (volume 62 pl to 83
pl) the improved mixing effect of the asymmetric geometry almost neglects (Fig. 4e). Thus, for effective mixing
droplet diameter should vary less than 10% from the optimal value. In this case, volume variations can be 30%.
We found similar relations for droplet generators with the channel depth of 40 μm (Fig. S10).
In comparison with the symmetric geometry (Fig. 4d, Fig. S10), for small droplets, the mixing efficiency is
much higher in the asymmetric devices, although for large droplets it becomes similar. According to this, the
asymmetric geometry provides effective reagent mixing in a 30% range of possible droplet volumes. To overcome
this limitation, scaling of the droplet generation area may be used, while the whole size of the microfluidic device
and fluidic connectors’ locations can be kept the same. We tested four droplet generators with different scaling of
the droplet formation area with equal depth of the channels and found that diameters of droplets where effective
mixing occured increased with the scaling factor S = A2/A1, where Ai is the square of the droplet formation area
(Fig. 4f). We found that scaling the geometry 3 times caused the generation of droplets with up to 4 times larger
volumes with effective reagent mixing. This increase is nonlinear due to the complex behavior of the droplet
size depending on the geometry, aspect ratio, and the capillary numbers34,45. Thus, for each droplet diameter, the
geometry of the droplet formation area should be determined individually to achieve the most efficient mixing.
Conclusions
Here we developed, numerically simulated, and experimentally characterized a novel asymmetric design of flow-
focusing droplet generator. This design enables the formation of a single asymmetric recirculation vortex in the
dispersed phase during the droplet formation stage, which leads to an improvement in mixing speed. We found
that the direction and velocity field of this vortex directly depends on the aspect ratio of the flow focusing area.
For a 1:1 ratio (channels depth 40 μm), the vortex is counter-clockwise and mostly two-dimensional, which is
very close to the simulation results. If the aspect ratio increases up to 3:2 (channels depth 60 μm) the interface
between the continuous and dispersed phase changes its location, which leads to changing of the flow direction
to clockwise, and the flow becomes predominantly three-dimensional.
We unraveled that the mixing index directly after droplet formation doesn’t depend on the design of the
droplet generator. Strikingly, due to the different initial distribution caused by the asymmetric vortex reagents
mixing occurs up to six times faster in the asymmetric flow-focusing device than in the conventional symmetric
one. The limitation of the proposed design is that the effective mixing occurs only in a narrow range of droplet
volumes, which are close to the volume of the droplet formation area. To overcome it the droplet formation area
can be scaled up to achieve the required droplet sizes.
Our studies showed that 2D numerical simulations can provide useful qualitative information about two-
phase flows and droplet generation processes in quasi-two-dimensional devices. The relative simplicity of such
simulations allows them to be easily applied to fairly complicated microfluidic geometries. The asymmetric
design of the flow-focusing droplet generators, suggested in this work, provides significantly better mixing
efficiency in comparison with the designs without additional mixing elements described before. We believe that
the asymmetric design can find numerous applications and improve existing microfluidic devices for precise
enzyme kinetic measurements, monitoring of different processes in real-time, and point-of-care devices, where
reduction of the reagents mixing time and device simplicity is critical.
Materials and methods
Numerical simulations. Two-dimensional simulations of the droplet formation process in flow focusing
microfluidic devices were performed in COMSOL Multiphysics (COMSOL Inc., Burlington, MA) using “Lami-
nar Two-Phase Flow, Phase Field” and “Transport of Diluted Species” modules. In these simulations water with
ρd = 1000 kg/m3 and dynamic viscosity μd = 0.001 Pa∙s was considered as the dispersed phase and oil with density
ρc = 840 kg/m3 and dynamic viscosity μd = 0.03 Pa∙s was considered as the continuous phase. The flow rate of the
continuous phase Q c was varied from 0.1 μl/min to 10 μl/min at capillary numbers Ca = 0.01–1, and the flow
rate of the dispersed phase Q d was varied from 0.01 to 1 μl/min at capillary numbers Ca = 0.005–0.5. For these
capillary numbers, droplet generation should occur in the dripping m ode34. The surface tension σ at the oil–
water boundary was set to 0.05 N/m without taking into account the surfactant, because it covered the interface
and stabilizes droplets in several milliseconds after their formation46. The diffusion coefficient was set to 3.5 *
10–10 m2/s, which corresponded to the diffusion coefficient of small molecules and fluorescent dyes with similar
molecular weights such as sugar, Cy5, Alexa 647, Alexa 633, and others47–49.
Navier–Stokes equations for incompressible fluid were solved to calculate the velocity. Fick’s second law with
the added convective term was used for modeling the distribution of reagent concentration. Displacement of the
interface between two immiscible fluids was described by a phase field, which set the spatial distribution of the
two phases and took values from − 1 to 1. To determine the phase-field minimization of the system’s free energy
was performed by solving the Cahn–Hilliard Eq. 40. The mesh size was chosen 1 μm in a pinch region and 1.5 μm
in the others after the convergence studies (154,949 degrees of freedom) (Fig. S1). For a detailed description of
the simulation procedure please see the supplementary information.
For the Navier–Stokes equations at the entrance boundaries average velocities of the dispersed and continu-
ous phases were defined according to the desired flow rates and the thickness of the channels, which was 40 μm
in all the simulations. At the outlet boundary zero pressure was set. For the convection–diffusion equations at
the half of the entrance boundary of the central channel (Fig. 1) reagent of unit concentration 1 mol/m3 was
set. The other half was matched to the buffer with zero concentration of the reagent. At the outlet boundary the
reagent flux was set to zero.
Scientific Reports | (2021) 11:8797 | https://doi.org/10.1038/s41598-021-88174-y 7
Vol.:(0123456789)www.nature.com/scientificreports/
Experimental. Microfluidic flow-focusing droplet generators were made by standard soft lithography
technique42,43. At first, a single layer SU-8 photoresist mold was fabricated using contact optical lithography with
a chromium mask. The PDMS prepolymer and the curing agent (Sylgrad 184, Dow Corning) were mixed in a
ratio of 10:1 w/w, degassed, poured into the mold, and cured at 65 °C for 4 h in an oven. After the curing step,
the PDMS replica with punctured inlet and outlet holes was bonded with cover glass slides by oxygen plasma
treatment. Inlets for continuous and dispersed phases contained 5 μm and 20 μm filters, respectively, to prevent
clogging. Channels depth was 40 μm and 60 μm, which corresponded to the aspect ratios of droplet formation
area 1:1 and 3:2 respectively. The aspect ratios were calculated using the following equation: AspectRatio = √D ,
A
where D is the channels depth and A is the square of the droplet formation area. All the inner surfaces of the
channels were covered with a commercially available hydrophobic coating AntiRain Repellent (Turtle Wax,
USA) to achieve the contact angle ~ 100°.
Light mineral oil (Sigma Aldrich, cat. No M8410) of density 840 kg/m3, viscosity 0.03 Pa*s with 3.5% w/w
ABIL EM 180 surfactant (Evonik Nutrition & Care GmbH) was used as the continuous phase. MilliQ DI water
was used as the dispersed phase. For fluid velocity measurements, 1 μm tracer particles (Polysciences Inc., cat.
No 08226-15) were added into the dispersed phase. To study mixing of small molecules Coomassie Brilliant Blue
G-250 (Sigma-Aldrich, cat. No 1154440025) was added into one of the dispersed phases.
The continuous and one or two dispersed phases were loaded into the Hamilton syringes with volumes 500 μl
and 100 μl respectively, inserted into two syringe pumps (PHD 2000, Harvard apparatus, USA), and introduced
into a microfluidic droplet generator at constant flow rates in the range 0.1–2 μl/min.
High-speed image acquisition (1000–6000 fps) was done by SC-1 camera (Edgertronic, USA) coupled with an
inverted optical microscope Nikon Eclipse TE2000 with a 40 × NA 1.4 objective lens. PIV analysis was performed
by the PIV lab s oftware50. To obtain static images of droplets with Coomassie Brilliant Blue G-250 a 20 × NA
0.75 objective lens and a Nikon D3000 camera were used. The focus of the lens was adjusted at the center of the
outlet channel of the device according to the maximum contrast of the droplets border. To calculate the mixing
index inside droplets all color images were converted to black and white extracting data from the red channel.
The red channel was chosen according to the absorption of the dye, which was in the range of 550–700 n m51.
Light intensity inside droplets was used to calculate relative dye distribution and the mixing index by a custom
Matlab script using Eq. (2). Briefly, all the droplets were manually selected from the images. Then for each droplet
maximum and average concentrations of the dye were calculated analyzing the color of each pixel. The image of
a single droplet was about 250 × 250 px2, the 20 px border of the droplets was ignored due to the high light scat-
tering on the curved surface of the interface and interaction with the channel borders. To make the calculations
more precise we inverted the images and normalized the intensity of the pixels inside droplets to the intensity
of the pixels with zero and maximum dye concentration in the inlet channel before the droplet formation area.
After this normalization, all the pixels had values from 0 to 1.
Received: 11 January 2021; Accepted: 22 March 2021
References
1. Hudecova, I. Digital PCR analysis of circulating nucleic acids. Clin. Biochem. 48(15), 948–956 (2015).
2. Rane, T. D., Chen, L., Zec, H. C. & Wang, T.-H. Microfluidic continuous flow digital loop-mediated isothermal amplification
(LAMP). Lab. Chip. 15(3), 776–782 (2015).
3. Wallrapp, A. et al. The neuropeptide NMU amplifies ILC2-driven allergic lung inflammation. Nature 549(7672), 351–356 (2017).
4. Rotem, A. et al. High-throughput single-cell labeling (Hi-SCL) for RNA-seq using drop-based microfluidics. PLoS ONE https://
doi.org/10.1371/journal.pone.0116328 (2015).
5. Matuła, K., Rivello, F. & Huck, W. T. S. Single-cell analysis using droplet microfluidics. Adv. Biosyst. 4, 1900188 (2020).
6. Mazutis, L. et al. Single-cell analysis and sorting using droplet based microfluidics. Nat. Protoc. 8, 870–891 (2013).
7. Ji, J. et al. Interfacial organic synthesis in a simple droplet-based microfluidic system. Lab Chip 12, 1373 (2012).
8. Kaminski, T. S. & Garstecki, P. Controlled droplet microfluidic systems for multistep chemical and biological assays. Chem. Soc.
Rev. 46, 6210 (2017).
9. Choi, A., Seo, K. D., Kim, D. W., Kim, B. C. & Kim, D. S. Recent advances in engineering microparticles and their nascent utiliza-
tion in biomedical delivery and diagnostic applications. Lab Chip 17, 591–613 (2017).
10. Abalde-Cela, S., Taladriz-Blanco, P., Ganzarolli de Oliveira, M. & Abell, C. Droplet microfuidics for the highly controlled synthesis
of branched gold nanoparticles. Sci. Rep. 8, 2440 (2018).
11. Solvas, X. C. et al. Fluorescence detection methods for microfluidic droplet platforms. J. Vis. Exp. 58, e3437 (2011).
12. Lim, J., Gruner, P., Konrad, M. & Baret, J.-C. Micro-optical lens array for fluorescence detection in droplet-based microfluidics.
Lab Chip 13, 1472–1475 (2013).
13. Regan et al. Analysis of nucleic acids. US Patent 9,127,312 B2, Sep. 8, 2015
14. Terekhov, S. S. et al. Microfluidic droplet platform for ultrahigh-throughput single-cell screening of biodiversity. PNAS 114(10),
2550–2555 (2017).
15. Sukovich, D. J., Lance, S. T. & Abate, A. R. Sequence specific sorting of DNA molecules with FACS using 3dPCR. Sci. Rep. 7, 39385
(2017).
16. Dressman, D., Yan, H., Traverso, G., Kinzler, K. W. & Vogelstein, B. Transforming single DNA molecules into fluorescent magnetic
particles for detection and enumeration of genetic variations. PNAS 100(15), 8817–8822 (2003).
17. Thiele, M. et al. Combination of microfluidic high-throughput production and parameter screening for efficient shaping of gold
nanocubes using Dean-flow mixing. LabChip 17, 1487 (2017).
18. Mao, Z. et al. Label-free measurements of reaction kinetics using a droplet-based optofluidic device. J. Lab. Autom. 20(1), 17–24
(2015).
19. Suh, Y. K. & Kang, S. A review on mixing in microfluidics. Micromachines 1, 82–111 (2010).
20. Capretto, L., Cheng, W., Hill, M. & Zhang, X. Micromixing within microfluidic devices. Top. Curr. Chem. 304, 27–68 (2011).
21. Baroud, C. N., Gallaire, F. & Dangla, R. Dynamics of microfluidic droplets. LabChip 10, 2032–2045 (2010).
Scientific Reports | (2021) 11:8797 | https://doi.org/10.1038/s41598-021-88174-y 8
Vol:.(1234567890)www.nature.com/scientificreports/
22. Bui, M.-P.N. et al. Enzyme Kinetic measurements using a droplet-based microfluidic system with a concentration gradient. Anal.
Chem. 83, 1603–1608 (2011).
23. Hassan, S., Nightingale, A. M. & Niu, X. Continuous measurement of enzymatic kinetics in droplet flow for point-of-care monitor-
ing. Analyst 141, 3266–3273 (2016).
24. Mashaghi, S. & Oijen, A. M. Droplet microfluidics for kinetic studies of viral fusion. Biomicrofluidics 10, 024102 (2016).
25. Parsa, M. K., Hormozi, F. & Jafari, D. Mixing enhancement in a passive micromixer with convergent–divergent sinusoidal micro-
channels and different ratio of amplitude to wave length. Comput. Fluids 105, 82–90 (2014).
26. Kim, D., Lee, S., Kwon, T. & Ahn, C. A serpentine laminating micromixer combining splitting/recombination and advection.
LabChip 5, 739–747 (2005).
27. Bhagat, A. & Papautsky, I. Enhancing particle dispersion in a passive planar micromixer using rectangular obstacles. J. Micromech.
Microeng. 18, 085005 (2008).
28. Glasgow, I., Batton, J. & Aubry, N. Electroosmotic mixing in microchannels. LabChip 4, 558–562 (2004).
29. Yaralioglu, G., Wygant, I., Marentis, T. & Khuri-Yakub, B. Ultrasonic mixing in microfluidic channels using integrated transducers.
Anal. Chem. 76, 3694–3698 (2004).
30. Tice, J. D., Song, H., Lyon, A. D. & Ismagilov, R. F. Formation of droplets and mixing in multiphase microfluidics at low values of
the reynolds and the capillary numbers. Langmuir 19, 9127–9133 (2003).
31. Bringer, M. R., Gerdts, C. J., Song, H., Tice, J. D. & Ismagilov, R. F. Microfluidic systems for chemical kinetics that rely on chaotic
mixing in droplets. Philos. Trans. Math. PhysEng. Sci. 2004(362), 1087–1104 (1818).
32. Sarrazin, F. et al. Mixing characterization inside microdroplets engineered on a microcoalescer. Chem. Eng. Sci. 62, 1042–1048
(2007).
33. Kinoshita, H., Kaneda, S., Fujii, T. & Oshima, M. Three dimensional measurement and visualization of internal flow of a moving
droplet using confocal micro-PIV. LabChip 7, 338–346 (2007).
34. Cubaud, T. & Mason, T. G. Capillary threads and viscous droplets in square microchannels. Phys. Fluids 20, 053302 (2008).
35. Chen, X., Glawdel, T., Cui, N. & Ren, C. L. Model of droplet generation in flow focusing generators operating in the squeezing
regime. Microfluid. Nanofluid. 18, 1341–1353 (2015).
36. Dupin, M. M., Halliday, I. & Care, C. M. Simulation of a microfluidic flow-focusing device. Phys. Rev. E 73, 055701(R) (2006).
37. Mamet, V., Namy, P. & Dedulle, J.-M. Numerical modeling of flow focusing: Quantitative characterization of the flow regimes.
Phys. Fluids 29, 093606 (2017).
38. Hoang, D. A., Portela, L. M., Kleijn, C. R., Kreutzer, M. T. & Steijn, V. Dynamics of droplet breakup in a T-junction. J. Fluid Mech.
717, R4 (2013).
39. Anna, S. L., Bontoux, N. & Stone, H. A. Formation of dispersions using ‘“flow focusing”’ in microchannels. Appl. Phys. Lett. 82, 3
(2003).
40. Yue, P., Zhou, C., Feng, J. J., Ollivier-Gooch, C. F. & Hu, H. H. Phase-field simulations of interfacial dynamics in viscoelastic fluids
using finite elements with adaptive meshing. J. Comput. Phys. 219, 47–67 (2006).
41. Sudarsan, A. P. & Ugaz, V. M. Multivortex micromixing. PNAS 103(19), 7228–7233 (2006).
42. McDonald, J. C. et al. Fabrication of microfluidic systems in poly(dimethylsiloxane). Electrophoresis 21, 27–40 (2000).
43. Bukatin, A. S. et al. Fabrication of high-aspect-ratiomicrostructures in polymer microfluid chips for in vitrosingle-cell analysis.
Tech. Phys. 61, 1566 (2016).
44. Kockmann, N. Transport Phenomena in Microprocess Engineering (Springer, 2008).
45. Chen, J. M., Kuo, M.-C. & Liu, C.-P. Control of droplet generation in flow-focusing microfluidic device with a converging-diverging
nozzle-shaped section. Jpn. J. Appl. Phys. 50, 107301 (2011).
46. Baret, J.-C., Kleinschmidt, F., Harrak, A. E. & Griffiths, A. D. Kinetic aspects of emulsion stabilization by surfactants: a microfluidic
analysis. Langmuir 25(11), 6088–6093 (2009).
47. Bruus, H. Theoretical Microfluidics (Oxford University Press, 2008).
48. Muller, C. B. et al. Precise measurement of diffusion by multi-color dual-focus fluorescence correlation spectroscopy. EPL 83,
46001 (2008).
49. Loman A. Molecular Sizing using Fluorescence Correlation Spectroscopy. Dissertation, Göttingen 2010.
50. Thielicke, W. & Stamhuis, E. J. PIVlab: towards user-friendly, affordable and accurate digital particle imagevelocimetry in MATLAB.
J. Open Res. Soft. 2(1), e30 (2014).
51. Georgiou, C. D., Grintzalis, K., Zervoudakis, G. & Papapostolou, I. Mechanism of Coomassie brilliant blue G-250 binding to
proteins: a hydrophobic assay for nanogram quantities of proteins. Anal. BioanalChem 391, 391–403 (2008).
Acknowledgements
The work was supported by Russian Science Foundation (Project No. 20-74-10117).
Author contributions
I.K., A.E. and A.B. designed research; K.B. and A.B. performed numerical simulations, N.F., I.K., V.K. and A.B.
performed experimental studies; K.B., N.F., I.K., V.K., A.E. and A.B. analyzed the data; K.B., I.K. and A.B. wrote
the paper. All authors reviewed the manuscript.
Competing interests
The authors declare no competing interests.
Additional information
Supplementary Information The online version contains supplementary material available at https://doi.org/
10.1038/s41598-021-88174-y.
Correspondence and requests for materials should be addressed to A.S.B.
Reprints and permissions information is available at www.nature.com/reprints.
Publisher’s note Springer Nature remains neutral with regard to jurisdictional claims in published maps and
institutional affiliations.
Scientific Reports | (2021) 11:8797 | https://doi.org/10.1038/s41598-021-88174-y 9
Vol.:(0123456789)www.nature.com/scientificreports/
Open Access This article is licensed under a Creative Commons Attribution 4.0 International
License, which permits use, sharing, adaptation, distribution and reproduction in any medium or
format, as long as you give appropriate credit to the original author(s) and the source, provide a link to the
Creative Commons licence, and indicate if changes were made. The images or other third party material in this
article are included in the article’s Creative Commons licence, unless indicated otherwise in a credit line to the
material. If material is not included in the article’s Creative Commons licence and your intended use is not
permitted by statutory regulation or exceeds the permitted use, you will need to obtain permission directly from
the copyright holder. To view a copy of this licence, visit http://creativecommons.org/licenses/by/4.0/.
© The Author(s) 2021
Scientific Reports | (2021) 11:8797 | https://doi.org/10.1038/s41598-021-88174-y 10
Vol:.(1234567890)You can also read